


Abstract
A global scale study of the association between aerosol loading and lightning production was conducted, using a full year's data for 2012 (as well as seasonal data) of the cloud-to-ground lightning record from the world wide lightning location network and aerosol optical depth measured by MODIS. 70% of all grid squares examined and 94% of the statistically significant ones had higher flash densities under polluted conditions than the clean ones. This trend is evident for large continental regions in North, Central and South America, Europe, southern Africa and north-east Australia. A detailed examination of the link to the meteorology was performed for four continental regions: the Amazon, North America, southern Africa and the Maritime Continent. The findings showed a similar trend under different meteorological conditions (defined by subsets of specified CAPE values and pressure velocity at 400 hPa). The results of this study suggest a route to association between aerosol loading and lightning-production rates in thunderclouds.
Export citation and abstract BibTeX RIS

Original content from this work may be used under the terms of the Creative Commons Attribution 3.0 licence.
Any further distribution of this work must maintain attribution to the author(s) and the title of the work, journal citation and DOI.
1. Introduction
Lightning is one of the most fascinating, yet least understood phenomena in cloud physics. Moreover, in developing countries, lightning is among the deadliest meteorological phenomena (Raga et al 2014). It causes severe damage to infrastructure, particularly the electrical power industry (Mills et al 2010).
Evidence of lightning's spatial distribution around the globe has been available for almost 100 years (Brooks 1925), but an accurate and detailed picture has been provided only in the last three decades based on satellite measurements. These spaceborne data demonstrate the sharp contrast in electrical activity between land and ocean (Christian et al 2003, Cecil et al 2005). The dominance of continental electrical activity is attributed to thermodynamic conditions as well as to the aerosol amount and properties (Williams and Stanfill 2002). Aerosols supply cloud condensation nuclei (CCN), and ice nuclei (IN) and thus affect the initial size distribution of droplets and ice crystals. A cloud forming in a polluted environment will initially have more but smaller droplets with a narrower size distribution (Squires 1958, Squires and Twomey 1960, Warner and Twomey 1967, Twomey 1977). This initial change will affect the coupled microphysical-dynamic system within the cloud. The reduced mean size of cloud droplets, suppresses the collision-coalescence and warm-rain processes, permitting more cloud droplets to cross the 0 °C level and freeze (Rosenfeld et al 2008, Rosenfeld and Woodley 2000, Khain et al 2005, Tao et al 2012), thus enhancing the growth of large hail, changing the depth of the mixed-phase region and creating additional positive buoyancy (and stronger updrafts) via the release of latent heat in a colder environment. Furthermore, changes in the concentration of IN impact the freezing processes (Cantrell and Heymsfield 2005) and hence all the processes involving mixed-phase particles. The end result of the above processes and feedbacks is often expressed in the formation of invigorated clouds under high aerosol-loading conditions. Recent studies have shown that the invigoration effect (see reviews by Tao et al 2012 and Altaratz et al 2014) can be reflected in deeper clouds with a larger area (cloud fraction) and larger water and ice masses (Andreae et al 2004, Koren et al 2005, 2010, Rosenfeld et al 2008, Tao et al 2012, Fan et al 2013). Surface rain, as the end result of many of the cloud's processes, has also been shown to be affected by changes in aerosol loading (Levin and Cotton 2008, Khain 2009). Some studies have shown rain enhancement (Lin et al 2006, Martins et al 2009, Koren et al 2012) and others pointed to rain suppression (Rosenfeld 2000, Huang et al 2009). The electric charge separation mechanism is part of this chain of cloud processes and as such it is also affected by changes in aerosol loading. The main charging mechanism is considered to be collisions and rebound between graupel particles and ice crystals in the presence of supercooled water (Saunders et al 1991, Takahashi 1978). The spatial separation between positive and negative charges within the cloud occurs because of the differential movement of the charged particles (Saunders 2008). Therefore, updraft magnitude (Deierling and Petersen 2008), depth of the mixed‐phase region and graupel and ice-mass fluxes (Deierling et al 2008) are all positively correlated with the intensity of the electrical activity. In convective clouds, the coupling of microphysical and dynamic processes means that such factors are directly affected by aerosol properties.
Previous studies have demonstrated the aerosol effect on the electrical activity of thunderclouds. Sherwood et al (2006) showed a correlation between maxima in lightning activity and a smaller effective diameter of ice crystals near thunderclouds' tops. Yuan et al (2011) reported an increase in lightning frequency over the western Pacific due to an increase in particle loading produced by volcanic activity. Altaratz et al (2010) studied the Amazonian lightning response to smoke and concluded that up to mid-level aerosol loading, an increase in particle concentration leads to deeper clouds with more frequent lightning. Kucienska et al (2013) showed an increase in lightning flash density as a function of aerosol optical depth (AOD) for large continental regions and some coastal maritime regions. Thornton et al (2017) showed enhanced lightning density over shipping lanes in the northeastern Indian Ocean and the South China Sea. Some works have studied Pyrocumulus clouds (thunderclouds forming over fires, Lang et al 2014, Rosenfeld et al 2007). Other studies have shown a link between the fraction of positive ground flashes and aerosol loading (Lyons et al 1998, Murray et al 2000, Rosenfeld et al 2007).
In addition, other reports have shown a link between cloud top height and lightning activity (Williams 1985, Price and Rind 1992, Yoshida et al 2009, Wong et al 2013) for different thermodynamic conditions and geographical regions. All of these strengthen the proposed association between the cloud invigoration effect (deeper clouds) and lightning production.
Any study that attempts to relate an aerosol effect to cloud properties (including their electrical activity) needs to examine the role of meteorological conditions as well. The disentanglement of thermodynamics' and aerosol's impact on clouds' properties in general, and on lightning production specifically, is very challenging (Rosenfeld et al 2012). The thermodynamic conditions will dictate the instability, hence will influence the updrafts, cloud base height, and the depth of the cloud. One way to untangle aerosol from meteorology is to analyze subsets of data that represent similar meteorological conditions (Koren et al 2005, Jiang et al 2008, Koren et al 2010, Small et al 2011, Heiblum et al 2012, Koren et al 2012). The meteorological subsets are determined using atmospheric variables that correlate well with cloud properties. The meteorological variance is restricted by analyzing aerosol and clouds as a function of the variable range. Koren et al (2012) used reanalysis data of vertical velocity in pressure coordinates at the 400 hPa level (ω400 hPa) to examine correlations between AOD and rain rates. To further examine the link between lightning activity and meteorology, it is possible to use convective available potential energy (CAPE), as many studies, such as Rutledge et al (1992) and Williams et al (2002), among others, have shown a high correlation between CAPE values and lightning production.
In this study, we explored the relationship between cloud-to-ground lightning density and aerosol loading on a global scale. There was a special focus on large continental areas and a detailed analysis was performed for four specific regions: the Amazon, central and eastern North America, southern Africa and the Maritime Continent.
2. Datasets and methodology
Column integrated aerosol optical depth (AOD) and ice water path (IWP) data were derived from observations collected by the moderate resolution imaging spectroradiometer (MODIS), located on the sun-synchronous Aqua satellite that passes at ~13:30 local time (LT). The level 3 data in 1° resolution were used. AOD has been shown to be a first approximation for CCN amounts (Andreae 2009). Some studies have proposed the use of an aerosol index, defined as the fine aerosol fraction of the AOD (Nakajima et al 2001, Gryspeerdt et al 2014a, 2014b), but since over land, the MODIS data for the aerosol fine-fraction is not reliable (due to limitations of the fine and coarse models over land and surface reflectance uncertainty, Levy et al 2010) we chose to use AOD.
Cloud-to-ground lightning data were provided by the World Wide Lightning Location Network (WWLLN) for the time window between 12:00 to 18:00 local time (LT). This time window (around the time of the Aqua satellite overpass) captures the afternoon and early evening electrical activity and allows statistically significant dataset. The WWLLN consisted of 68 stations (as of October 2012, today it has over 70) distributed worldwide (mostly in research centers and universities) that detect the Very Low Frequency (VLF) radiation associated with intense cloud-to-ground strokes (Lay et al 2007). The location of the stroke is determined by inverting the signals received by at least five stations. Several recent studies have examined the WWLLN's detection capabilities. Abarca et al (2010) found the detection efficiency to be about 10% for currents stronger than ±35 kA (meaning that there is a strong dependence on peak current), over North America. Rudlosky and Shea (2013) evaluated the WWLLN's detection efficiency as 9% over the Western Hemisphere, between 38°N to 38°S. Virts et al (2013) estimated the global detection efficiency as 10% of all strokes. Since the WWLLN detects only the high-end tail of the lightning current distribution, a complete statistical link between lightning and aerosol distributions is not possible. It allows us however to characterize general trends between AOD and the most energetic portion of the lightning activity.
For the regional analysis (section 3.2) we used meteorological data that were provided by the ECMWF ERA-Interim products, at 1° × 1° resolution (Dee et al 2011). The two thermodynamic parameters that were used to slice the data per meteorological conditions are the Convective Available Potential Energy (CAPE, 3 hourly product) and the pressure velocity (ω) at 400 hPa (ω400 hPa, 6 hourly product), as a measure of the strength of the convection. Both parameters were shown to be significantly correlated to the properties of deep convective clouds (Rutledge et al 1992, Williams et al 2002, Koren et al 2012, Soula and Chauzy 2001, Tapia et al 1998). For each location, we used the values of CAPE and ω400 hPa at the middle point of each grid square, at times within the range of 12:00 to 18:00 LT to represent the thermodynamic conditions close to the thunderstorm's time of occurrence.
The analyzed data set included the grid squares with at least one detected flash within 2012, in order to avoid regions that do not support any electrical activity. For those grid squares we chose the days with available AOD data and IWP>10 g m−2 (to ensure the presence of convective clouds with glaciated tops). Grid squares with less than 5 d in each class (clean and polluted) were filtered out. The relationship between lightning flash density and aerosol loading was studied by evaluating the average flash densities L (# of flashes per grid square per 6 h) measured on polluted vs. clean days.
The AOD ranges that represent polluted and clean days were defined locally in each grid square in order to average over a similar number of samples per aerosol loading class. The local AOD ranges (per grid square) were selected in the following way: all analyzed days (with available AOD data and IWP>10 g m−2) were divided into three equal-sample groups. The lower third was then labeled as clean and the highest third as polluted (the middle third was not analyzed). This division was chosen so as to enhance the contrast between the clean and polluted subsets. In addition, the data were restricted to AOD < 0.4 to minimize problems related to cloud contamination (misidentification of small clouds as aerosol, Platnick et al 2003) and absorbing aerosols (Koren et al 2008). The hygroscopic growth of aerosols in a humid environment, (Feingold and Morley 2003, Flores et al 2012) may also affect the AOD. We neglect this vs. the trends shown here because such humidification is confined to immediate vicinity of the clouds (Bar-Or et al 2012) and the AOD variance due to daily changes in RH is below 20%, yielding cloud development bias under 10% (Altaratz et al 2013).
To check the statistical significance of the results a t-test was performed and the statistically significant grid squares are presented separately (see figures 2–4). The t-test examined if the mean flash density detected in polluted days vs. the one detected in clean days (per grid square—in the global analysis and per interval of the meteorological variable—in the regional analysis) are statistically different (using a one tailed test, under 95% significance level in the global analysis and 99% in the regional one).
Four large continental regions with meteorological conditions that support significant electrical activity were selected for more detailed analysis: Amazon, central and eastern North America, southern Africa and the Maritime Continent (see green boxes on figure 1). To better distinguish between aerosol effects on the electrical activity of thunderclouds and the influence of meteorological conditions on both AOD and cloud properties over these regions, we explored the relationship between flash density and aerosol loading per given subsets of the data with similar meteorological conditions.
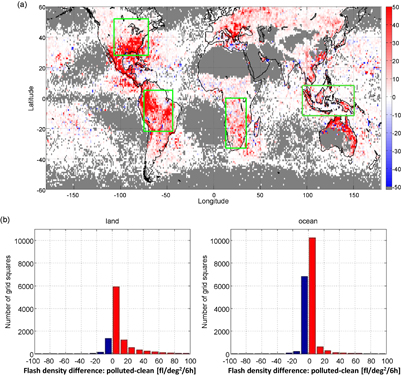
Figure 1. (a) Global map of differences between flash densities observed on polluted and clean days for 2012. The gray areas contain insufficient data for analysis. The green boxes mark the analyzed regions in section 3.2. (b) Histograms of the differences between flash densities on polluted and clean days [#/deg2/6 hr] for land (left) and ocean (right).
Download figure:
Standard image High-resolution image3. Results
3.1. Global analysis
Figure 1 presents a map (1a) of the differences between the average L (# of flashes per grid square per 6 h) on polluted and clean days over a global grid of 1° × 1° resolution. The analysis includes the days with AOD data and IWP>10 g m−2 in grid squares with at least 1 detected flash for 2012. For ~70% of the analyzed grid squares, higher L is observed in the polluted subset. Specifically, large areas of South, Central and North America, southern Africa, Europe, East Asia, and north-east Australia exhibit significantly larger L values during the polluted days. Figure 1(b) presents the histograms of the differences between the average L on polluted and clean days for land vs. ocean. 85% of continental grid squares show higher L in polluted days and 61% of the oceanic ones. Figure S1 (in the SI available at stacks.iop.org/ERL/12/114037/mmedia) presents the histograms of mean AOD for continental and oceanic grid squares (for the analyzed days included in figure 1).
The fraction that shows higher L in the polluted days is much higher when filtering out pixels with insignificant statistics. Amongst the grid squares that are statistically significant (i.e. past a t-test under 95% significance level; figure 2) ~94% have higher L under polluted vs. clean conditions. The t-test examines if the mean flash density in polluted days vs. the one in clean days (per grid square) are statistically different (using a one tailed test). The histograms in figure 2(b) show that 98% of the continental grid squares have larger L values on polluted days. Since lightning flash density over the oceans is significantly lower as compared to the continents, the most energetic tail of the lightning distribution as measured by the WWLLN is expected to be especially susceptible to such tendency. Indeed, our data show that over the oceans the counts per pixel are much lower compared to the continents. Lower counts per pixel imply that fewer data can pass the statistical significance text (see the large gray areas in figure 2(a)). Nevertheless, 75% of the oceanic pixels that passed the t-test show higher lightning density on polluted days.
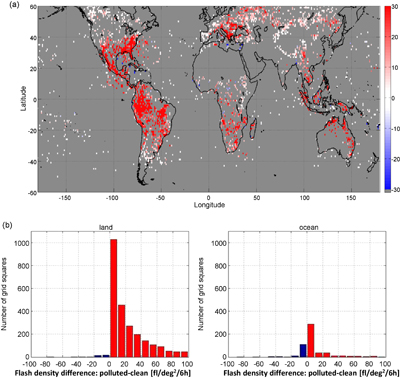
Figure 2. (a) Global map of differences between flash densities observed on polluted and clean days for 2012. The gray areas contain insufficient data for analysis or failed the t-test (at the 95% confidence level). (b) Histograms of the differences between flash densities on polluted and clean days [#/deg2/6 hr] for land (left) and ocean (right).
Download figure:
Standard image High-resolution imageEven stronger results are observed for seasonal separations (to reduce the meteorological variance). Figure 3 shows the differences between L averaged on polluted and clean days, for the four seasons of 2012. Since lightning data within a 6 hour range are not abundant for each season and each AOD regime, a minimum of 2 day samples is required for polluted and clean conditions in each grid square for this analysis. Independent of the meteorological conditions for each season, over 98% of the grid squares that satisfied the t-test (under 95% confidence level) showed higher L on polluted days. We note there are regions that suffer from low detection efficiency of the WWLLN, like West Africa (which can be recognized during the boreal summer).
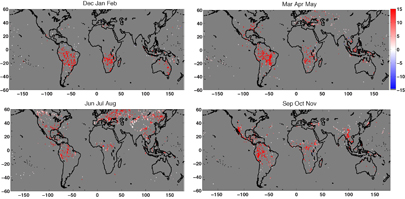
Figure 3. Difference between lightning densities observed on polluted and clean days, for the four seasons of 2012. The gray areas contain insufficient data for analysis or failed the t-test (at the 95% confidence level).
Download figure:
Standard image High-resolution image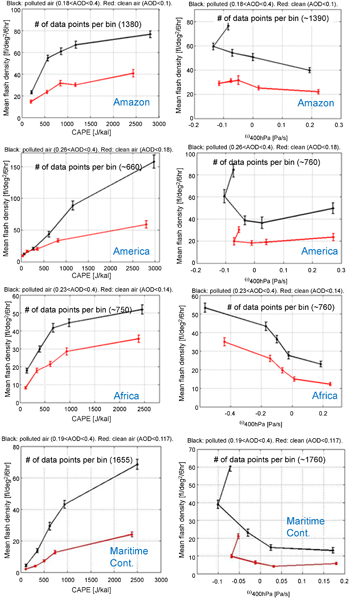
Figure 4. Mean flash density as a function of CAPE (left column), ω400 hPa (right column), for clean (red curves) and polluted (black curves) conditions for the Amazon (March–May 2012, 14 LT, upper row), North America (June–August 2012, 13 LT, second from top row), southern Africa (January–February, and December 2012, 14 and 17 LT, third from top row) and the Maritime Continent (March–May 2012, 14 LT, bottom row). The specified values of AOD ranges and the numbers of analyzed data points (per bin) appear in each panel. Error bars represent the standard deviation within each interval. Black curves exceed the red ones everywhere.
Download figure:
Standard image High-resolution image
The above results show that L is correlated with AOD for large continental regions. This association may indicate an aerosol effect on electrification processes in thunderclouds; however, it can also be a consequence of the influence of the meteorology on both aerosol loading and the cloud microphysical properties that are relevant for lightning production. To further explore this possibility, the aerosol effects on lightning activity were examined as a function of meteorological variables for four selected regions (denoted by the green squares in figure 1): Amazon, North America, south Africa and the Maritime Continent.
3.2. Regional analysis
Figure 4 shows how L is linked to the meteorological variables CAPE and ω400 hPa for the four selected continental regions (Amazon—upper row, North America—second from top row, southern Africa—third from top row and the Maritime Continent−bottom row). The Amazon data correspond to March–May 2012 (the rainy season). The northern American data correspond to the boreal summer (June–August 2012), the southern African data correspond to the austral summer (January–February, and December 2012) and the Maritime Continent data correspond to March–May 2012. The specific periods were selected in accordance with the maximal lightning activity.
These links are examined for two AOD classes (clean and polluted). As explained in section 2, these two AOD regimes were defined separately in each geographical region in order to obtain a similar number of data samples for each AOD range (the specified values of these AOD ranges and the numbers of averaged data points are presented in each panel in figure 4). The intervals of the meteorological variables were also selected to provide a similar number of data samples per interval. Error bars represent the standard error within each interval.
In all four geographical regions and for all CAPE and ω400 hPa levels, the polluted subsets produced more lightning (as measured by the WWWLN) than the clean ones.
A clear positive trend between the CAPE levels and the lightning activity is also shown indicating that indeed CAPE is an effective proxy for lightning production (see figure S3 in the SI for L as a function of AOD for 3 specified narrow ranges of CAPE). As for the ω400 hPa, we also note a transition for an increase in L when the pressure vertical velocities become negative (indicating an average transition from downdrafts to updrafts in a 1 by 1 degree scale), besides near the lowest end where more lightning are observed in weaker updrafts in all regions but Africa. The results in this part are statistically significant at 99% significance, using the t-test that examines if the mean flash density in polluted days is statistically different from the mean in clean days (per interval of the meteorological variable) using a one-tailed test.
4. Discussion and summary
A global analysis at 1° × 1° resolution of high peak current lightning density recorded on polluted and clean days throughout 2012 showed a general trend of an increase in L with aerosol loading (figure 1). Examining only the statistically significant grid squares confirmed that 94% of them showed this trend (98% of the continental grid squares and 75% of the oceanic ones; figures 2(a) and (b)). It was evident for large continental regions in North, Central and South America, Europe, southern Africa, and north-east Australia. The seasonal analysis, which limited the variance of meteorological conditions, further confirmed this trend (see figure 3).
A link between high aerosol loading and increased lightning activity is consistent with the cloud invigoration effect by aerosol, which links higher cloud tops to polluted environments (per subsets of similar meteorological conditions) (Tao et al 2012, Altaratz et al 2014). This effect has been observed in many locations around the globe (Andreae et al 2004, Koren et al 2005, 2010, Meskhidze et al 2009, Zhang et al 2007). Smaller drops suppress the collision-coalescence and warm-rain processes (Koren et al 2014). It yields larger amounts of supercooled droplets carried to the mixed phase region, where the release of latent heat by freezing higher in the clouds enhances the updraft (Rosenfeld et al 2008, Rosenfeld and Woodley 2000). There is also a known link between the vertical development of continental clouds and lightning activity (Williams 1985, Price and Rind 1992, Yoshida et al 2009, Altaratz et al 2010, Wong et al 2013), with larger vertical extent linked to stronger electrical activity.
These feedbacks suggest that higher aerosol loading leads to an enhanced updraft (e.g. Mansell and Ziegler 2013) and an increase in the amount of supercooled droplets in the mixed-phase region that will enhance the graupel and ice-mass fluxes (Deierling et al 2008), all leading to greater charge separation (Deierling and Petersen 2008).
In an attempt to disentangle the aerosol and meteorological effects, four regions were scrutinized: the Amazon, North America, southern Africa and the Maritime Continent (see green boxes in figure 1). This analysis showed that the first factor determining the level of electrical activity is atmospheric instability. In all four regions, the lightning activity increased with CAPE and was shown to be inversely proportional to ω400 hPa over the Amazon and southern Africa (showing lower sensitivity over North America). However, the trends between the lightning activity and those main meteorological parameters (CAPE and ω400 hPa) were strongly modulated by these values for aerosol loading, showing another controlling factor over the lightning activity. The detected lightning activity was always significantly higher on polluted days than on clean ones. This was true for all CAPE and ω400 hPa subsets. The robustness of these results leads us to assume that the higher L observed in polluted conditions is a direct effect of the aerosol loading on cloud processes (including the charge separation process), for specified thermodynamic conditions.
Since the WWLLN dataset used in this study included only high peak current cloud-to-ground flashes, the trends in the number of measured flashes as recognized here might be caused by changes in the total lightning amount or by changes in the flash current distribution (more high peak current flashes). Either way, this study demonstrates a possible effect of ambient aerosol loading on the potential of convective clouds to generate strong electrical fields and lightning. This should be further studied with more sensitive lightning-detection networks.
Acknowledgments
The authors would like to thank Professor Earle Williams and another anonymous reviewer for their contribution to the revision of this paper. The World Wide Lightning Location Network (http://wwlln.net), resulting from a collaboration among over 40 universities and institutions, is acknowledged for providing the lightning location data used in this study. CAPE, RH and ω data were downloaded from the ECMWF ERA-Interim dataset. MODIS products were downloaded from http://ladsweb.nascom.nasa.gov/data/search.html. Partial funding in Mexico was available through grants PAPIIT IA100612 and Sep-Conacyt 154729. I K and O A wish to acknowledge funding by the European Research Council under the European Union's Seventh Framework Programme (FP7/2007–2013)/ERC Grant agreement no. 306965. A K was supported, in part, by NSF AGS-1639868.