

Abstract
Land surface hydrology can play a crucial role during extreme events such as droughts, floods and even heat waves. We introduce in this study a new hydrological dataset for Europe that consists of soil moisture, runoff and evapotranspiration (ET). It is derived with a simple water balance model (SWBM) forced with precipitation, temperature and net radiation. The SWBM dataset extends over the period 1984–2013 with a daily time step and 0.5° × 0.5° resolution. We employ a novel calibration approach, in which we consider 300 random parameter sets chosen from an observation-based range. Using several independent validation datasets representing soil moisture (or terrestrial water content), ET and streamflow, we identify the best performing parameter set and hence the new dataset. To illustrate its usefulness, the SWBM dataset is compared against several state-of-the-art datasets (ERA-Interim/Land, MERRA-Land, GLDAS-2-Noah, simulations of the Community Land Model Version 4), using all validation datasets as reference. For soil moisture dynamics it outperforms the benchmarks. Therefore the SWBM soil moisture dataset constitutes a reasonable alternative to sparse measurements, little validated model results, or proxy data such as precipitation indices. Also in terms of runoff the SWBM dataset performs well, whereas the evaluation of the SWBM ET dataset is overall satisfactory, but the dynamics are less well captured for this variable. This highlights the limitations of the dataset, as it is based on a simple model that uses uniform parameter values. Hence some processes impacting ET dynamics may not be captured, and quality issues may occur in regions with complex terrain. Even though the SWBM is well calibrated, it cannot replace more sophisticated models; but as their calibration is a complex task the present dataset may serve as a benchmark in future. In addition we investigate the sources of skill of the SWBM dataset and find that the parameter set has a similar impact on the simple model results as the choice of the forcing dataset. The newly derived SWBM dataset is of relevance for a range of applications given the deficit of available land datasets. It is available for download on www.iac.ethz.ch/url/SWBM-Dataset.
Export citation and abstract BibTeX RIS

Content from this work may be used under the terms of the Creative Commons Attribution 3.0 licence. Any further distribution of this work must maintain attribution to the author(s) and the title of the work, journal citation and DOI.
1. Introduction
Soil moisture plays a key role in the climate system as highlighted by many past and recent studies (see Seneviratne et al 2010 for a review). Acting at the interface between land and the atmosphere, it may influence the corresponding exchange of water and energy. Soil moisture availability impacts evaporation of the bare soil as well as transpiration of plants and therefore the partitioning of available energy into the sensible and latent heat fluxes. Consequently, it may affect surface temperature (Seneviratne et al 2006a, Hirschi et al 2011, Mueller and Seneviratne 2012) and even precipitation (Beljaars et al 1996, Koster et al 2004, Hohenegger et al 2009, Taylor et al 2012, Guillod et al 2015). Moreover, soil moisture is one of the few variables of the climate system with a considerable persistence (Delworth and Manabe 1988, Entin et al 2000, Koster and Suarez 2001, Seneviratne et al 2006b, Orth and Seneviratne 2012), which makes it comparatively well predictable (e.g. Calanca et al 2011, Orth and Seneviratne 2013). Through the storage capacity of the soil, soil moisture accumulates anomalies of the atmospheric forcing such that these are preserved in the soil.
Despite its importance, soil moisture is poorly observed in contrast to e.g. temperature or precipitation. Only relatively few (point) measurements are available, covering rather short time periods (Robock et al 2000, Dorigo et al 2011). Models may be employed to compensate for the lack of observations, but only in terms of soil moisture dynamics (i.e. changes over time), whereas their absolute soil moisture storage may differ significantly (Mahanama and Koster 2003, Koster et al 2009). Furthermore sophisticated models are dependent on information about vegetation and soil characteristics and there is considerable disagreement among available products (Guillod et al 2013). The heterogeneous nature of the soil in both the horizontal and vertical dimension, as well as changes of its characteristics over time, make it difficult to derive corresponding reliable high-resolution maps required by models. Nevertheless, there are efforts towards an observation-based calibration of such models (e.g. Harrison et al 2012, Santanello et al 2013), pointing out the great potential performance arising from their complexity. In this study, however, we follow a different approach and employ a conceptual model: the advantage of this approach is that thanks to its low number of parameters and the low computational demand we can sample the entire parameter space to derive an optimal calibration on a continental scale.
Based on this approach, we introduce here a new hydrological dataset for Europe, which we then compare and evaluate against several existing state-of-the-art products. For this purpose we use a simple hydrological model (simple water balance model—SWBM) which derives key quantities of the land surface (soil moisture, evapotranspiration (ET), runoff) from meteorological forcing variables (precipitation, radiation, temperature). We apply the model across Europe and focus on the last 30 years. As any hydrological model, the model includes parameters to reflect e.g. soil and vegetation characteristics. To determine these parameters we sample the entire parameter space by running the model with 300 random parameter sets. The 300 resulting model runs are validated against a number of soil moisture, runoff and ET datasets, using several metrics of agreement. This allows us to identify the best model run, and the corresponding optimal model parameters in Europe. This methodology therefore does not rely on uncertain information on soil and vegetation characteristics, instead it allows us to estimate hydrological dynamics (i.e. changes over time) from exclusively meteorological forcing.
During extreme events such as heat waves or droughts soil moisture is particularly important (Seneviratne et al 2006a, Fischer et al 2007, Lorenz et al 2010, Hirschi et al 2011, Mueller and Seneviratne 2012, Quesada et al 2012). Due to the lack of observations and missing model-based reference datasets many previous studies used proxy information to replace soil moisture, mostly derived from precipitation. We employ the inferred SWBM dataset to compare anomalies of soil moisture and temperature during the recent European heat waves in 2003 (central Europe) and 2010 (Russia).
2. Methodology
2.1. Simple water balance model (SWBM)
We employ in this study a conceptual hydrological model to derive soil moisture, ET and runoff from meteorological information alone. The model was initially proposed by Koster and Mahanama 2012, and we employ here the version introduced by Orth and Seneviratne 2013 (referred to as OS13 in the following) which is adapted to the daily time scale. From the water balance equation we compute soil moisture ( ) at the beginning of time step
  , using observed precipitation (Pn) accumulated during time step n, along with modelled, accumulated ET (En) and runoff (Qn). ET and runoff are obtained through the assumption that they depend solely on soil moisture when normalized with net radiation and precipitation, respectively:

where Rn denotes net radiation accumulated during time step n, λ and  are the latent heat of vaporization and the density of water, respectively, which are used to scale En to the unit of Rn. Furthermore, cs, α, γ and
  are (fitted) model parameters: cs is the water holding capacity used to scale wn, α and γ are exponents determining the shape of the functions and therefore the sensitivity of runoff and ET to (changes in) soil moisture in different soil moisture conditions, and
  indicates the maximum evaporative fraction and hence reflects the local vegetation characteristics. Note that the basic concept of runoff and ET formation used here is well established and is employed in many similar conceptual models (e.g. Manabe 1969, Bergström 1995).
The SWBM also considers snow through a degree-day approach with an assumed threshold temperature of  . Snow melts above this temperature, where the melting intensity depends linearly on temperature as determined by a melting parameter. In the OS13 model version, snow is formed from precipitation if the temperature is below the threshold. In this study, snow is also assumed to (partly) form if the temperature is slightly above the threshold;
  of the precipitation form snow at
  , respectively. In case of melting snow we extended the OS13 model version such that the required energy is subtracted from the available net radiation of the particular day. More details on the model can be found in the supplementary information (section S1 available at stacks.iop.org/ERL/10/044012/mmedia).
2.2. Model parameters
We aim to sample the entire parameter space to assess the maximum possible impact of the parameters on model results. For this purpose, we employ 300 parameter sets, whereby we choose each parameter randomly from an meaningful range. This range is derived for each parameter from a set of values from observation-based calibration results of the SWBM in Orth and Seneviratne 2014, where the model is calibrated in 400 near-natural catchments across Europe using observed streamflow. To minimize the impact of outliers we use the 5% and 95% quantile of the 400 inferred values of any parameter as bounds for its range. Random values for any parameter are then derived from 20 equally spaced values that span the whole derived range of the considered parameter.
For simplicity, each random parameter set is applied over the whole domain and time period, i.e. parameter values are constant across Europe and during the considered time period 1984-2013. An overview of the model parameters is given in table 1.
2.3. Validation and classification
We perform a comprehensive validation of the model results derived with each random parameter set with respect to soil moisture, ET and runoff on the daily and/or monthly time scale (depending on the validation dataset, see table 2). We compare the modelled dynamics (i.e. the time variability) using (i) seasonal correlations (correlating actual time series) and (ii) anomaly correlations (correlating time series after subtraction of the mean seasonal cycle). Further we validate the absolute values with observational data through computing (iii) the absolute mean bias and (iv) the Nash–Sutcliffe efficiency (Nash and Sutcliffe 1970, referred to as NSE in the following). In the case of soil moisture, we only validate the temporal variability, because absolute soil water content is highly dependent on model (Koster et al 2009) and location (Mittelbach and Seneviratne 2012). Please refer to the supplementary material (section S2 available at stacks.iop.org/ERL/10/044012/mmedia) for further information on the validation metrics.
Note that when performing any validation we focus on May–October to exclude the freezing period because during the latter hydrological dynamics except from snow are low (with consequently limited impact on climate) and validation measurements may be erroneous due to ice formation.
In order to determine the best of the 300 random parameter sets, we rank the corresponding model outputs. Ranks are computed against all validation datasets, all validation metrics, and at the daily and monthly time scale, i.e. for each model output we compute 18 ranks. The model output with the lowest sum of ranks constitutes the new SWBM hydrological dataset (see table 1 for corresponding optimal parameters). However, note that some other parameter sets performed almost similarly well.
Table 1. Summary of model parameters.
| Parameter | Meaning | Considered range | Optimal value |
|---|---|---|---|
Water holding capacity 
|
Maximum water storage | 80–1490 mm | 971 mm |
Runoff function exponent 
|
Sensitivity of (normalized) runoff to soil moisture | 0.4–15 | 10.4 |
ET function exponent 
|
Sensitivity of evaporative fraction to soil moisture | 0.03–1.14 | 1.14 |
maximum ET ratio 
|
Maximum fraction of net radiation that can be transformed into ET | 0.39–0.99 | 0.67 |
| Melting parameter | Speed of snow melting | 0.15–12 | 3.9 |
We then further validate the performance of this new SWBM dataset under extreme conditions. For this purpose we repeat the above-described validation with only the 10% driest or wettest days/months of the respective validation dataset. For simplicity, we focus in the validation of extremes on the anomaly correlation and on the absolute mean bias; corresponding results for the seasonal correlation and the NSE are qualitatively similar (not shown).
3. Data
With each random parameter set we run the SWBM across the European land area (10°W–50°E, 35°N–70°N) with a 0.5° × 0.5° spatial resolution, and over the time period 1984–2013. To run the model, we use precipitation, temperature and net radiation data (section 2.1). As in OS13, we obtained precipitation and temperature data from the E-OBS dataset (Haylock et al 2008), whereby we upscaled the precipitation by 10% to account for the known precipitation undercatch (Hofstra et al 2009, see section S3 available at stacks.iop.org/ERL/10/044012/mmedia). Net radiation is obtained from the NASA/GEWEX SRB dataset (http://gewex-srb.larc.nasa.gov/ (accessed on 28 March 2014)). As this dataset extends only until 2007, we additionally employ in this study a novel radiation dataset from the CERES experiment (http://ceres.larc.nasa.gov/order_data.php (accessed on 28 March 2014)) which extends until 2013. To merge the datasets seamlessly we scale the SRB data to match the mean and standard deviation of the CERES data, separately at each grid point and in each month of the year. To investigate the impact of the forcing dataset on the model results we also force the SWBM with ERA-Interim data (Dee et al 2011).
As listed in table 3, we employ several reference datasets as benchmarks for our new SWBM dataset: (i) ERA-Interim/Land reanalysis (Balsamo et al 2013), (ii) MERRA-Land reanalysis (Reichle et al 2011), along with (iii) simulations from the Global Land Data Assimilation System Version 2 (GLDAS-2, Rodell et al 2004) using the Noah model (Chen et al 1996) and (iv) offline simulations of the Community Land Model Version 4 (CLM4, Oleson et al 2010) forced with observation-based data.
Moreover we use several validation datasets to validate and rank the SWBM output created with each random parameter set (table 2). Depending on the dataset the validation is necessarily based on different time periods as well as temporal and spatial resolutions. We compare the modelled soil moisture with (i) station observations from different climate regimes throughout Europe (Dorigo et al 2011), (ii) GRACE terrestrial water storage measurements (Swenson and Wahr 2006, Landerer and Swenson 2012), and with (iii) soil moisture derived with a similar version of the SWBM (OS13, see also section 2.1), but calibrated locally with streamflow observations ('SWBM-local'). The modelled runoff is validated with stream-gauge observations from 436 catchments with little or no human impact, distributed across the continent (Stahl et al 2010). The modelled ET is compared against a state-of-the-art dataset which is based on a composite of independent ET datasets (Mueller et al 2013).
Table 2. Overview of validation datasets.
| Variable | Dataset | Remark | Spatial resolution | Time period | Time resolution | Reference |
|---|---|---|---|---|---|---|
| Soil moisture | Station observations | Ground measurements (see table S1) | 4 Sites in Finland, 5 in Switzerland, 2 in Italy | Depends on site (see table S1) | daily & monthly | Dorigo et al 2011 |
| GRACE | Satellite-derived terrestrial water storage anomalies |
 200 km 200 km |
2003–2012 | Approx. monthly | Swenson and Wahr 2006 | |
| Stream-flow-calibrated SWBM | Similar model as in this study but calibrated with streamflow | 400 Catchments across Europe | 1984–2007 | Daily and monthly | Orth and Seneviratne 2013 | |
| ET | LandFlux-EVAL | Combination of several ET datasets derived in different ways | 1° × 1° | 1989–2005 | Monthly | Mueller et al 2013 |
| Stream-flow | Stream-gauge observa-tions | Set of long-term measurements from near-natural catchments | 436 Catchments across Europe | 1984–2007 | Monthly | Stahl et al 2010 |
Further details on the forcing and the benchmark and validation datasets are provided in sections S3 and S4.
4. Results
In this section we introduce the new SWBM dataset, validate its performance (against the datasets listed in 2), and compare it with benchmark datasets (see table 3). Note the different spatial resolutions and time periods associated with each product. Moreover, we investigate the sources of skill of the SWBM dataset, and in the latter part we show two example applications.
Table 3. Overview of reference datasets.
| Variable | Dataset | Remark | Spatial resolution | Time period | Time resolution | Reference |
|---|---|---|---|---|---|---|
| Soil moisture, ET, streamflow | ERA-Interim/Land | Land reanalysis | 0.25° × 0.25° (Upscaled here to 0.5° × 0.5°) | 1984–2010 | Daily and monthly | Balsamo et al 2013 |
| MERRA-Land | Land reanalysis | 0.67° × 0.5° (Scaled here to 0.5° × 0.5°) | 1984–2012 | Daily and monthly | Reichle et al 2011 | |
| GLDAS-2-Noah | Land reanalysis | 0.25° × 0.25° (Upscaled here to 0.5° × 0.5°) | 1984–2010 | Daily and monthly | Rodell et al 2004 | |
| CLM4 | Offline simulation | 0.5° × 0.5° | 1984–2010 | Daily and monthly | − |
4.1. Validation of soil moisture
In this section we focus on the modelled soil moisture from the new SWBM hydrological dataset; the seasonal means are displayed in figure 1. There is a general gradient from dry soils in southern Europe to wetter soils in northern Europe. The mean soil moisture across the continent is highest in spring after snow melt and lowest in summer when ET is highest. Furthermore the seasonal variations are highest in southern Europe, whereas in north-western Scandinavia there is almost no soil moisture change throughout the year.
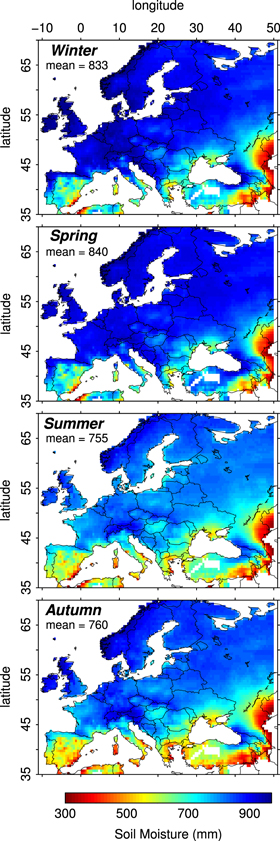
Figure 1. Estimated mean soil moisture across Europe in all seasons. Derived with the best-performing parameter set. Note that the maximum soil moisture is a prescribed model parameter which is constant across the domain.
Download figure:
Standard image High-resolution imageTo investigate the quality of the SWBM soil moisture dataset we compare its performance with the benchmarks against (i) station observations located across the continent (see table S1 for the sites and figure S1 for the performance), (ii) GRACE data (figure S2) and (iii) with SWBM-local (figure S3) (available at stacks.iop.org/ERL/10/044012/mmedia). The overall results are shown in figure 2. We focus on the SWBM and CLM4 results using E-OBS forcing here. The SWBM soil moisture compares overall best with the validation soil moisture products. It generally outperforms the benchmarks. It always ranks best or close to the best, despite its conceptual character and the constant parameters used across the continent. The results are similar in terms of seasonal and anomaly correlations. The high correlation of the SWBM dataset with SWBM-local is noteworthy, as it shows that a general model calibration achieves reasonable results when compared with a local calibration, because in contrast to the present SWBM dataset, SWBM-local is calibrated on catchment (i.e. local) scale.
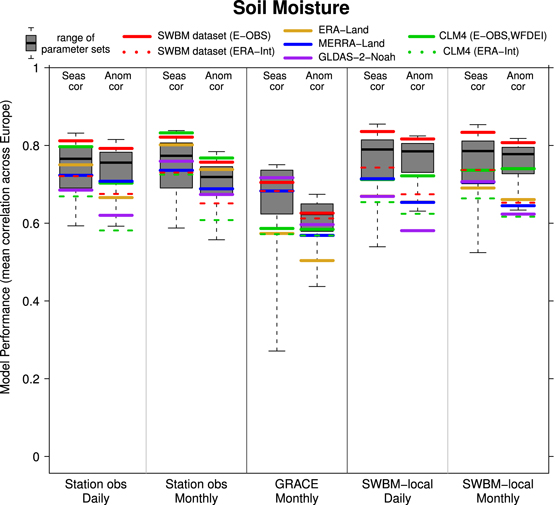
Figure 2. Performance of soil moisture dynamics from the SWBM dataset (best parameters) and all reference datasets (ERA-Land, MERRA-Land, GLDAS-2-Noah, CLM4), assessed against several validation datasets (see table 2), shown by horizontal lines. The gray boxplots denote the range of performance of the SWBM using all considered 300 random parameter sets. Results are shown for monthly and daily data (if available).
Download figure:
Standard image High-resolution imageAs described in section 2.3, the best SWBM parameter set from all 300 parameter sets was selected based on the lowest sum of ranks against all validation products. We found that no parameter set performs best against all validation datasets, which explains why the red lines in figure 2 lie always slightly below the best SWBM performance found against a particular validation dataset.
Figure S4 (available at stacks.iop.org/ERL/10/044012/mmedia) displays the validation results with respect to extreme conditions. The performance of both the SWBM dataset and the benchmarks is degraded compared to the overall results in figure 2; this is probably due to the reduced spread in the reduced data sample used here. However, the SWBM dataset still performs comparatively well, especially under dry conditions.
4.2. Validation of ET and runoff
The SWBM hydrological dataset also contains ET and runoff estimates, and their performance is analyzed in figure 3 (see also figures S5 and S6 available at stacks.iop.org/ERL/10/044012/mmedia). Also here we focus on the SWBM and CLM4 results using E-OBS forcing. The SWBM outperforms the benchmarks in comparison to monthly dynamics of stream-gauge measurements. We find significant dry biases in all runoff products, leading to low mean NSE values. The bias in the SWBM data is mainly found in mountainous areas, as shown in figure S5 (available at stacks.iop.org/ERL/10/044012/mmedia). It is likely due to precipitation undercatches in the forcing of the hydrological models in these regions, namely in E-OBS (SWBM, CLM4; despite the applied 10% upscaling, see section 3) and ERA-Interim (ERA-Land; although improved with data from undercatch-corrected precipitation product).
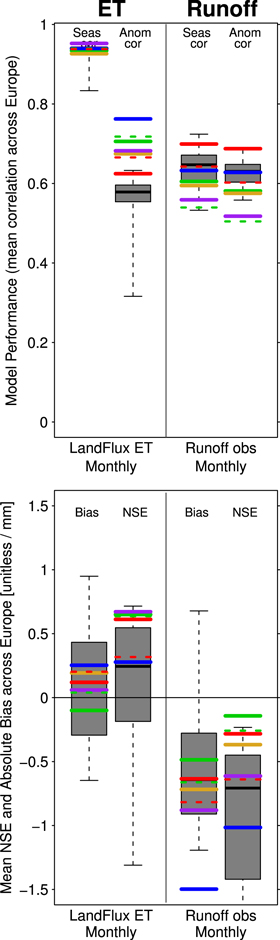
Figure 3. Similar to figure 2, but for ET and runoff performance. Results are shown for monthly data only, as daily data is not available for these datasets (table 2). The agreement of temporal dynamics is displayed on top (seasonal and anomaly correlation) and the agreement of absolute estimates is shown below (bias and NSE).
Download figure:
Standard image High-resolution imageAs there are no direct large-scale ET observations available we use the LandFlux-EVAL dataset (Mueller et al 2013) for validation here which is a composite of several ET datasets, both observation-based and model-based. The absolute biases for SWBM and the benchmarks are much lower and the NSE are clearly higher as for runoff. The seasonal correlation with the LandFlux data is very high for all, which is because net radiation as a main control of ET is used to force the models. The anomalies, however, are much better captured by the benchmarks. In the SWBM these anomalies are better captured when ERA-Interim forcing is used. The performance of SWBM(-ERA-Interim) and of CLM4 are even out of the performance range of all SWBM(-E-OBS) parameter sets. However, ERA-Interim and LandFlux-EVAL are both (partly) model-based, in contrast to E-OBS. Apart from the role of the forcing dataset these results underline that the benchmarks are based on more sophisticated and comprehensive models that include relevant processes which are omitted by the SWBM.
As for soil moisture, we repeated the validation with a focus on extreme conditions. As shown in figure S7 available at stacks.iop.org/ERL/10/044012/mmedia, the SWBM dataset outperforms the benchmarks in the case of runoff, whereas in terms of ET it has problems capturing dry conditions. We find considerable runoff biases under wet conditions in all products, pointing to low quality of extreme precipitation in the forcing data.
4.3. Sources of skill
Figures 2 and 3 also allow us to analyze the sources of skill of the SWBM dataset. We compare the influence of the parameter set and of the forcing dataset on the hydrological model performance. The impact of the parameter set is shown by the gray boxes denoting the spread of the performance of all random parameter sets. The role of the forcing dataset can be assessed from the difference of the solid and dashed horizontal lines representing the model performance using E-OBS and ERA-Interim as meteorological forcing data. The performance of the SWBM and CLM4 is mostly degraded when using ERA-Interim forcing, except for the ET dynamics. The spread of the gray boxes is mostly comparable to the performance difference associated with the meteorological forcing dataset. This is an interesting and important finding; the model parameters are hence about equally important as the forcing dataset. Only in terms of absolute ET and runoff measures, the parameter set seems to be more important than the forcing dataset.
To disentangle the impact of particular meteorological forcings on the SWBM performance we re-run all simulations with the 300 parameter sets and apply randomized forcing, i.e. we shuffled the years such that any year was replaced with a different year of the considered period 1984-2013 (colored boxes in figures S8 and S9 available at stacks.iop.org/ERL/10/044012/mmedia). The orange boxes refer to results obtained with modified temperature data, whereas precipitation and radiation are unchanged. Their extent and location is very similar to the gray boxes, suggesting limited impact of the temperature forcing on the SWBM performance. The red boxes show that randomized radiation is also of limited importance for soil moisture and runoff modelling. However, ET anomalies largely depend on the radiation forcing which makes sense given the formulation of the SWBM (equation (2)). The seasonal correlation is less impacted as seasonal cycle is largely preserved because we shuffle complete years. The blue boxes finally show that precipitation strongly impacts the temporal dynamics of soil moisture and runoff. The anomaly correlations drop almost to zero, and due to the relatively weak seasonal cycle of precipitation, the seasonal correlations also drop substantially. The dominant impact of precipitation across the meteorological forcings may also explain the difference of the CLM4 and SWBM performance when using E-OBS(/WFDEI) or ERA-Interim. E-OBS benefits from numerous rain gauge observations, whereas ERA-Interim as a reanalysis relies on modelled precipitation.
In summary, the high quality of the new SWBM hydrological dataset is therefore mostly supported by the choice of the best parameter set and the E-OBS precipitation data.
4.4. Hydroclimatic applications of the new SWBM dataset
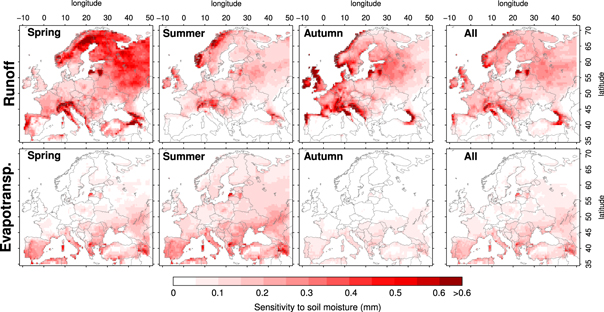
4.4.1. Sensitivity of runoff and ET to soil moisture
Soil moisture may impact runoff and ET (Koster and Milly 1997, and equations (1) and (2)), which is particularly important during extreme events such as heat waves and floods (see section 1). In this section we characterize the sensitivity of runoff and ET on soil moisture in the SWBM dataset. For this purpose we compute the derivatives of Qn and En in equations (1) and (2), respectively:


where we use the parameters of the SWBM dataset. The resulting sensitivities are expressed in mm, and they depend mainly on (i) the slopes of normalized Qn or En versus wn (equations (1) and (2)), (ii) the meteorological forcing (precipitation or net radiation), and (iii) the variability of soil moisture,  .
.
The resulting runoff and ET sensitivities are shown in figure 5. We find contrasting results for northern/central, and southern Europe. Runoff is generally more sensitive to soil moisture in northern/central Europe, and less in the south, whereas ET is most sensitive to soil moisture there. In the case of runoff this can be explained with the slope of the normalized runoff function (equation (1)), which is larger for wet soils. Especially in spring in north-eastern Europe and in mountainous areas the soil is generally wet (see also figure 1), and the precipitation (and/or) snow melt is high. The strong sensitivity of ET to soil moisture in southern Europe can be explained with the comparatively high net radiation and the stronger soil moisture variability (as also seen from the seasonal variations in figure 1).
4.4.2. Soil moisture during recent European heat waves
Many studies have investigated the role of soil moisture during heat waves. However, due to the lack of actual soil moisture measurements most of these studies used modelled soil moisture of unknown quality (e.g. Fischer et al 2007, Lorenz et al 2010) or proxy information such as the standardized precipitation index (e.g. Hirschi et al 2011, Mueller and Seneviratne 2012, Quesada et al 2012). Here we employ the derived SWBM soil moisture dataset exemplarily to investigate soil moisture anomalies during recent European heat waves.
Figure 4 compares (normalized) soil moisture and temperature anomalies during the well-known heat waves in Central Europe (August 2003) and in eastern Europe and Russia (August 2010). In the regions with the largest temperature anomalies we generally also find considerable dry soil moisture anomalies. In contrast, slightly elevated temperatures are not necessarily accompanied by dry soils. In line with previous studies, these results suggest that dry soils are a necessary (but not sufficient) condition for extreme heat waves in many regions of Europe.
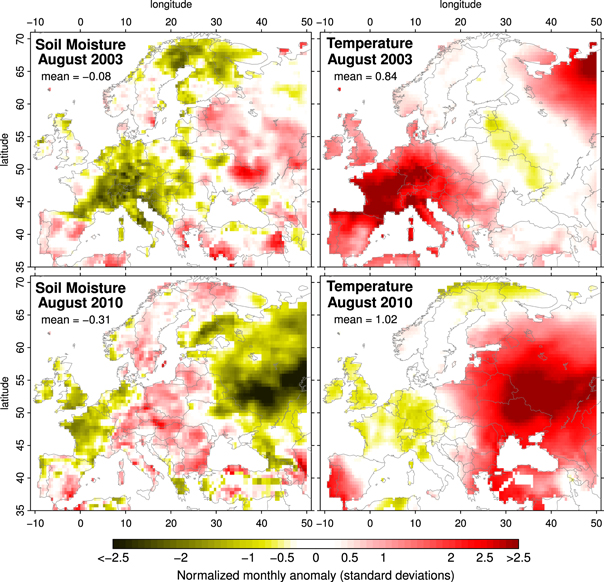
Figure 4. Soil moisture from SWBM dataset and temperature data from E-OBS during the August 2003 and August 2010 heat waves in Europe, expressed as normalized monthly anomalies.
Download figure:
Standard image High-resolution image5. Conclusions
In this study we introduced a new hydrological dataset for Europe using a SWBM. The model computes soil moisture, runoff and ET from observed precipitation, net radiation and temperature. Runoff (normalized with precipitation) and ET (normalized with net radiation) are estimated through power-law dependencies on soil moisture. To calibrate the model, we sample the entire parameter space using observation-based ranges for each parameter from Orth and Seneviratne (2014). The resulting model runs are extensively validated to select the best parameter set and hence the model run that constitutes the new SWBM hydrological dataset. The corresponding fitted runoff and ET dependencies indirectly capture soil and vegetation characteristics which enables us to omit any information on land properties. Our analysis showed moreover that there is no single perfect model calibration but many parameter sets performing similar to the best set, consistent with the concept of equifinality.
Figure 5. Sensitivity of runoff and ET to soil moisture (equations 3 and 4) in the SWBM dataset. Results displayed for all seasons (except winter), together with the mean thereof.
Download figure:
Standard image High-resolution image
The derived SWBM dataset was extensively compared against state-of-the-art datasets (ERA-Interim/Land, MERRA-Land, GLDAS-2-Noah, CLM4 simulations) using several metrics to evaluate their agreement with observation-based reference data. We showed that our SWBM dataset overall outperforms the benchmarks in terms of soil moisture on the daily and monthly time scale, using station observations, GRACE data (Swenson and Wahr 2006) and results of a locally-calibrated SWBM version (Orth and Seneviratne 2014) as references. This is a remarkable result given the conceptual character of the SWBM model and the fact that it is used with uniform parameter values across the continent. For runoff and ET we use stream-gauge measurements and LandFlux-EVAL data (Mueller et al 2013) as reference, respectively, and we perform the analysis on the monthly time scale only. In terms of runoff dynamics (i.e. changes over time) the SWBM dataset outperforms the benchmarks. However, we find a significant dry bias in mountainous areas in all three datasets. For ET, the biases in all datasets are much smaller and NSE are higher, but the performance of the SWBM dataset is weaker compared to that of the benchmarks. Whereas this might be partly due to the forcing dataset, it also indicates that the models used to derive the benchmark datasets are more comprehensive such that they capture more relevant processes. We additionally performed the validation for extreme (dry or wet) conditions and find again comparatively good performance of the SWBM dataset in terms of soil moisture and runoff, especially under dry conditions. Also its deficiencies in terms of ET are found under extreme conditions.
Moreover we investigated the sources of skill of the SWBM dataset. Comparing the influence of the parameter set with the importance of the meteorological forcing dataset (E-OBS (Haylock et al 2008) versus ERA-Interim (Dee et al 2011)) we find a similar impact on the SWBM performance. These results point out the importance of high-quality input data for hydrological modelling, besides a reasonable model calibration, as also reported by e.g. Beven 1989, Koster et al 2011 and Orth et al 2014 (for the HBV model). We also compared the role of the particular meteorological forcings, we identified that precipitation has by far the strongest impact on the SWBM soil moisture and runoff results, confirming earlier studies (e.g. Orth and Seneviratne 2014). In contrast, modelled ET is most sensitive to radiation in Europe.
The derived new SWBM dataset is useful for a wide range of applications. We exemplarily employed this dataset to show the strong dry soil moisture anomalies associated with the 2003 (central Europe) and 2010 (western Russia) heat waves. Furthermore the runoff and, despite its weaker performance, the ET dataset are useful as a complement for studies requiring consistent and comprehensive hydrological data. However, there are limitations to the SWBM dataset, even if it performs generally well against the considered benchmarks. It is based on a conceptual model with uniform parameters, which might lead to problems e.g. over complex terrain. And even though the simple nature of the model allows us to sample its entire parameter space and to infer an optimal calibration, it cannot replace more sophisticated models that (explicitly) account for the complex relationships operating in nature to produce more comprehensive results, in particular across different climate regimes and under changing climate conditions. As their calibration is a challenging task, the SWBM dataset may serve as a benchmark in the future.
Dataset distribution
The SWBM hydrological dataset derived with E-OBS forcing data can be downloaded from www.iac.ethz.ch/url/SWBM-Dataset.
Acknowledgments
We acknowledge the E-OBS dataset established by the EU-FP6 project ENSEMBLES (http://ensembles-eu.metoffice.com (accessed on 01 April 2014)) and the data providers in the ECA&D project (http://www.ecad.eu (accessed on 01 April 2014)) for sharing precipitation and temperature data and the NASA/GEWEX SRB project (http://gewex-srb.larc.nasa.gov/(accessed on 28 March 2014)) as well as the NASA CERES experiment (http://ceres.larc.nasa.gov/index.php (accessed on 01 April 2014)) for sharing radiation data. Furthermore we acknowledge the international soil moisture network (https://ismn.geo.tuwien.ac.at/ (accessed on 28 March 2014)) and the SwissSMEX network, http://www.iac.ethz.ch/groups/seneviratne/research/SwissSMEX (accessed on 01 April 2014)) for providing soil moisture measurements, Sean Swenson and the NASA MEaSUREs Program for sharing GRACE land data (http://grace.jpl.nasa.gov (accessed on 01 April 2014)), the ECMWF (Balsamo et al 2013) for sharing the soil moisture reanalysis data ERA-Interim/Land, the Goddard Earth Sciences (GES) Data and Information Services Center (DISC) for sharing the GLDAS-2-Noah and MERRA-Land data that were acquired as part of the mission of NASA's Earth Science Division, the LandFlux-EVAL ET dataset (http://www.iac.ethz.ch/groups/seneviratne/research/LandFlux-EVAL (accessed on 28 March 2014)) and European water archive in cooperation with the EU-FP6 project WATCH (http://www.eu-watch.org (accessed on 01 April 2014)) for sharing streamflow data. Moreover we thank Mathias Hauser for support with the CLM4 simulations and helpful comments on the manuscript, as well as Tom Ackerman, Laura Hinkelman and Martin Wild for helpful discussions on the radiation data. We also thank two anonymous reviewers for valuable inputs on the manuscript. We acknowledge support from the EU-FP7 EUCLEIA project, the ERC DROUGHT-HEAT project, and the EU-FP7 DROUGHT-R&SPI project.