

Abstract
The current work evaluates the effects of the 2003 Old Fire on semi-arid systems in the San Bernardino Mountains, California. Pre- and post-fire daily streamflow are used to analyze flow regimes in two burned watersheds. The average pre-fire runoff ratios in Devil Canyon and City Creek are 0.14 and 0.26, respectively, and both increase to 0.34 post-fire. Annual flow duration curves are developed for each watershed and the low flow is characterized by a 90% exceedance probability threshold. Post-fire low flow is statistically different from the pre-fire values (α = 0.05). In Devil Canyon the annual volume of pre-fire low flow increases on average from 2.6E + 02 to 3.1E + 03 m3 (1090% increase) and in City Creek the annual low flow volume increases from 2.3E + 03 to 5.0E + 03 m3 (118% increase). Predicting burn system resilience to disturbance (anthropogenic and natural) has significant implications for water sustainability and ultimately may provide an opportunity to utilize extended and increased water yield.
Export citation and abstract BibTeX RIS

Content from this work may be used under the terms of the Creative Commons Attribution 3.0 licence. Any further distribution of this work must maintain attribution to the author(s) and the title of the work, journal citation and DOI.
1. Introduction
Wildfires have the potential to dramatically alter watershed and ecosystem processes for many years (Wittenberg et al 2007, Wittenberg and Inbar 2009, Kinoshita and Hogue 2011). Traditional post-fire studies have extensively focused on initial soil transformation, vegetation loss, and sedimentation flows (Debano 2000, Pierson et al 2001, Ice et al 2004, Cerdá and Doerr 2005, Robichaud et al 2013). Other studies emphasize immediate impacts of hydrology, water quality, flooding and debris flows (Hoyt and Troxel 1934, Helvey 1980, Scott 1993, Meixner and Wohlgemuth 2003, Burke et al 2013). Stoof et al (2014) show that burned soils increased the propensity for preferential flow and contribute to increased streamflow after fire and several studies of bushfires in Australia have investigated post-fire water yield predictions (Langford 1976, Kuczera 1987). However, there has been less focus on longer-term and continuous (more than several years after the fire) trends toward baseline or pre-fire conditions, including dry season changes in Mediterranean systems. With the expectation of increased wildfire frequency, size, intensity, and duration in the Western North America (Westerling et al 2006), there is a need for understanding sustained eco-hydrologic system impacts and water management.
Semi-arid regions are noted to be especially sensitive to minor changes in physical and chemical properties, and long-lasting consequences are sometimes observed (Neary et al 1999). Kinoshita and Hogue (2011) showed two basins in Southern California that were burned by the 2003 Old Fire had elevated seasonal and annual discharge for eight years post-fire and were strongly influenced by the temporal and spatial dynamics of post-fire vegetation regrowth. Seasonal streamflow patterns did not return to pre-fire levels during the seven year study period, and dry season flow was especially impacted. Elevated flows can continue to deliver larger suspended sediment and bed loads until vegetation and evapotranspiration processes recover (Helvey 1980, Lane et al 2006, Noske et al 2010). Noske et al (2010) noted sediment transport approached pre-fire levels three to four years after a wildfire event. Hauer and Spencer (1998) also observed increased nutrient concentrations in wildfire impacted stream systems up to five years post-fire, where nutrients were readily transported during the study period.
Understanding and quantifying potential water yield from wildfire impacted basins is critical in semi-arid regions. Persistent drought and a growing population are increasing pressure on water resources and regional infrastructure (Service 2004). More than half of Southern California's water supply is based on imported water from the State Water Project and the Colorado River, which is used for domestic and agricultural consumption (California Department of Water Resources 1998). Additionally, many cities such as San Bernardino rely on local streams, reservoirs, and groundwater for their water sources (www.water-ed.org/watersources/). Increase in potential post-fire streamflow could provide opportunity to utilize excess water yield, especially if appropriate infrastructure exists.
The current study builds upon Kinoshita and Hogue (2011) and further investigates pre- and post-fire flow regimes, specifically the enhanced low flow period for two semi-arid basins in order to provide a measure of watershed response to disturbance. Study watersheds, Devil Canyon and City Creek, present a unique opportunity to evaluate long-term pre- (76 years) and post-fire (ten years) discharge to better understand watershed dynamics in primarily intermittent to perennial systems; providing new perspective for increased water availability after fire.
2. Study area
Devil Canyon and City Creek are located within the San Bernardino Mountains, CA and are considered semi-arid, with typical winter rainfall from December to March and warm and dry summer and fall seasons. During the 86 year study period, water year (WY) 1993 (1 October 1992 to 30 September 1993) is noted as the wettest year (1930 mm and 1420 mm of precipitation in Devil Canyon and City Creek, respectively) and WY 2002 is the driest year (260 mm and 170 mm in Devil Canyon and City Creek, respectively) (www.sbcounty.gov/dpw/floodcontrol/water_resources.asp). In general, Southern California's climate is categorized as Mediterranean and is noted for its moderate weather due to a semi-permanent Eastern Pacific high pressure area (www.wrh.noaa.gov/lox/climate/climate_intro.php). Summers (May through October) are typically dry but have occasional isolated thunderstorms from subtropical moisture. During the winters (November through April), the Eastern Pacific high pressure is displaced by the Northern hemisphere polar jet stream, bringing cold frontal storms. Southern California's precipitation patterns are also influenced by the El Niño/Southern Oscillation, which typically provides increased winter moisture and larger precipitation events. During the fall, this region frequently experiences North–Easterly foehn winds, the Santa Ana winds, which are hot and dry and can exacerbate fire conditions (Keeley et al 1999).
Devil Canyon is smaller and steeper (area of 14 km2; watershed slope of 15%) than City Creek (area of 51 km2; watershed slope of 10%) (table 1). The elevation in Devil Canyon ranges from 500 to 1700 m, and City Creek elevation ranges from 300 to 2100 m (USGS 7.5 min, Quadrangle Map; Silverwood Lake and San Bernardino North (Devil Canyon) and Harrison (City Creek)). The soil in Devil Canyon is gravelly loamy sand, loamy sand, coarse loamy sand, sandy loam, and clay loam, and City Creek is similar with clay loams, shallow sandy loam, soils with low organic content, and soils higher in clay content (Hromadka 1986). San Bernardino soil surveys indicate that the dominant hydrologic soil group for Devil Canyon is A (higher infiltration rates) while City Creek is D (slower infiltration rates) (supplement A). The vegetation in Devil Canyon and City Creek is predominantly chaparral and scrub (55% and 72%, respectively) with mixed conifer (29% and 20%, respectively) in the upper elevations (Homer et al 2007, table 1).
Table 1. Basin Characteristics for Devil Canyon and City Creek.
| Basin characteristics | Devil Canyon | City Creek |
|---|---|---|
| USGS discharge gage | 11 063 680 | 11 055 801 |
| USGS available record | WY 1920–current | WY 1921–current |
| SBCFCDa precip gage | 2840 | 2860 and 3377 |
| SBCFCD period of record | WY 1965–2012 | WY 1985–2012 |
| Watershed size | 14 km2 | 51 km2 |
| Watershed slopeb | 15% | 10% |
| >2000 NLCDc land cover % | Chaparral (55); | Chaparral (72); |
| Mixed forest (29) | Mixed forest (20) | |
| USFS RSACd soil burn severity in the 2003 Old Fire | High (7); Mod (73); | High (13); Mod (57); |
| Low (15); Unburned (5) | Low (17); Unburned (13) |
aSan Bernardino County Flood Control District. bWatershed slope is defined as the difference of the maximum and minimum elevations along the longest flow path divided by the distance of the longest flow path. cNational Land Cover Database 2001. dUSFS Remote Sensing Applications Center.
Devil Canyon and City Creek were 95% and 87% burned, respectively, in the 2003 Old Fire (figure 1). The soil burn severity of Devil Canyon and City Creek is based on the field validated Landsat classification and is mostly moderately burned (supplement B). Devil Canyon's soil burn severity consists of 7% high, 73% moderate, and 15% low and 5% unburned (and areas with unavailable information), while the soil burn severity of City Creek consists of 13% high, 57% moderate, and 17% low and 13% unburned (table 1). The wildfire regime in both basins is consistent with Keeley and Fotheringham (2001), who note that Southern California chaparral systems generally have a natural fire frequency of 30–40 years. The fire perimeter history of both basins are available from the 1900s, but do not include historical soil burn severity. Devil Canyon was previously burned in 1918 (24% burned), 1924 (27% burned), 1954 (92% burned), and 1980 (28% burned) (http://frap.cdf.ca.gov). City Creek was previously burned in 1922 (53% burned), 1956 (61% burned), 1970 (28% burned), and 2007 (less than 5% burned) (http://frap.cdf.ca.gov). The most notable wildfire in Devil Canyon was over 50 years ago (1954) and with the exclusion of periodic wet years, both watersheds are assumed to be hydrologically stable (the average discharge since the last recorded wildfire is within one standard deviation of the pre-fire mean) prior to the 2003 Old Fire.

Figure 1. Devil Canyon and City Creek within the 2003 Old Fire perimeter. USGS discharge and primary and secondary SBCDCD precipitation gages are noted and labeled.
Download figure:
Standard image High-resolution image3. Methods
3.1. Hydrologic data
Daily discharge is available from the US Geological Survey (USGS) for Devil Canyon and City Creek from approximately the 1920s to the present. In this study, discharge data is used to investigate pre- and post-fire hydrology at the Devil Canyon (#11063680) and City Creek (#11055801) gages for WY 1928–2013 (1 October 1927 to 30 September 2013). The rare availability of long-term (76 years) pre-fire discharge observations for both watersheds precludes the need for a regional control basin; providing the opportunity to evaluate post-fire basin behavior relative to a pre-fire baseline. Precipitation data for Devil Canyon and City Creek are provided by the San Bernardino County Flood Control District (SBCFCD). Devil Canyon's precipitation (#2840—Panorama Point) is available for WY 1965–2013 (figure 1). City Creek's precipitation (#3377—City Creek Ranger Station) is available from WY 1985 to 2000. The gage was replaced by #2860 (same location) for WY 1995–2013. The combination of #3377 and 2860 provide a continuous time series of daily precipitation for City Creek. Missing data for City Creek is estimated with two additional gages (about 8 km outside of the watershed, #5140 and 5339) with the inverse-distance weighting method. A longer running gage (#2071—San Bernardino City, South of Devil Canyon) is available from WY 1928 and is used to backfill missing data for both Devil Canyon and City Creek with a linear regression (R = 0.95). The primary gages in both watersheds are representative of the median elevation and compared to a spatially distributed, monthly precipitation data set (supplement C). Hydrologic runoff depth and precipitation are aggregated to annual values to evaluate pre- (WY 1928–2003) and post-fire (WY 2004–2013) runoff ratios (the ratio of annual depth of discharge to precipitation). The runoff ratio is a relatively simplistic tool, but is commonly used in hydrologic studies as a metric for understanding basic watershed behavior and partitioning of precipitation to surface runoff.
3.2. WY characterization
To provide an understanding of local climate variability, each WY within the study period is classified by the standardized precipitation index (SPI) (McKee et al 1993). The SPI classification is based on the SBCFCD precipitation gage #2071, which has a longer precipitation record, and determines wet, normal, and dry WYs. The SPI estimates the probability of precipitation for a specific time-scale by normalizing the data and calculating a standard deviation from the mean. A 12 month period is used to classify wet (SPI > 1), normal (−1 < SPI < 1), and dry (SPI < −1) WYs. For the study period, WY 1928–2013, the SPI identified 14 wet, 59 normal, and 13 dry WYs.
3.3. Flow duration curves (FDCs) and statistical analysis
FDCs highlight the relationship between streamflow and the percentage that streamflow is exceeded (cumulative density function), providing statistical information on annual variability. FDCs are extensively used to characterize streamflow distributions (Helvey 1980, Burt and Swank 1992, Brown et al 2005, Lane et al 2005, 2006, Shakesby and Doerr 2006). The impact of intra-annual variability observable in FDCs provides insightful measurement on pre- and post-fire flow behavior (Lane et al 2005, 2006). Annual FDCs for Devil Canyon and City Creek (WY 1928–2013) are developed for pre- and post-fire WYs, providing a measurement of watershed response to disturbance. A median curve of the pre-fire annual FDCs is estimated for WY 1928–2003. Discharge with an associated 90% exceedance probability or greater are classified as low flows and discharge with less than 10% exceedance probability are noted as high flows (Smakhtin 2001). The exceedance probability of 90% for the median discharge is used as a threshold to quantify the fire impact on low flows in Devil Canyon and City Creek. To quantify the change from pre-fire to post-fire, a two-sample Kolmogorov–Smirnov (K–S) test is used to compare the distributions of pre- and post-fire FDCs. The K–S null hypothesis is that the pre- and post-fire FDCs are from the same continuous distribution at α = 0.05 (Massey 1951) and that the K–S test statistic is the maximum vertical distance between the two curves evaluated (Cowpertwait et al 2013).
4. Results and discussion
4.1. General watershed behavior
The average annual precipitation for Devil Canyon and City Creek is 890 mm and 630 mm, respectively. The SPI analysis shows that the wettest year (WY 1993) during the study period produced about 1930 mm and 1420 mm of precipitation in Devil Canyon and City Creek; while the driest year (WY 2002) produced 260 mm and 170 mm of precipitation, respectively (figure 2). The average pre-fire annual runoff ratio (WY 1928–2003) is 0.14 (Devil Canyon) and 0.26 (City Creek) (figure 2). Devil Canyon's lower runoff ratio is likely influenced by its dominant hydrologic soil group, A, which is typically characterized by higher infiltration and lower runoff, while City Creek is predominantly hydrologic soil group D, which has a higher runoff potential. Generally, runoff ratios from both basin are variable, where larger values correspond to wetter years which have higher than average precipitation (figure 2). A series of wet years in the mid- to late-90s (1993, 1995, and 1998) almost doubled the corresponding runoff generated in both watersheds (figure 2). These wet years sustained increased annual runoff in Devil Canyon for seven years, while City Creek's runoff almost returns to average between each wet year.
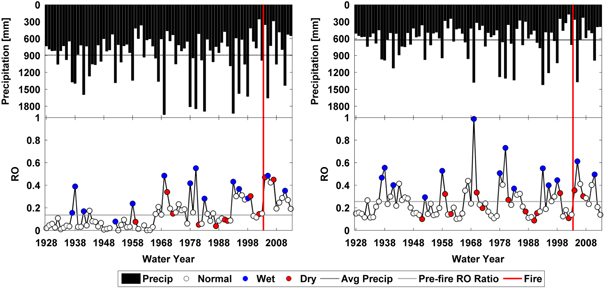
Figure 2. Annual precipitation and runoff ratios for WY 1928–2013 in Devil Canyon (left) and City Creek (right). The long-term average precipitation and RO ratio values are denoted with horizontal lines. The wet water years (WY 1937, 1938, 1941, 1952, 1958, 1969, 1978, 1980, 1983, 1993, 1995, 1998, 2005, and 2011) are highlighted with solid blue circles and normal and dry water years are denoted with white and red circles, respectively.
Download figure:
Standard image High-resolution imageFour years prior to the fire in 2003, the average runoff ratios were 0.13 and 0.14, for Devil Canyon and City Creek, respectively, which are lower than the long-term pre-fire average, foreshadowing the dry conditions for the wildfire. The average post-fire annual runoff ratio increases to 0.34 for both basins, more than doubling the observed pre-fire ratios. In Devil Canyon, all post-fire years are above the pre-fire average; while City Creek has seven post-fire years above the pre-fire average (figure 2). In Devil Canyon, the largest post-fire runoff ratio is 0.48 in WY 2005 and decreases to a minimum post-fire runoff ratio of 0.19 in WY 2013. Similarly, City Creek's largest post-fire runoff ratio is 0.61 in WY 2005 and decreases to a minimum post-fire runoff ratio of 0.14 in WY 2013.
4.2. FDCs
Devil Canyon is predominantly an ephemeral to intermittent system (figure 3(a)), indicated by the pre-fire FDCs that show zero flow for many years and annual curves that are not distributed over the entire exceedance probability (from 0 to 100). Generally, pre-fire annual high flows (flow at 10% exceedance probability) have less variability between the observed values than the low flows (flow at 90% exceedance probability). The spread between the lower annual distribution and higher annual distribution curves are influenced by climate. Several wet year curves are below the pre-fire median, demonstrating the capacity for high infiltration common in type A hydrologic soils within Devil Canyon. The wet year FDCs are statistically different from the pre-fire median (α = 0.05), where the K–S statistic indicates an average of 14% wider distribution in Devil Canyon. The discharge at 90% exceedance for the pre-fire median is 0.0028 m3 s−1 (black square; figure 3(a)). All post-fire discharge distribution curves are above the pre-fire median and the post-fire average discharge at 90% exceedance is 0.028 m3 s−1 (white square; figure 3(a)). The pre-fire and post-fire 10% exceedance (high flow) is similar (∼0.24 m3 s−1). However, the maximum spread (K–S statistic) between the pre-fire median and successive post-fire years is increased on average by 96%.
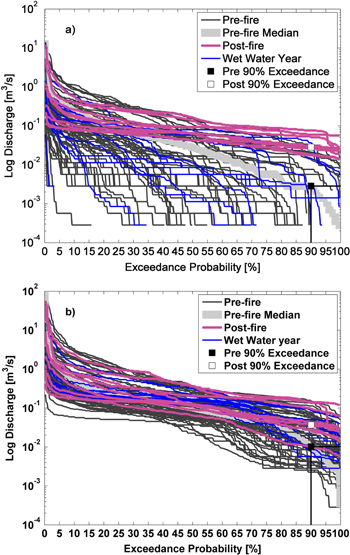
Figure 3. Annual cumulative discharge distribution curves for WY 1928–2013 in Devil Canyon (a) and City Creek (b). Pre-fire discharge is dark gray with a thicker light gray line to represent the pre-fire median. The post-fire curves are pink and pre-fire wet years are denoted with blue. The pre-fire 90% exceedance threshold is marked by a black square and a vertical and horizontal black line distinguishes the low flows. The white square indicates post-fire 90% exceedance.
Download figure:
Standard image High-resolution imageGenerally, the pre-fire FDCs for City Creek are fully distributed over the exceedance probability because it is a perennial system (figure 3(b)). Similar to Devil Canyon, pre-fire annual high flows (flow identified at 10% exceedance probability) have less variability between the observed values than the low flows (flow identified at 90% exceedance probability) and curve distribution is heavily influenced by annual weather. However, the spread between the lower annual distribution and higher annual distribution curves is less than that of Devil Canyon, which demonstrates that City Creek is a perennial system. The discharge at 90% exceedance for the pre-fire median is 0.01 m3 s−1 (black square; figure 3(b)). Only two wet years are completely below the pre-fire median, while the rest are above the median and have a higher annual discharge distribution. The wet year FDCs are statistically different from the pre-fire median (α = 0.05), where the K–S statistic indicates an average of 48% higher discharge distribution in City Creek. All post-fire discharge distribution curves are above the pre-fire median and the average discharge at 90% exceedance is increased to 0.037 m3 s−1 (white square; figure 3(b)). The pre-fire 10% exceedance (high flow) is 0.65 m3 s−1 and increases to 0.76 m3 s−1 post-fire. The maximum spread (K–S statistic) between the pre-fire median and successive post-fire years is increased on average by 16%.
Our results are similar to Lane et al (2006), who note a uniform upward shift in the first two post-fire annual FDCs. Significant change in runoff generation behavior is observed for nearly ten years after the wildfire, presumably driven by reduced transpiration. During the post-fire period, climate has a marginal role in elevated discharge. Six of the ten post-fire WYs have average precipitation patterns, whereas WY 2005 and 2011 are perceived as wet and WY 2004 and 2007 are dry. It is important to note that in both Devil Canyon and City Creek, there is minimal change from pre- to post-fire high flows. This remains consistent with Pierson et al (2001), who observe that hydrophobicity, which contributes to large post-fire peak flows and flooding, generally does not persist after the first post-fire season.
4.3. Annual basin hydrology
Both annual high and low flow patterns are affected by fire history and precipitation. The low flows prior to the 2003 fire are stable and equal to, or close to, zero unless there is a period of multiple years with large precipitation (i.e. WY 1978–1980 and 1993–1998). Both Devil Canyon and City Creek are responsive to large precipitation events during the wet years (figures 2 and 4). Pre-fire high flows are noticeably more variable than the low flows in Devil Canyon (figures 4(b) and (c)) than in City Creek (figures 4(e) and (f)). Devil Canyon appears more sensitive to large precipitation events and flows intermittently during the pre-fire period (figure 4(c)). This is especially apparent in the early 1970s (figure 4(c)). In WY 1937, 1938, and 1941, high flows in both watersheds show response to large precipitation and City Creek's low flow are noticeably elevated (figures 4(b), (e), and (f)). Prior to 2003, Devil Canyon had two wildfires; however neither fire appeared to impact lows flows; which may be attributed to the errors and overgeneralization of historical wildfire perimeters (before the availability of satellite imagery), lower soil burn severity and different spatial patterns. Previously in City Creek, the two wildfires do show a similar post-fire trend of increased flow; however the duration is not as long, based on the extent of the wildfire size (figures 4(e) and (f)).

Figure 4. Annual precipitation, fire history, high, and low flow runoff for WY 1928–2013 for Devil Canyon (a)–(c) and City Creek (d)–(f). Wet years are highlighted with blue circles. The size of wildfires within the both basins are indicated upright bars that correspond to the right y-axis.
Download figure:
Standard image High-resolution image
The average pre-fire high flow yields are about 1.4E + 04 m3 (12 acre-feet (ac-ft)) and 5.4E + 04 m3 (44 ac-ft) per year for Devil Canyon and City Creek, respectively. Post-fire, the annual average high flows increase to 1.7E + 04 and 5.9E + 04 m3 (14 and 48 ac-ft), respectively and are not statistically different from pre-fire (α = 0.05). However, the pre- and post-fire low flows are statistically different (α = 0.05), where annual pre-fire low flow yields are 2.6E + 02 m3 (0.2 ac-ft) in Devil Canyon and 2.3E + 03 m3 (1.8 ac-ft) in City Creek and increase after the wildfire to 3.1E + 03 m3 (2.5 ac-ft) in Devil Canyon and 5.0E + 03 m3 (4.1 ac-ft) in City Creek. In Devil Canyon all low season runoff is larger than the pre-fire average. In Devil Canyon, every post-fire year is greater than 2.6E + 02 m3 and seven years are above 2.3E + 03 m3 in City Creek. Vegetation loss reduces basin transpiration, but increases soil moisture and streamflow, resulting in the observed elevated baseflows during the dry season (i.e. Bosch and Hewlett 1982, Turner 1991).
5. Conclusions
Previous studies have documented increased discharge and sediment immediately following wildfires (i.e. Hoyt and Troxel 1934, Meixner and Wohlgemuth 2003, Noske et al 2010, Kinoshita and Hogue 2011), but few have quantified water yield changes at the seasonal and annual scales in ephemeral and intermittent stream systems with extended pre-fire and post-fire observations. Study results show post-fire dry season discharge is statistically different (α = 0.05) from pre-fire conditions and that there is elevated discharge during low flow seasons up ten years after fire. The Devil Canyon stream is changed from ephemeral to perennial for ten post-fire years. The loss of vegetation and decreased transpiration provide more available soil moisture and contribute to increased baseflow throughout the entire WY. The post-fire FDCs in City Creek are above the pre-fire average and also show significantly more discharge during the dry season. Both systems are affected for nearly ten years with an average of 1090% and 118% increase in low flow discharge in Devil Canyon and City Creek, respectively.
Although human life and assets are a primary concern during wildfire events, there are social and scientific challenges for the management of fire-prone regions (Gill and Stephens 2009). As climate continues to change, fire events are likely to increase (Westerling et al 2006) and may provide a strategically advantageous tradeoff for water supply in semi-arid regions such as Southern California. The immediate response of increased flooding and sediment loads have encouraged land and water resource managers to develop ways to minimize the impacts of fire through forest management, however, these consequences generally do not persist more than three to five years post-fire (Noske et al 2010). Results from the current study highlight the need for a holistic and longer-term approach to managing fire landscapes, including acknowledging negative (i.e. habitat loss, sediment fluxes, flooding) and positive aspects (i.e. enhanced dry season runoff). The sustained increase in water yield from large, catastrophic fires has the potential to alter riparian-ecosystem dynamics, but may also provide a unique opportunity to supplement regional water supply used for urban populations and agriculture communities.
Acknowledgments
Streamflow data were primarily provided by the USGS National Water Information System and precipitation by the San Bernardino County Flood Control District. This work was partially supported by a National Science Foundation (NSF) Hydrologic Sciences CAREER grant (#EAR0846662) and a NSF Water Sustainability and Climate grant (#EAR12040235). We thank the 2013–2014 Hogue Fire Team members Jackie Randell and Paul Micheletty for their contributions. We also thank our anonymous reviewers for their comments and suggestions that have strengthened our manuscript.