


Abstract
Electrical transports in iron-pnictide Ba(Fe1−xCox)2As2 (BFCA) single crystals are heavily debated in terms of the hidden Fermi-liquid (HFL) and holographic theories. Both HFL and holographic theories provide consistent physic pictures and propose a universal expression of resistivity to describe the crossover of transports from the non-Fermi-liquid (FL) to FL behavior in these so-called 'strange metal' systems. The deduced spin exchange energy J and model-dependent energy scale W in BFCA are almost the same, or are of the same order of several hundred Kelvin for over-doped BFCA, which is in agreement with the HFL theory. Moreover, a drawn line of W/3.5 for BFCA in the higher-doping region up to the right demonstrates the crossover from non-FL-like behavior to FL-like behavior at high doping, and shows a new phase diagram of BFCA. The electronic correlation strength in superconductors has been newly probed by the normal-state Hall angle, which found that, for the first time, correlation strength can be characterized by the ratios of Tc to the Fermi temperature TF, J/TF, and the transverse mass to longitudinal mass.
Export citation and abstract BibTeX RIS

Original content from this work may be used under the terms of the Creative Commons Attribution 3.0 licence. Any further distribution of this work must maintain attribution to the author(s) and the title of the work, journal citation and DOI.
1. Introduction
The 'strange-metal' transports in high-temperature superconducting (HTS) cuprates, as well as in new iron-based superconductors, have been the subject of intense study. In particular, the amazing similarity between the quantum-mechanical phase diagrams of cuprates and iron-based superconductors reveals that both of their superconductivities are ascribed to the quantum critical fluctuations associated with a quantum critical point (QCP), even though HTS cuprates are doped Mott insulators, while iron-based superconductors are metallic systems [1, 2]. Within the quantum-mechanical phase transition, the singular QCP at absolute zero produces a wide region of unusual behavior at a finite temperature, which displays a striking deviation from the conventional Fermi-liquid (FL) behavior, as it has the so-called strange-metal transport properties [3]. Understanding this QCP is essential, as it corresponds to the occurrence of superconductivity in the vicinity of spin-density-wave (SDW) instability or antiferromagnetic fluctuation [1, 4]. Recently, a number of experiments on iron-based superconductors showed a phase transition involving the onset of a SDW order in the normal state above Tc, which extrapolates to a T = 0 SDW QCP (see [5] and the references therein). For example, the SDW transition was observed in both the resistivity and susceptibility of BaFe2−xCoxAs2 single crystals in the underdoped region [6]. A more recent study on electronic specific heat in BaFe2−xNixAs2 indicates that the effect of spin fluctuation should not be ignored [7]. It even has been proposed that, SDW QCP is a central organizing principle of organic, iron-pnictide, heavy-fermion, and HTS cuprates [8–10]. Under QCP (i.e. optimum doping), the strongest magnetic spin fluctuation suppresses the SDW order, accompanies the appearance of the highest Tc, and results in non-FL-like scattering associated with Fermi-surface reconstruction. Electrical resistivity measurements reveal a remarkably T-linear behavior for samples near the optimum doping, while a T2-dependent feature can be observed in the higher-doping region [11].
In the phase diagram, a line is usually drawn up and to the right from the edge of the superconducting dome in the higher-doping region in order to separate the non-FL (NFL) 'strange metal' from a conventional Fermi liquid (FL) at high doping [12]. In addition to dc resistivity, measurements of optical conductivity show a T-linear scattering characteristic for samples near the optimum doping, which can be ascribed to a two-dimensional (2D) metal at the onset of the SDW order [13, 14]. Particularly, recent studies of infrared spectra, interplane resistivity, and transport coefficients on iron-based superconductors reveal a possible pseudogap in the phase diagrams, which are similar to those observed in HTS cuprates [15–17]. These phenomena remain a major open question in the physics of strongly correlated electrons.
Recently, the hidden FL (HFL) theory [18, 19] and holographic models [20] have been respectively developed to express the transport and spectroscopic properties of over-doped HTS cuprates for the entire normal state. Based on theoretical studies, it is argued that there is no clear transition line to a true FL for higher doping in the phase diagram. Self-consistency of HFL has been shown in the transport and spectroscopic properties of Tl2Ba2CuOy and La2−xSrxCuO4 systems [18, 19]; however, the availabilities of HFL and holography have never been examined in iron-based superconductors. Theoretical works have been further developed and cast into the framework of strongly correlated FLs or quantum critical systems [20, 21]. Recent optical studies on BaFe2−xNixAs2 and Ba0.6K0.4Fe2As2 single crystals further show the interesting hidden-T-dependent properties of the two Drude models, and have proposed the hidden NFL behavior in the underdoped samples [2, 13]. In particular, the boundary from NFL T dependence to FL T2 dependence, as observed in resistivity measurements, is not clear for iron-based pnictides [22, 23]; whereas, the boundary can be obtained by the departure of resistivity from linearity for over-doped cuprates [24].
This article debates and discusses the resistivities and Hall angles of Ba(Fe1−xCox)As2 (BFCA) single crystals in terms of the existing theories. It is found herein that the deduced bandwidth of the spin excitation (the spin exchange energy J) from the Hall angle is in agreement with bandwidth W, as determined from resistivity by considering the HFL theory. An additional phase boundary line corresponding to the crossover from NFL-like transport to FL-like transport can be obtained in the new phase diagram of BFCA. Furthermore, the spin exchange energies for some conventional and unconventional superconductors, as derived from Hall measurements, are developed to explore their electronic correlation strength. The ratios of the spin exchange energy to Fermi temperature TF, J/TF, as well as the transverse mass to longitudinal mass, are presented for the first time in order to characterize the electronic correlation strength in superconductors.
2. Theoretical surveys
Previous theoretical attempts to explain the crossover from NFL to FL in the transport properties of HTS cuprates are based on the assumption that, transport lifetime, τtr, must include two different scattering lifetimes, which independently influence the temperature dependence of longitudinal resistivity ρxx. In the HFL theory, resistivity is explained in terms of the bottleneck effect, where there are two different dissipative processes for accelerated electrons, umklapp scattering and quasiparticle decaying into one pseudoparticle. These two processes act in series to dissipate the momentum to the lattice [18]. However, in holographic models [20], the electrical transport is described by two contributions to conductivity, a charge-conjugation symmetric term and another from explicit charge density relaxed by some momentum dissipation. Although arising from completely different models, both theories provide a consistent picture, which consider the T2-dependent relaxation rate and linear-T decay process in pseudoparticle conductivity, in order to achieve a universal expression of resistivity:

where A is a temperature-independent pre-factor, W is a model-dependent energy scale, and ρ0 is the residual resistivity. For T ≫ W, one can see that ρxx ≈ AT + ρ0; while ρxx ≈ ΛT2 + ρ0 with Λ = A/W for T ≪ W. In the HFL theory, pre-factor A corresponds to  and Λ is equal to
  where vF0 is the maximum Fermi velocity, EF is the Fermi energy in unit of temperature, and W corresponds to the bandwidth of the spin excitations for 2D resistivity [18]. Let us now look at the W value in detail from the new light of the holographic theory, where W can be represented by W = A/Λ. Ito et al [25] considered that
  with scattering rate ħτ−1 = λT, the Drude spectral weight is
  ≈ neff/m*( neff and m*, which are effective carrier density and effective mass, respectively), and λ (≈ 0.3) is the coupling strength between the charge carriers and spin excitations in the HTS cuprates. Considering m* = (ħ2/EF)πneff for a 2D system, the pre-factor A in T-linear resistivity can be estimated to be
  which is similar to that presented in the HFL theory. On the other hand, the electron–electron scattering processes are given by ħ/τe−e = A*T2/EF, where A* is a dimensionless constant with A* ≈ 4 for BFCA [1], resulting in electron–electron-scattering resistivity ρe−e, where
  πA*T2, and Λ =
  πA*. Thus we have W = A/Λ = (4π/A*)EFλ, indicating that W is related to the Fermi energy and coupling strength when the holographic theory is considered. Although model-dependent energy scale W represents different meanings in the physics of the HFL and holography theories, in both theories it characterizes the crossover from NFL to FL, and can reflect the electrical coupling strength in the normal-state transports of superconducting systems, as seen later in the discussions of temperature-dependent resistivity and Hall angle.
Anderson and Casey [18] fitted equation (1) to the resistivity data of La2−xSrxCuO4, with x ranging from underdoping of x = 0.15 to overdoping of x = 0.33; and obtained the doping-dependent W, which is in the order of a few hundred kelvins and in agreement with those determined from Hall and angle-resolved photoemission spectroscopy analysis. A similar result of overdoped HTS Tl2Ba2CuO6+δ with W = 800 K was obtained by Casey and Anderson [19].
Theoretical attempts on explaining the anomalous transport properties of HTS cuprates, where resistivity and the Hall effect have different temperature dependencies, are based on the assumption that there exists two transport relaxation times, which independently influence the Hall effect and resistivity in these systems. An important advance in explaining this anomalous behavior in the cuprates was Anderson's conjecture that there exist two transport relaxation times in the cuprates that independently influence the Hall effect and resistivity in these systems [26]. As suggested by the HFL theory, the T2-dependent HFL relaxation rate is taken equally as the Hall scattering rate by ħ(τHFL)−1 = T2/W = ħ(τH)−1. According to Anderson's theory [26], the transverse (Hall) scattering rate is determined by scattering between excitations and varies with T2. The scattering from magnetically active impurities introduces additional terms in the longitudinal transport scattering rate, 1/τtr, and the Hall relaxation rate, 1/τH. For the transverse scattering rate, Anderson's theory introduced:

where J is the spin exchange energy, and 1/τM is the impurity contribution. For the Fermi surface formed by spinons, the transport scattering rate of 1/τtr is proportional to the resistivity, i.e., σxx, which is proportional to τtr; whereas, σxy is proportional to τHτtr. Thus, the Hall angle θH = tan−1(σxy/σxx) involves 1/τH only. Equation (2) implies that:

where ωc = eB/ms, ms is the effective transverse mass, and C is the impurity contribution. By combining equations (2) and (3), we can see that α corresponds to 1/(ħJωc) ∝ B−1 and C = 1/(τMωc), respectively. From equations (2) and 1/τHFL = 1/τH, as suggested by the HFL theory, we should have W ≈ J if the impurity contribution can be neglected. Following Anderson's theory, we write θH = ωcτH = (B/2nΦ0)kFvkτH, as described by Chien et al [27], where Φ0 = h/2e is the flux quantum, n = kF2/2π is the planar carrier density, kF is the Fermi wave vector, and vk = J/ħkF. Using equation (3), we now derive a correlation between parameter α and spin exchange energy as:

and we have the effective transverse mass, which can be expressed by ms = ħkF/vk = (ħkF)2/J. By considering Fermi temperature TF = (ħkF)2/2mtr, where mtr is the longitudinal transport mass, we find that the ratio of transverse mass to longitudinal mass, β, can be expressed by:

Equation (5) implies that the transverse mass should be much larger than the longitudinal mass, since TF ≫ J [26, 27]. Apparently, the normal-state Hall measurement provides further insight into the strange-metal transports in superconductors.
In the holographic theory, it is argued that there is only a single contribution from the momentum dissipation to the Hall angle with θH = (B/Q)σdiss, where Q is the charge density and σdiss is the T−2-dependent dissipation conductivity. Considering that  = ρe−e = ΛT2 with Λ =
  as previously presented, we obtain α = QΛ/B =
  according to equation (3). Taking Q = ne into account, we can thus denote the measurable parameter α within the holographic theory as

Let us now return to inspect the meaning of parameter α in the HFL theory. According to equation (4), as derived within the framework of the HFL theory, the parameter α can be rewritten as

Comparing the results shown in equations (6) and (7), one can see that both derived αholo and αHFL exhibit similar formulas, and thus should have the same order of magnitude, since EF and J are the same order of magnitude for strongly correlated systems (see later in the discussion). It is noted that EF is equal to TF when EF is denoted as a temperature unit, and thus, EF > J, as previously mentioned. Both the HFL theory and holographic model propose similar physics, which lie at the origins of the two-lifetime behavior in these so-called 'strange metal' systems. More recently, it has been demonstrated that the separation of transport lifetimes seems to be pervasive in 2D electron liquids [28]. As described in some review articles [10, 29], there are other theoretical approaches that have been proposed for the anomalous transport phenomena in HTS cuprates However, only the mentioned theoretical schemes propose the universal expression of resistivity to describe the crossover of transports from NFL to FL behavior.
To sum up, by measuring longitudinal resistivity ρxx(T) and Hall angle θH(T), the obtained energy scales W and J are proposed to describe the crossover of transport from NFL-like behavior to FL-like behavior, as well as the electronic correlation strength for these strange-metal systems [18–20]. Although the mechanisms of resistivity are different, both the HFL and holographic theories provide consistent pictures that there exist two transport relaxation times, which independently influence the Hall effect and resistivity in these systems. Based on the schemes within the framework of the HFL and holographic theories, longitudinal resistivity ρxx(T) and Hall angle θH(T) for BFCA single crystals, as well as some conventional and unconventional superconductors, are examined, as follows.
3. Experiment
Previous works have described the preparations and transport measurements of investigated samples of BFCA single crystals, single-crystal NaFe1−xCoxAs (NFCA) with x = 0.022, and the charge-density-wave (CDW) related superconductors of Ca3Ir4Sn13 (CaIrSn) and Sr3Rh4Sn13 (SrRhSn) crystals [30–32]. HTS c-axis oriented YBa2Cu3Oy (YBCO) and NdBa2Cu3Oy (NBCO) thin films are grown by radio frequency sputtering onto SrTiO3 (001) substrates, as described in literature [33]. FeSe0.5Te0.5 (FeSeTe) single crystals have been grown from self-flux in a quartz crucible by referring to the conditions proposed by Sales et al [34], exhibiting good crystallization with the c-axis orientation perpendicular to the plane of the crystal slabs. In addition, a piece of Nb metal with purity of 99.9%, which is regarded as a conventional superconductor, has been studied for comparison. Within the transport measurements, a Hall-measurement geometry with five leads is constructed to allow simultaneous measurements of both longitudinal (ρxx) and transverse (Hall) resistivities (ρxy) using standard dc techniques.
4. Results and discussion
Figure 1(a) shows the temperature dependence of resistivity for BFCA single crystals with doping levels of x = 0, 0.05, 0.08, 0.10, and 0.20. The inset of figure 1(a) shows the low-temperature resistivity for the corresponding samples. As shown, the values of resistivity, transition temperatures, and temperature-dependent behaviors are similar to those reported in [35]. In addition, the undoped parent sample shows a very sharp drop in resistivity at the antiferromagnetic transition temperature of 135 K, which accompanies an additional knee-like transition at 25 K, as seen in the inset of figure 1(a). The additional transition at low temperature is similar to that observed by Rotundu et al [36], and seems to be dependent on the annealing periods, which is a phenomenon that has never been examined, and thus, has room for further investigation.

Figure 1. (a) Temperature dependence of resistivity for BFCA single crystals with doping levels of x = 0, 0.05, 0.08, 0.10, and 0.20. The solid lines represent the results deduced from the fit of equation (1). (b) Resistivities of the over-doped BFCA with x = 0.2 follow the form ρxx = ρ0 + ΛT2 with fields of 0 and 6 T parallel to the current I (the solid line). The inset shows the field dependences of the Λ value and the residual resistivity ρ0.
Download figure:
Standard image High-resolution imageFigure 1(b) shows that the resistivities of the over-doped BFCA with x = 0.2 follow the form of ρxx = ρ0 + ΛT2 with fields of 0 and 6 T at whole temperatures. Here, the applied field is parallel to the current I in order to eliminate the Lorentz contribution from resistivities. The inset of figure 1(b) shows the field dependences of the Λ value and residual resistivity ρ0. As seen, both Λ and ρ0 are almost field-independent, and the resistivities in fields reveal tiny magnetoresistance. Indeed, the T2 dependence of ρxx and the weak field independence of Λ demonstrate FL-like characteristics in the high-doping BFCA.
Using equation (1), this study attempts to analyze the normal-state BFCA resistivity, as shown in figure 1(a). Equation (1) is fitted to data through the least squares regression method in order to precisely determine parameters A, W, and ρ0. In addition, figure 1(a) shows the fitting results (solid lines) for BFCA with different doping levels. Figures 2(a) and (b) show the values of the parameters in equation (1), as obtained from the fit as a function of Co doping x. As shown in figure 2(a), the x dependency of energy scale (in temperature unit) W reveals a rapid increase in the over-doping region, which is similar to that observed on La2−xSrxCuO4 [18]. The values of W for BFCA, which are in the range of 87–1493 K, are approximately the same order of magnitude as those for La2−xSrxCuO4 and other HTS cuprates [19]. Figure 2(b) illustrates the x dependences of parameters A and ρ0. In substance, the values of parameters A and ρ0 decrease with an increase in x, which is also a behavior similar to that obtained for La2−xSrxCuO4. Closer examination of equation (1) shows that, the rapid increase in W for the higher-doping BFCA indeed agrees with the T2-like resistivity commonly observed both in HTS cuprates and iron-based superconductors, as previously mentioned.

Figure 2. Values of parameters (a) W and (b) A and ρ0 obtained from the fit of equation (1) as a function of Co doping. In addition, (a) shows the x-dependent spin exchange energy J estimated with equation (4).
Download figure:
Standard image High-resolution imageFigure 3(a) plots −cotθH, as defined by cotθH = ρxx/ρxy, versus T2 for BFCA with x = 0.20 in various applied fields up to 6 T. As can be seen, the data fall almost in a straight line in the studied temperature range, and can be fitted to equation (3). The inset of figure 3(a) shows parameter α against H−1, and demonstrates that α is indeed proportional to H−1 at fields larger than 2 T, which is consistent with the predicted previously result. The deviation of α ∝ H−1 at low fields implies the occurrence of field-dependent parameters J or ms at low fields; however, this phenomenon remains to be further debated.

Figure 3. (a) Plots of −cotθH versus T2 for BFCA with x = 0.20 in various applied fields up to 6 T. The solid lines denote the results of the fit to equation (3). (b) Plots of −cotH versus T2 for BFCA with different doping levels measured in the field of 6 T. The solid lines represent the fit of equation (3) in the normal-state temperature region. The inset of (a) shows the parameter α against H−1. The dashed line shows that α ∝ H−1 at fields larger than 2 T. The inset of (b) shows the x dependence of parameter α obtained in the field of 6 T.
Download figure:
Standard image High-resolution imageFigure 3(b) plots −cotθH versus T2 for BFCA with different doping levels measured in the field of 6 T. As can be seen, the data also fall in a straight line in the normal-state temperature region, and can be fitted to equation (3). The inset of figure 3(b) shows the x dependence of parameter α obtained in the field of 6 T. The values of α for BFCA decrease with an increase in x, and are approximately the same order of magnitude as those for HTS cuprates [27]. Furthermore, with equation (4), we can estimate the values of J for BFCA samples, as shown in figure 2(a), where the planar carrier density is calculated by n = (3π2n3D)2/3/2π and the volume carrier density n3D is obtained from the Hall measurement. From figure 2(a), we note that, the error bar of the J value rises from the n3D values taken at different temperature regions. It is found that the values of J are almost the same as the W values for BFCA with x = 0 and 0.20; and while the J values are larger than those of W, they are of the same order of several hundred Kelvin for BFCA with x = 0.10, which is in agreement with the HFL theory. This result indicates that the transports in over-doped BFCA and in their parent compound (x = 0) can be described by the HFL scenario.
Next, this study attempts to extend this observation into a new phase diagram for BFCA. According to the HFL or holographic resistivity in equation (1), one can see that the resistivity behaves as ρxx ∝ T or ρxx ∝ T2, and according to whether T ≫ W or T ≪ W. First consider the attempt to draw a line up and to the right from QCP (i.e. the optimum-doped point) and the result of W ≈ 3.5Tc (W ≈ 87.4 K, and Tc ≈ 25 K) for the optimum-doped BFCA with x = 0.08, which should behave like a NFL character at temperatures above Tc. We thus draw a line of W/3.5 for BFCA in the higher-doping region up and to the right from QCP in order to show the crossover from NFL-like behavior to FL-like behavior at high doping, as seen in figure 4. In addition, surprisingly, the W/3.5 line almost merges into the boundary line of the antiferromagnetic (AFM) transition for the under-doped BFCA. Figure 4 also illustrates the phase-transition diagram extracted from previous reports [23, 35] for comparison, and reveals a renewed phase diagram for BFCA.

Figure 4. Renewed phase diagram for BFCA, as extracted from this work and previous reports, for comparison. A line of W/3.5 for BFCA, as drawn in the higher-doping region up and to the right from QCP, shows the crossover from NFL-like behavior to FL-like behavior. Some data are extracted from previous reports for comparison.
Download figure:
Standard image High-resolution imageYoshizawa et al [37] recently investigated the elastic properties of BFCA single crystals with different Co concentrations, in which elastic constant C66 shows large elastic softening associated with the structural phase transition. They obtained characteristic temperature T* with the deviation of the inverse of C66 from the T-linear behavior, and inferred that T* possibly corresponds to the crossover from the NFL region to the FL region. Figure 4 also illustrates the duplicated T* values for comparison, and shows an approximate coincidence between the W/3.5 boundary line and T* values. In addition, the derived values of bandwidth W, by Yoshizawa et al present the same order of several hundred Kelvin for higher-doped BFCA as those obtained herein with the HFL and holographic transport theories. Furthermore, the factor of 3.5 indicates that the crossover temperature corresponds to a fractional value of bandwidth.
Further discussion of the exchange energy J in superconductors via equations (4) and (5) suggests that the exchange energy can seemingly manipulate the transport behaviors in superconductors. An interesting issue is to examine the spin exchange energy in different kinds of superconductors in order to debate their electronic correlation. Figure 5(a) illustrates the basic characteristics of resistive transition for some high-quality superconductors, including the optimum-doped BFCA, NFCA, and FeSeTe crystals, fully oxygenized YBCO and NBCO films, and the CDW-related superconducting CaIrSn and SrRhSn crystals, as described in the Experiment section, and a conventional superconductor of Nb metal. As seen, the measured superconducting transition temperatures are almost the same as those previously reported.

Figure 5. (a) Basic characteristics of resistive transition for some high-quality superconductors as mentioned in the text. (b) Plots of ∣cotθH∣ versus T2 for the corresponding samples measured in the field of 6 T. The solid lines represent the fit of equation (3) in the normal-state temperature region. The inset of (b) shows J versus Tc for the corresponding samples.
Download figure:
Standard image High-resolution imageFigure 5(b) plots ∣cotθH∣ versus T2 for the corresponding samples measured in the field of 6 T. As can be seen, the data also fall in a straight line in the normal-state temperature region, and can be fitted to equation (3). As mentioned above, the exchange energy offers the key to understanding the electric correlation in superconductivity. Following the analysis previously conducted in BFCA, we can derive the exchange energy according to the data in figure 5(b) by using equation (4). The inset of figure 5(b) shows J versus Tc for the corresponding samples in figure 5(b); however, there is no clear relation between J and Tc. Recently, it has been pointed out that, the ratio of Tc to Fermi temperature TF characterizes the correlation strength in superconductors [38]. In unconventional superconductors, such as iron-based superconducting FeTe0.6Se0.4, HTS YBCO, and heavy fermion superconductors, this ratio is about 0.1; however, it is only ∼0.02 in conventional BCS superconductors [38]. Being analogous to the analysis of Tc/TF, we are motivated to examine the ratio of J/TF in different kinds of superconductors.
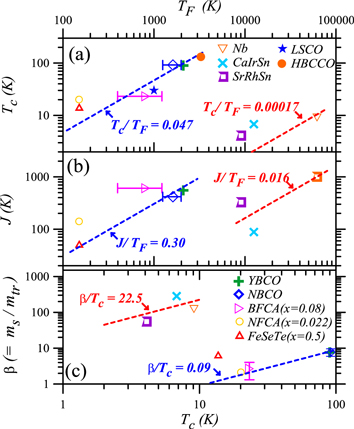
Figure 6(a) shows Tc as a function of Fermi temperature TF for the superconductors studied herein. The Fermi temperature TF can be extracted from [39]:
where S is the Seebeck coefficient, γ is a T-linear electronic specific heat coefficient, kB is Boltzmann's constant, and e is the electron charge. This study adopts the results of thermal transport for NBCO [40, 41], BFCA [42, 43], NFCA [44], SrRhSn [45], and Nb [46] to make the estimations of TF, while the TF values of YBCO, FeSeTe, and CaIrSn are duplicated from articles in literature [38, 47, 48].
Figure 6. (a) Tc and (b) J versus Fermi temperature TF for the superconductors studied. (c) β, as expressed in equation (5), as a function of Tc for the superconductors studied. The dashed lines represent the parameter ratios for strongly correlated and weakly correlated superconductors as indicated.
Download figure:
Standard image High-resolution image
However, as shown in figure 6(a), the error bars of TF arise from the various n3D values, as taken at normal-state temperatures, and some divergences in the values of S and γ reported. The data for HgBa2Ca2Cu3O8+δ (HBCCO) and La1.85Sr0.15CuO4 (LSCO) are adopted from [48] for comparison. Figure 6(a) shows the dash lines of Tc/TF = 0.047 and 0.000 17 for two groups of superconductors, respectively. The data of the first group of superconductors, including the strongly correlated HTS YBCO and NBCO, and iron-based superconducting BFCA, NFCA, and FeSeTe, follow the line of Tc/TF = 0.047, while the data of the second group of superconductors, including weakly correlated CaIrSn, SrRhSn, and Nb, are distributed over the region near the line of Tc/TF = 0.000 17. This result is in accordance with previously reported results [38, 47, 48].
Inspired by the plot in figure 6(a), in figure 6(b) we demonstrate a plot to point out an intimate link between J and TF in a superconducting system. An interesting result is that the data of the strongly correlated superconductors (first group) follow the line of J/TF = 0.30, while the data of the weakly correlated superconductors (second group) follow the line of J/TF = 0.016. This finding indicates that the ratio of J to the Fermi temperature TF can also characterize the correlation strength in superconductors. It is inferred that, for a strongly correlated superconductor, this ratio is much larger than that for a conventional BCS superconductor due to their smaller TF values.
This study further examines the ratio of transverse mass to longitudinal mass, β, as expressed in equation (5). Figure 6(c) illustrates β as a function of Tc for the superconductors studied herein, which shows that the strongly correlated superconductors reveal smaller β values, while larger β values are obtained for the weakly correlated superconductors. The β values for the strongly correlated superconductors approximately follow the line of β/Tc = 0.09, while the data of the weakly correlated superconductors follow the line of β/Tc = 22.5, indicating that the ratio of β to Tc also correlates closely with the electronic correlation strength in superconductors. This result implies that there are different effects of electronic correlation on the ratio of transverse mass to longitudinal mass between strongly and weakly correlated superconductors. Generally speaking, it can be understood that, even though Tc is enhanced, such as in the strongly correlated superconductors, the longitudinal effective mass increases faster than the transverse effective mass, leading to a smaller β value due to the relatively small value of TF. We can see that the correlation strength in superconductors can be experimentally revealed by the normal-state Hall angle, thus, more theoretical or experimental studies on the effects of electronic correlation in superconductors are necessary.
Having observed that correlation strength can be characterized by these derived parameters, one may further proceed to the debate between the HFL theory and holographic theory on the basis of the experimental data. According to the derivations in the previous section, it is worthy to notice that the value of Fermi energy EF, which is a key parameter related to the electronic state, can be respectively derived from the experimental data of pre-factor A (corresponds to the coefficient in T-linear resistivity as T ≫ W) and parameter α, as based on the HFL and holographic theories. The obtained EF from pre-factor A, as based on the HFL and holographic theories, are denoted by EF,HFL and EF,holo, respectively, and can be expressed by EF,HFL =  and EF, holo =
  Moreover, the value of EF can also be obtained from parameter α, as based on the holographic theory seen in equation (6), which is denoted by EF,holo,α, to have EF,holo,α =
Table 1 illustrates the obtained parameters of Tc, A, α, EF,HFL, EF,holo, EF,holo,α, TF, and J for the BFCA samples. In addition, the parameters of HTS YBCO and NBCO films are shown for discussion. Here, the parameters of Tc, A, α, TF, and J are obtained from the experimental results or calculations, as previously mentioned, where the A values for YBCO and NBCO films are obtained by their well linear fit to their ρ(T) data from 120–300 K. Again notice that the large error bars of TF arise from the various n3D values, as taken at normal-state temperatures, and some divergences in the values of S and γ reported. In addition, we replace the A values of bulk resistivity with the A/t values for calculation of the 2D sheet resistance, as described by theories, where t is taken as the c-axis length of the unit cell with t ≈ 1.3 and 1.2 nm for BFCA and HTS cuprates, respectively. Regarding calculation of the values of EF,HFL, EF,holo, and EF,holo,α, the information of (vF0/vF), λ, and A* for BFCA and HTS cuprates should be clarified. Considering the small anisotropic transport properties of BFCA and HTS cuprates in the crystal ab plane, we take (vF0/vF) ≈ 1, as shown in [18]. The values of λ for BFCA and HTS cuprates are taken as 0.12 and 0.3, respectively, by referring to the results in [49, 25]. The A* value of ∼4 for BFCA is estimated by Rullier-Albenque et al [1], while the A* value for the HTS cuprates has not been reported yet. As previously mentioned, A*describes the electron–electron scattering processes given by ħ/τe−e = A*T2/EF, thus, A* can be estimated from the Λ coefficient of T2-dependent resistivity, that ρ = mtr/ne2τe−e = (mtr/ne2) A*T2/(ħEF) = ΛT2. It has been reported that the Λ value of YBCO is ∼1.5 × 10⁻⁹ Ω cm K–2 and the Hall coefficient is RH = 1/ne ≈ 5 × 10⁻⁴ cm3 C−1 [50]. By considering EF = 2100 K [38] and mtr ≈ 12me [51], we obtain an A* value of ∼7.1 for YBCO, and then, proceed to calculate the EF,holo,α values of YBCO and NBCO.
Table 1. Obtained parameters of Tc, A, α, EF,HFL, EF,holo, EF,holo,α, TF, and J for BFCA samples, YBCO, and NBCO films. The TF of YBCO is taken from [38].
| Samples | Tc | A | α (6 T) | EF,HFL | EF,holo | EF,holo,α | TF | J |
| BFCA | K | μΩ cm K−1 | 10−3 K−2 | K | K | K | K | K |
| x = 0 | — | 1.08 ± 0.01 | 13.3 ± 0.3 | 495 ± 5 | 2345 ± 24 | 669 ± 153 | 682 ± 305 | 473 ± 108 |
| x = 0.05 | 19.1 | 0.52 ± 0.01 | 9.91 ± 0.05 | 1027 ± 20 | 4858 ± 95 | 527 ± 61 | 778 ± 283 | 373 ± 43 |
| x = 0.08 | 22.9 | 0.83 ± 0.02 | 6.70 ± 0.03 | 643 ± 161 | 3048 ± 76 | 858 ± 170 | 811 ± 413 | 607 ± 120 |
| x = 0.10 | 21.8 | 0.65 ± 0.02 | 3.31 ± 0.03 | 822 ± 25 | 3894 ± 120 | 1199 ± 300 | 1009 ± 197 | 848 ± 212 |
| x = 0.20 | — | 0.82 ± 0.01 | 1.90 ± 0.03 | 651 ± 8 | 3084 ± 36 | 2285 ± 161 | 1000 ± 204 | 1616 ± 114 |
| YBCO | 89.8 | 1.02 ± 0.01 | 7.80 ± 0.06 | 483 ± 5 | 5719 ± 59 | 1042 ± 4 | 2100 | 553 ± 2 |
| NBCO | 91.8 | 1.82 ± 0.01 | 12.5 ± 0.1 | 271 ± 2 | 3209 ± 24 | 784 ± 4 | 1616 ± 371 | 416 ± 2 |
As seen in table 1, the obtained EF,HFL values for BFCA, which are in the range of 495–1027 K, are near the TF values of 682 ± 305–1009 ± 197 K, which are derived according to the reported electronic specific heat coefficients [43]. However, the obtained EF,HFL values for YBCO and NBCO are much smaller than those of TF, implying that the assumption of (vF0/vF) ≈ 1 may need to be corrected when applying the HFL theory to HTS cuprates. On the other hand, all EF,holo values for BFCA, YBCO, and NBCO are almost several-time magnitude larger than those of TF, while EF,holo,α shows a more consistent result, as compared with the values of TF. These deviations may arise from the uncertain parameters of λ and A* for iron-based superconductors and HTS cuprates, which require further confirmation through experimentation. If any doubt remains about these derived EF values, it is clear that both the HFL and holographic theories hold truths regarding the temperature-dependent resistivity and Hall angle in these strange-metal superconductors, and some uncertain parameters still require further calibration for theoretical application.
5. Conclusions
By considering HFL and holographic theories, this research examined spin exchange energy J and model-dependent energy scale W in BFCA single crystals, as deduced from the Hall angles and resistivities, respectively. In theoretical surveys, both HFL and holographic theories give similar physics, meaning that there exist two transport relaxation times, which independently influence the Hall effect and resistivity in the so-called 'strange metal' systems. One can see that the values of J are almost the same as the W values, or are of the same order of several hundred Kelvin for the over-doped BFCA, which is in agreement with the HFL theory. Moreover, a drawn line of W/3.5 for BFCA in the higher-doping region up to the right from QCP shows the crossover from NFL-like behavior to FL-like behavior at high doping, leading to the obtainment of a new phase diagram for BFCA. Furthermore, this study has newly derived spin exchange energies and Fermi temperatures for some conventional and unconventional superconductors from Hall measurements in order to explore their electronic correlation strength. Findings show that the data of Tc/TF and J/TF for strongly correlated superconductors follow higher-ratio lines, as compared with those for weakly correlated superconductors. By contrast, the ratios of transverse mass to longitudinal mass for strongly correlated superconductors reveal smaller values. The ratios of Tc/TF, J/TF, and β/Tc are presented, for the first time, as characterizing the correlation strength in superconductors. In addition, both the HFL and holographic theories can describe the temperature-dependent resistivity and Hall angle in these unconventional superconductors, which have some uncertain parameters that require further experimental confirmation.
Acknowledgments
The authors thank the Ministry of Science and Technology of Taiwan for financial support under Grant Nos. 104-2112-M-002-008-MY2 (LMW), MOST-103-2112-M-006-014-MY3, and MOST-103-2119-M-006-014-MY3 (CSL).