


Abstract
The development of wafer-scale continuous single-crystal graphene layers is key in view of its prospective applications. To this end, in this paper, we pave the way towards a graphene growth model in the framework of the Langmuir adsorption theory and two-dimensional crystallization. In particular, we model the nucleation and growth of graphene on copper using methane as a carbon precursor. The model leads to the identification of the range of growth parameters (temperature and gas pressures) that uniquely entails the final surface coverage of graphene. This becomes an invaluable tool to address the fundamental problems of continuity of polycrystalline graphene layers and crystalline grain dimensions. The model shows agreement with the existing experimental data in the literature. On the basis of the 'contour map' for graphene growth developed here and existing evidence of optimized growth of large graphene grains, new insights for engineering wafer-scale continuous graphene films are provided.
Export citation and abstract BibTeX RIS

Content from this work may be used under the terms of the Creative Commons Attribution 3.0 licence. Any further distribution of this work must maintain attribution to the author(s) and the title of the work, journal citation and DOI.
GENERAL SCIENTIFIC SUMMARY Introduction and background. Chemical vapor deposition of graphene (CVD) on transition metal substrates is one of the most promising methods for large scale production of high quality graphene. Typically, graphene is grown by thermal decomposition of hydrocarbon sources (e.g. methane, ethylene and acetylene) on metal catalysts of low carbon solubility, such as copper, in order to achieve the surface-limited growth of single layer graphene. So far, detailed analysis on the thermodynamics of the CVD process at the fundamental level has been lacking, although it can have a major implication in optimizing the growth conditions for defect-free continuous graphene.
Main results. We have modeled the self-limited growth of monolayer graphene on copper, based on the Langmuir adsorption theory and 2D crystallization kinetics. By balancing the rates of the forward and reverse reactions between the vapor phase (CH4(g) and H2(g)), adsorbates (C(a), and H(a)) and graphene on Cu, the saturation coverage can be determined by considering the reaction equilibrium between the vapor and adsorbed phases, providing a quantitative relationship of the dependence of the final coverage on the growth parameters. Furthermore, our model can be used to predict the concentration of adsorbed carbon and the degree of supersaturation for a given set of growth conditions.
Wider implications. Our basic model of graphene growth on copper can be extended to different monolayer–catalyst systems that may provide important guidelines for CVD of other two-dimensional materials such as metal dichalchogenides and boron nitride, which are increasingly gaining widespread attention.
 Figure. Our model predicts the final area coverage fraction of CVD graphene on Cu (θG) as a function of growth parameters (PCH4, partial pressure of methane; PH2, partial pressure of hydrogen).
1. Introduction
Wafer-scale high-quality graphene would enable a variety of applications where exceptionally high electrical conductivity and carrier mobility [1], outstanding mechanical properties [2, 3], extremely high impermeability [4, 5] and chemical inertness are required. In 2009 large-area graphene was obtained by chemical vapor deposition (CVD) on Cu surfaces [6, 7], and since then significant progress has been made in improving the quality of the CVD-grown graphene. Despite the significant effort and advances in the empirical approaches to obtain high-quality graphene through CVD, many fundamental aspects of the graphene nucleation and growth process on Cu are not still fully understood. For instance, Li et al [8] and Kim et al [9] have observed that the growth of graphene grains tends to gradually come to a stop especially at low carbon precursor (CH4) concentration or low temperature before complete coverage is reached, leaving gaps between the graphene grains even under the continual supply of CH4. A similar observation was also made by Kemal et al [10] for the CVD graphene growth on Cu using ethylene (C2H4) as a carbon precursor instead of CH4. The outcome of the saturated, incomplete coverage is that the grain boundaries exhibit spacing with a dimension spanning from a few nanometers to more than hundreds of nanometers that fragmentize the graphene layer, degrading the electrical transport [11–13], the mechanical properties [14], compromising the chemical reactivity [15, 16] and modifying the permeability [17]. Although the problem of the incomplete final coverage was experimentally overcome by employing a second growth step where the increased concentration of the carbon source in the latter stage of the growth can close the gap, yielding a continuous film [8], the fundamental physical basis for the incomplete saturation graphene area is not yet clear. It deviates from the simple self-limiting mechanism of monolayer graphene growth on the Cu surface, since the growth reaction terminates before the entire catalytic surface is fully covered. Kim et al [9] have postulated, in agreement with prior evidence for similar growth behavior of graphene on Ru [18], that the saturation area is determined by the difference between the critical supersaturation and equilibrium concentrations of the carbon adspecies. However, a quantitative model to predict the values of supersaturation and equilibrium concentrations and in turn the saturation area for a given set of growth parameters has not been established yet. Therefore, a more detailed, fundamental understanding of the relevant nucleation and growth phenomena in a predictive manner is necessary to achieve full control over the graphene coverage and quality of the film.
In this paper, we present a simple model for the graphene growth by CVD in the presence of methane and hydrogen on the Cu surface under the framework of the Langmuir model of competitive adsorption [19, 20], which has also been previously used to model the decomposition of methane on Ni [20] and homogeneous decomposition of SiH4 [21, 22], and the two-dimensional (2D) crystallization thermodynamics [23]. Here, we assume surface adsorption up to a monolayer with carbon and hydrogen adatoms mainly comprising the absorbed '2D gas' coexisting with graphene at the surface. The thermodynamic driving forces for dissociative adsorption of CH4 and H2 and formation of graphene were provided by the density functional theory (DFT) calculations available in the literature in order to predict the rates of the forward and reverse reactions among the vapor (CH4(g) and H2(g)), adsorbates (C(a), H(a)) and graphene(a) on Cu. The model demonstrates the basic underlying principle that the saturation coverage can be elucidated by considering the reaction equilibrium between the vapor and adsorbed phases, and provides a quantitative relationship on the dependence of the final coverage on the growth parameters over an extended range of temperatures and gas pressures of the reagents.
We would like to underline that the main objective of this study is to start building a foundational work to rationalize the graphene growth with future possibilities for further refinement as more experimental results become available and for adaption to other carbon precursors and metal catalysts, and furthermore extendable to other 2D systems.
2. Model of Langmuir adsorption and two-dimensional crystallization
First, we give an example of the graphene growth conditions that lead to maximization of the graphene nuclei size but often hinder the possibility to obtain a continuous polycrystalline graphene layer [8, 9, 11]. Figure 1(a) shows a discontinuous graphene layer with grain lateral sizes larger than ∼20 μm on one side of a flat Cu substrate after 40 min of exposure to a CH4/H2 mixture (the experimental details are given in the supplementary data, available from stacks.iop.org/NJP/15/053012/mmedia). Longer growth time did not result in complete coverage, making the pin-holes between the graphene grains clearly visible under scanning electron microscopy (SEM). This saturation of graphene coverage has recently been observed for various conditions at which the effect is more significant for lower growth temperatures. The plot in figure 1(b) shows the evolution of the graphene area coverage with growth time on the underlying Cu for various growth temperatures with a fixed CH4/H2 ratio. The saturation values of the graphene area coverage, Asat, as a function of growth temperature obtained for a long growth time (>30 min) are shown in figure 1(c). This behavior can be macroscopically explained as follows. A slow growth rate, dictated by a low supply of methane in a diluted environment on a very flat Cu surface, tends to minimize the nucleation density [8, 9, 11], but at the same time a balance of the forward and reverse reactions on the Cu surface results in saturation of graphene coverage before all the graphene grains are connected [24, 25].
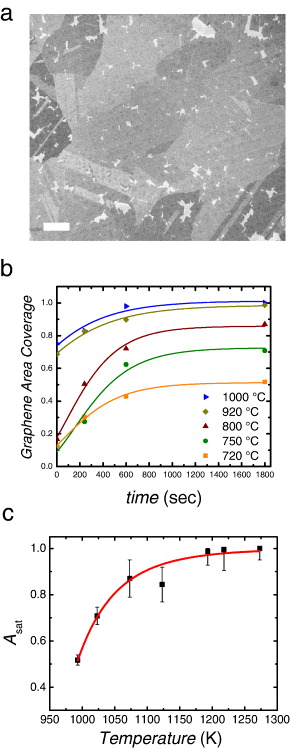
Figure 1. (a) SEM image of graphene grown on Cu at saturation. At reduced methane partial pressure, full complete coverage of graphene cannot be achieved leading to pin-holes and cracks in the layer (visible as bright regions of exposed Cu). Scale bar: 100 μm. (b) Temperature-dependent graphene area coverage versus time with curve fitting using the edge-controlled kinetics of graphene formation [9]. Below 1000 °C, the final graphene coverage is self-limited to a saturation value, Asat < 1. (c) Saturation graphene coverage (Asat) versus growth temperature. Curve fitting was performed by equation (22).
Download figure:
Standard image High-resolution imageStarting from this observation, we can now try to model graphene growth as a function of temperature and gas partial pressures (PCH4 and PH2). We use the framework of the modified Langmuir adsorption theory to model the self-limited graphene growth and obtain the saturation coverage. In this context, we first need to consider the balance of chemical surface reactions that lead to the formation of graphene. The overall reaction consists in the conversion of CH4(g) to graphene on the Cu surface, S(Cu) and H2(g):

This overall reaction can be split into three individual reversible reactions that lead to graphene formation: (i) the dissociative adsorption of CH4 once it reaches the proximity of the Cu surface and decomposes into monoatomic adsorbates (C(a) and H(a)) occupying five Cu surface sites (S(Cu)) per CH4 molecule (equation (2)); (ii) desorption of adsorbed hydrogen, H(a) (equation (3)); and (iii) graphene formation from carbon adsorbed (C(a)) onto the Cu surface (equation (4)):


On the basis of the observation that the direct interaction of CH4(g) and H2(g) with the graphene surface is not likely to occur, as both the decomposition of CH4(g) into graphene and the etching of graphene by H2(g) without the metal catalyst are found to be negligible in the typical range of deposition temperatures (700–1050 °C) [11, 26], we consider only the adsorption and desorption of these species at the Cu surface. Often the CVD of graphene is performed in the presence of excess H2 as it provides a reducing atmosphere to prevent the oxidation of Cu; however, etching of graphene on Cu is expected by the adsorbed hydrogen (reverse reaction of equation (2)) if the flow of CH4 into the system is stopped [27]. Furthermore, we rule out the effect of Cu evaporation that was reported to be detrimental for complete coverage in some low pressure chemical vapor deposition (LPCVD) experiments [28, 29]. This does not appear to be significant in our case as less saturation area coverage was observed for lower growth temperature where the evaporation rate of Cu should be negligible.
We note that the CH4 decomposition reaction can be broken down further into more steps involving the intermediate species that may form on Cu. Several contributions [20, 30] consider the intermediate steps of equation (2) on transition metal surfaces under the usual growth conditions to be the following:


However, the kinetic parameters of the intermediate steps can be combined to give an effective equilibrium constant for the overall reaction (details are given in the supplementary data, available from stacks.iop.org/NJP/15/053012/mmedia), considering that the three reactions are sufficiently independent.
As of now, there is no conclusive answer whether the main active species for the formation of graphene on Cu is carbon adatoms [31, 32], hydrogenated carbon species [33, 34] or carbon clusters [32, 35]. Here, for simplicity and for the fundamental demonstration of our model, we consider that the carbon adsorbed onto the Cu surface is in the form of adatoms, and given the flexibility of our model, it can readily be refined in the light of future experimental evidence.
On the basis of the existing experimental data and DFT calculations available in the literature, we can estimate that the enthalpy of adsorption of methane on Cu is about 3.2 eV [27, 36, 37], the hydrogen adsorption enthalpy is about −0.3 eV [38–40] and the enthalpy of graphene formation from adsorbed carbon is about −2.4 eV [32, 34].
We then express the rate of adsorption of methane or hydrogen according to the gas kinetic theory as

where P is the partial pressure of a reactant, m is the mass of a gas molecule, k is Boltzmann's constant, T is the temperature, s0 is the initial sticking coefficient pre-exponential factor and f(θs) is the free surface coverage (θs)-dependent sticking coefficient term and Ead is the activation energy of the adsorption.
Similarly, the rate of desorption of any adsorbed species on substrate sites can be expressed as

where n is the order of the reaction, νn is the nth-order vibrational frequency and we assume that νn = 1013 s−1 for most cases, which is the generally used value of a vibrational frequency when the experimental value is not known, [A] is the concentration of the adsorbed species and Edes is the activation energy of desorption.
Therefore, the rates of adsorption (r+1) and desorption (r−1) for the methane decomposition reaction (equation (2)) are, respectively,

and

Now, balancing the rates of adsorption and desorption for the CH4 decomposition reaction at equilibrium, we can define the constant of equilibrium, K1 = k1 /k2 , for equation (2) as

Typically, surface concentrations without the presence of graphene can be expressed as [C] = θCρs and [H] = θHρs, where ρs is the density of the surface sites on Cu (∼1.5 × 10¹⁹ m−2). However, here we assume that C and H adatoms competitively bind only to the available surface sites that are not covered by graphene such that [C] = θCρs/(1 − θG) and [H] = θHρs/(1 − θG). In addition, the sticking coefficient according to the Langmuir theory of monolayer adsorption is assumed to be [19]

We note that the coverage by CHx species resulting from the decomposition of methane is not considered since they are considered to be short lived [30].
Similarly, for H2 desorption reaction (equation (3)), the rates of desorption and adsorption are


Equating the two rates, we obtain the equilibrium constant

Finally, for the graphene formation reaction, equation (4), we consider the balance of attachment and detachment rates of carbon atoms per unit length of the graphene phase boundary based on two-dimensional crystallization kinetics [19]:

and

where ν+3_Cu and ν+3_G are the vibrational frequency factors for Cu and graphene, respectively, and aCu = 2.3 × 10⁻¹⁰ m and aG = 1.42 × 10⁻¹⁰ m are the lattice spacing for Cu and graphene, respectively.
The equilibrium constant for the reaction is then

Solving for the coverage of graphene from the above equations, we obtain
In the typical experimental conditions (PCH4, PH2 < 1 MPa, T = 300–1080 K), θS ≫ θC, θH. Thus,

is the dominant term giving rise to exponential behavior with apparent activation energy of ▵Had_CH4 − 2▵Had_H2 + ▵Hform_G.
Rearranging equation (22), we obtain the overall equilibrium constant, KG, for the conversion of methane (CH4(g)) to graphene adsorbed on Cu (equations (2)–(4)):

where the graphene coverage can also be written as

We now have an expression for the area coverage of graphene (Asat = θG) as a function of the temperature (equation (22)) and we can fit this to the experimentally obtained graphene coverage values. Fixing the enthalpy values and using the pre-exponential factor of K3 as the only fitting parameter, we obtained the value of the pre-exponential coefficient from the curve fitting to be 6.3 × 10⁻¹⁸ m−2 (figure 1(c)). This is a reasonable value as the vibrational frequency factors can vary over a few orders of magnitude [23]. Using one of the energy values as an additional variable results in a change of only ∼14% of the original value, which is within the range of predicted values for Cu(100) and Cu(111).
Based on the calculated values of equilibrium constants, we can identify the set of growth conditions for continuous coverage of graphene, incomplete coverage of graphene and no possible formation of graphene. In figure 2, the contour plot for graphene growth is shown for an extended range of experimental conditions of temperature and the ratio, PCH4/PH22, where we can assume that the enthalpy values and pre-exponential factors remain constant. Moreover, various experimental data points have been added in order to test our model in the light of the experimental results already published in the literature. In the region with zero graphene coverage, θG < 0 (figure 2, white area), the adsorbed carbon remains a two-dimensional gas without forming an sp2 network as the surface concentration of carbon adatoms is low [19]. Between θG = 0.997 and 0, the ensemble of growth parameters leads to the coexistence of graphene islands and adsorbed carbon on the copper surface without actually enabling the formation of continuous coverage. Note that PCH4/PH22 was chosen as the main parameter for the gas phase because θG is virtually independent of individual gas partial pressures if the ratio remained fixed (equation (24)).

Figure 2. Contour plot for saturation graphene coverage, θG (θG values are indicated by the labels near the left axis). Values calculated from the experimental conditions reported in the literature for various growth conditions have been plotted for comparison.
Download figure:
Standard image High-resolution imageWe can see that both sets of data points related to a continuous graphene layer [6, 11, 16, 29, 41–56] and a discontinuous graphene layer [45, 46, 50, 53, 55, 57–59] generally fall within the reasonable range of PCH4/PH22 values and temperatures predicted to provide the same behavior. Further, we have also plotted our experimental data (red squares) referring [9] to graphene grown at different temperatures where the graphene coverage can be either complete or incomplete depending on the temperature. The possible sources of discrepancy between our predictions and the experimental data are discussed in section 4.
3. Degree of supersaturation and chemical potential
Our theory can be further applied to provide useful insight regarding the degree of supersaturation during graphene nucleation as the saturation area coverage can also be determined by the supersaturation concentration of adsorbed carbon, [C]sup, at the onset of nucleation [19]. On the basis of Langmuir theory, the supersaturation concentration of carbon adatoms can be estimated to be [C]sup = θc'ρs, where θc' is the coverage of carbon atoms considering only the balance of equations (2) and (3) on the Cu surface before the onset of graphene nucleation and growth. This sets an upper limit on the physical supersaturation level of carbon adatoms. Within the limit of attachment/capture controlled nucleation and growth, this gives a reasonable upper limit for the [C]sup since adsorption and desorption equilibrium (equations (2) and (3)) is reached more quickly than the attachment/detachment equilibrium (equation (4))). For a finite graphene coverage, [C]sup must be greater than the equilibrium carbon concentration, [C]eq = 1/K3. Figure 3(a) shows the variation of [C]sup and [C]eq as a function of temperature. The intersection (indicated by an arrow) determines the minimum growth temperature required to form graphene. Similar temperature-dependent behavior for [C]sup and [C]eq has been also reported for graphene growth on Ru under ultra-high vacuum conditions [18, 60, 61].
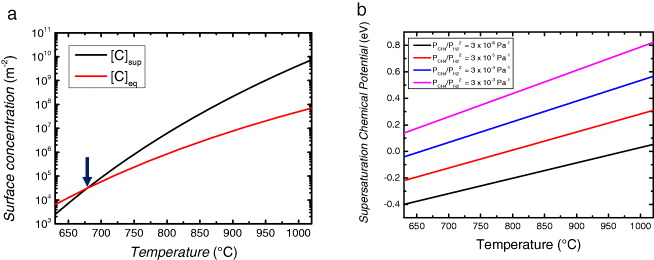
Figure 3. (a) Variation of supersaturation carbon concentration and equilibrium carbon concentration with temperature. The arrow indicates the temperature (∼954 K) below which graphene formation does not occur as [C]sup < [C]eq. The CH4 and H2 partial pressures used for the calculation are PCH4 = 40 Pa and PH2 = 360 Pa. (b) Variation of supersaturation chemical potential with partial pressure ratios and temperature.
Download figure:
Standard image High-resolution imageFollowing from equation (24), the equation for saturation area coverage can be also written as

This is because


 as
as  again in the typical range of conditions.
The supersaturation chemical potential, μsup = kT ln([C]sup/[C]eq), represents the driving force to form graphene at the onset of nucleation and it can be conveniently used as criteria for nucleation and growth of graphene for a set of various growth conditions. We have calculated the supersaturation chemical potential values for the data points based on the reported values of partial pressures of CH4, H2 and growth temperatures as illustrated in figure 3(b).
4. Discussion
The deviations between our predictions in the computed contour map (figure 2) and the observed range of experimental data points may arise from various sources. First, the inaccuracies in the condition-independent enthalpy values extrapolated by the DFT calculations and in the equilibrium pre-exponential factors due to variability of the surface morphology and crystallinity of the Cu surface may introduce an uncertainty in predicting the coverage in other experimental works. In addition, due to large differences between the flow conditions and designs of the experimental systems employed by the published works, it may be difficult to identify the accurate partial pressure values across the substrate surfaces. For example, the most commonly used Pirani or ionization gauges for pressure measurement are not gas independent and not reliable for measuring the pressure of gas mixtures without precise calibration for low pressure (LPCVD) experiments. In our experiment, we have specifically used a gas-independent capacitance gauge near the sample stage in order to monitor the actual gas pressures as accurately as possible. Moreover, especially for atmospheric pressure chemical vapor deposition (APCVD) growth experiments, where the mean free path of a gas particle is short, the growth can be diffusion limited, and a thick boundary layer can develop across the substrate [43, 62, 63]. This can impart gas compositions at the surface which is different from that of the bulk flow. Lastly, for high temperature and pressure conditions, the homogeneous, non-catalytic decomposition of CH4 can also occur [64–66]. This may be able to explain the larger-than-expected coverage of graphene for the significant deviations evident in 4 APCVD data points [52, 56–58] out of 37 in total. We have associated uncertainties with some of the possible sources of error (in enthalpy, pre-exponential exponents and pressure estimates) and computed the error bounds for the contour map in figure S1 in the supplementary data, available from stacks.iop.org/NJP/15/053012/mmedia. It is worth noting that the errors are not significant (below one order of magnitude) and that about 4/5 of the data points from the literature fit our model well within the range of error bounds.
Another possible challenge to our model is that in the limit of high θG close to 1, there may be additional energy required to properly 'stitch' the graphene grains of different orientations for continuous polycrystalline graphene. This may be especially true for Cu(100) and other high index planes where rotated domains of various misorientation angles are frequently observed. Since the formation energies for the grain boundaries are so far unknown, we assume that the graphene grains exhibit a single rotational orientation as in the case of Cu(111) or that the grain boundary energies are negligible. In the limit of low supersaturation, μsup ∼ 0, we have not considered the additional energy barrier to form the critical nuclei whose size has not been reliably predicted so far. The θG value estimated by our model in this limit represents the upper limit where there is no barrier for nucleation. Further systematic experiments will help us to address these issues and refine the predictions.
Overall, on the basis of our model, it is generally advisable to perform graphene growth at high partial pressure of the carbon source and high growth temperature in order to obtain a continuous layer. High temperature is also beneficial to decrease the density of nuclei, which is also in agreement with experimental observations [8, 9] and the theoretical predictions of the rate equations model [9, 67]. However, graphene grains of significantly larger size are formed under the extremely low pressure conditions in which continuous graphene coverage cannot be achieved [8, 11]. To overcome this hurdle, one possible solution is to employ two-step growth where large grains of graphene nucleate at low density and grow to saturation under low PCH4 and high PH2 in the first step, and then PCH4 is increased in order to reach continuous graphene in the second stage. Indeed, this has been experimentally shown by Li et al [8, 25] after the empirical observation that the density of nuclei increases at lower temperatures. Now to do so, appropriate gas pressures can be chosen by directly referring to our contour plot.
Another practical implication of our model for improving the quality of the CVD graphene is that fast cooling and termination of H2 flow into the system at the end of the growth [29] are advised for defect-free graphene coverage. This is because the chemical potential toward complete coverage of graphene decreases for fixed PCH4/PH2, which then leads to the catalytic etching of graphene by H2 during cooling. This effect of H2 etching has also been observed by Zhang et al [27] who have shown that etching becomes more significant at lower temperatures than 1000 °C as the equilibrium shifts toward the left side of the CH4 decomposition reaction (equation (2)). Therefore, the conditions for continuous graphene must be preserved during cooling by adjusting PCH4/PH2 or the system must be rapidly cooled to prevent the etching of graphene.
Moreover, in the framework of our model, we can also estimate the concentration of C adatoms based on the experimental results of area coverage evolution over time. Previously, the expression for time-dependent graphene area coverage, AG(t), can be obtained by solving the following differential equation of a simple, edge-controlled kinetics [9]:

where  is the rate of graphene area coverage increase due to atoms arriving, which is proportional to the concentration of adsorbed atoms on the graphene-free Cu surface and to the perimeter of the graphene island (
 ), and
  is the rate of decrease in the area coverage due to atoms leaving. Equation (28) can be modified according to our model such that

assuming that adsorption and desorption equilibrium is reached much faster than the nucleation of and growth of graphene, cnuc = [C]sup at the onset of the nucleation.
Also,

Using the relationship for the predicted saturation area, θG, [C]sup and [C]eq:

Also,

Substituting the above relationships into equation (28) and solving the equation, we can write the evolution of the graphene area coverage as

where

Here, katt, which gives the rate of the overall fractional area increase per unit time, can be linked to k+3, which gives the number of atoms arriving per unit length of a nucleus edge per unit time, as ![$ \frac{{{\rm{d}}a_{\rm{G}} }}{{{\rm{d}}t}} = \frac{{k_{ + 3} \left[ {\rm{C}} \right]}}{{\rho _{\rm{S}} }}\sqrt {a_{\rm{G}} }$](https://content.cld.iop.org/journals/1367-2630/15/5/053012/revision1/nj463108ieqn6.gif) and
and  , where aG is the mean area of the graphene nucleus and Ns is the density of nuclei independent of time assuming instantaneous nucleation.
Therefore,

Then the exponential factor, F, related to the rate constant of carbon attachment now becomes

Then, using the experimentally obtained F, Ns and θG and the estimated value of k+3, cnuc can be calculated by using the following equation:

The calculation for cnuc based on the analysis of the experimental values of F, Ns and θG (figure 4) yields supersaturation surface carbon concentration values of the order of ∼1 × 10⁹ m−2 in the range of 720–1000 °C, which are remarkably similar to the range of [C]sup values predicted by our model, although the large uncertainty in v+3_Cu and F makes further analysis difficult. This [C]sup value is much lower than the surface carbon adatom concentration of >1016 m−2 on Ru(0001) [68] (a consequence of the high adsorption energy of C on Ru) that has been measured by in situ low energy electron microscopy (LEEM). The extremely low surface concentration is possibly the reason why the recent attempt to directly measure the surface carbon concentration on Cu by LEEM or x-ray photoemission electron microscopy (XPEEM) techniques [69] has been fruitless so far.

Figure 4. The ln(F(θGNs)−1/2) versus 1/T curve based on the temperature-dependent experimental growth kinetics. The temperature-dependent values of F were calculated from the fitted values of time-dependent graphene area coverage in figure 1(b) based on equation (33). The linear fitting was performed to estimate the value of critical supersaturation concentration, cnuc, using equation (35).
Download figure:
Standard image High-resolution image
We would like to underline that our basic approach based on the balance of adsorption/desorption and surface reactions can be extended to consider different active species (e.g. CHx, carbon clusters and carbon chains) and some of these calculations are under way. However, this will not detract us from the main conclusion (the existence of three regions defined by the balance of the reactions). Furthermore, the fact that we can obtain good predictive fitting by considering only C adatom species may suggest that these species have an important contribution.
5. Conclusions
Summarizing, we have modeled the graphene growth by CVD on Cu surfaces to formulate the criteria for the final graphene coverage. The latter provides the range of growth parameters (temperature and gas pressures) in which two phases (graphene and adsorbed carbon) define the three fields: a continuous polycrystalline graphene layer, an uncompleted polycrystalline graphene layer coexisting with adsorbed carbon and adsorbed carbon species. The 'phase map', corroborated by experimental data, provides strategies to address the fundamental problems of continuity and crystalline grain dimensions at the same time. The model is versatile and it can be extended to different carbon precursors, from the solid to the liquid phase as well as different catalysts and different temperature ranges. Extension to the growth of other 2D atomically thin materials, such as the newly emerging transition metal dichalcogenides (TMDs) and boron nitride, will also be of particular interest.
Acknowledgments
We thank J Robertson for helpful discussions of this work. This work was financially supported by the NSERC (Canada), the Leverhume Trust, and Imperial College London. CM acknowledges the award of a Royal Society University Research Fellowship by the UK Royal Society.