


Abstract
The photophysical and photochemical processes driving the formation of the ultraviolet (UV)-induced DNA Dewar lesion from the T(6-4)T dimer are investigated by time-resolved spectroscopy and quantum chemical modelling. Time-resolved absorption and emission spectroscopy in the UV revealed a biexponential decay of the electronically excited state (S1) with time constants in the 100 ps and 1 ns range. From the S1 state the system forms the Dewar lesion (proven by time-resolved infrared spectroscopy), the triplet state of the T(6-4)T dimer and the ground state of the original T(6-4)T dimer. The decay process from the excited singlet is activated and thus temperature dependent. Quantum chemical modelling is used to describe the reaction path via a minimum on the excited electronic potential energy surface in close proximity to a triplet state. The transition to the Dewar isomer competes with internal conversion and with triplet formation. Only if the backbone between the two thymines is closed, is the Dewar isomer formed with a significant yield. The simulations reveal that the tension built up by the backbone is required for guiding the reaction to the conical intersection leading to the Dewar isomer.
Export citation and abstract BibTeX RIS
1. Introduction
Life exposed to sunlight is constantly challenged by the formation of ultraviolet (UV)-induced DNA lesions, which can lead to cell death or be the basis for carcinogenic mutations [1]. Dimeric pyrimidine photoproducts in TT or TC sequences in the DNA duplex structure have been identified as predominant triggers for UV-induced skin cancers [2–4]. The most frequently formed UV-photolesion in skin is the cyclobutane pyrimidine dimer (CPD) [5, 6]. The pyrimidine (6-4) pyrimidinone photoproduct occurs with somewhat lower yields [5]. The Dewar valence isomer is a secondary product characterized by strong mutagenicity [7, 8]. A schematic picture of the UV-induced reaction leading from thymidylyl(3' → 5')thymidine (TpT) to the T(6-4)T lesion and the Dewar valence isomer is given in figure 1. After UV-B excitation of TpT the T(6-4)T lesion is formed. The (6-4) lesions exhibit an unusually strong absorption band in the UV-A range (λmax = 325 nm for T(6-4)T)—here, the photon flux of solar radiation reaching the earth's surface is significantly larger than below 300 nm. In the presence of sunlight these lesions undergo a secondary photoreaction and react to the Dewar valence isomer. The main structural element in the Dewar lesion is the strained, fused double four-membered ring system which characterizes this lesion as a heterocylic version of Dewar's bicyclic structure for benzene proposed in 1867 [9, 10]. Irradiation of cells with simulated sunlight followed by analysis of the formed photolesions proved that the Dewar isomers are the finally accumulating UV-reaction products formed in genetic material upon exposure to sunlight [4]. They are involved in the formation of a broad range of different mutations, especially at T-C sites [7, 11–13].

Figure 1. UV-induced photochemical reactions in DNA that lead from TpT sites (left) to the formation of T(6-4)T lesions (middle) and T(Dewar)T lesions (right).
Download figure:
Standard imageThe photophysical and photochemical reactions following UV absorption in DNA have been a highly active field of research for decades [3, 14–19]. While many details of the photophysical processes have been revealed, a molecular description of the reactions leading to the different UV-photolesions is still the topic of numerous investigations [17, 19–27]. Here the low yield for the formation of the lesions—mandatory for life on earth—imposed significant difficulties for time-resolved techniques: photochemical reaction yields in the 1% range lead to very small signals related to lesion formation and require the most elaborate experimental techniques to monitor spectral signatures of intermediates and photoproducts.
Recently, transient absorption and time-resolved emission spectroscopy was used to directly monitor excited state deactivation in single bases and DNA molecules on the femtosecond time scale [17, 18, 23, 25, 28, 29]. DNA proved to be a highly dynamic and complex structure exhibiting a multitude of different deactivation channels covering the time range from femtoseconds to microseconds with different singlet excited states (excimer, exciplex) and triplet states [17–19, 30]. In particular, long-lived triplet states are prone to take part in photochemical reactions, calling for experiments performed over many orders of magnitude in time.
Early investigations have shown that photolesions can be formed via long-lived triplet states [3]. In these experiments, monomeric DNA bases have been investigated. It is not surprising that long-lived triplet states played a major role in the formation of dimeric lesions in monomeric solutions. Only the long lifetimes of triplet states allow an excited monomeric DNA base to diffusively encounter another base prior to deactivation. In recent publications we could show for a single-stranded all-thymine oligomer ((dT)18) and for a locked nucleic acid dinucleotide analogue (TlpTl) that the CPD photolesion is formed predominantly on the 1 ps time scale [22, 31]. In these systems a reaction via triplet states does not play a significant role in UV-B-induced CPD formation.
The situation could be different for other photolesions. For example, the formation of the T(6-4)T lesion was found to proceed much more slowly—on the millisecond time scale [21]. For this process intermediate reaction steps may involve triplet states [11]. The subsequent photoinduced reaction, the formation of the Dewar valence isomer after UV absorption in T(6-4)T, was the topic of a very recent publication [32]. It was shown that Dewar formation in a T(6-4)T dinucleotide occurs within approximately 130 ps synchronized with the decay of the excited electronic singlet state. Surprisingly, Dewar formation only takes place for a dinucleotide with intact backbone. Theoretical investigations on the electronic structure as well as on the excited state dynamics revealed the special role of the backbone in Dewar formation. The findings were also supported by experiments on a 1-methyl-2(1H)-pyrimidinone, mimicking the near-UV chromophore of a T(6-4)T lesion. For this minimal model system, no Dewar photoproduct was observed, but a significant population of a triplet state was found after the 450 ps decay of the excited singlet state [33].
In this paper, we investigate both the photophysical and photochemical reactions of T(6-4)T and aim at a detailed and complete picture of the dynamics of the Dewar valence isomer formation including singlet as well as triplet pathways. We use time-resolved emission experiments at different temperatures, probe the transient absorption changes in the visible (Vis) with increased precision, extend the range of the infrared (IR) experiments from the picosecond to the microsecond range and perform theoretical studies that relate the reaction dynamics to singlet–singlet, singlet–triplet coupling and different isomers. The data show the decay of the light-emitting excited singlet state and Dewar formation on the 100 ps time scale. A strong temperature dependence points to thermal activation of the Dewar formation reaction. The data also reveal an additional weak component in the decay of the light-emitting state. In the time range of 1 ns, the spectral signatures in the IR and the visible point to the existence of a weakly populated (2–10%) triplet state. However, they do not show any indication of Dewar formation via the triplet state.
2. Materials and methods
2.1. Sample preparation
For the study a T(6-4)T dinucleotide containing a bio-isosteric formacetal linker instead of the natural phosphodiester was synthesized using a published procedure [32]. Briefly, the formacetal-linked thymine dinucleotides were prepared and purified as described previously [34]. The compounds were irradiated with UV light at 254 nm under anaerobic conditions to give the T(6-4)T dinucleotides [35]. Subsequently, the T(6-4)T dinucleotides were analysed and purified by reverse-phase HPLC.
2.2. Steady-state spectroscopy
Steady-state spectra were recorded with an UV/Vis absorption spectrometer (Perkin-Elmer, Lambda 750), a fluorescence spectrometer (Horiba, Fluorolog 3) and a Fourier transform IR spectrometer (FTIR) (Bruker, IFS 66). To avoid an inner filter effect when recording fluorescence spectra, the optical density of the sample solution was kept below 0.05 (for a path length of 1 cm). The fluorescence spectra were corrected for the spectral sensitivity of the instrument. 2-(1-Naphthyl)-5-phenyloxazole (1-NPO; supplied by Lambda Physics) in cyclohexane was used as a reference dye for the determination of the fluorescence quantum yields.
Reaction quantum yields were determined using the FTIR spectrometer as a detector. The fourth harmonic at 266 nm of a Q-switched Nd:YAG laser (model: NY60-B, Continuum) served as a light source. The average power of the actinic light amounted to 7.4 mW.
2.3. Time-resolved spectroscopy
2.3.1. Fluorescence
Time-resolved fluorescence data were acquired using a streak camera system in combination with femtosecond excitation. A detailed description of the experimental setup is given in [33]. In brief, excitation was performed with light pulses centred at 320 nm (with pulse energies of ∼60 nJ). At the sample location the diameter of the excitation light was about 15 μm. Fluorescence emission induced by this excitation was collected by a reflective microscope objective of Cassegrainian type (Ealing, 15 × , numerical aperture (NA) 0.5, back focal length infinity) in forward scattering geometry. The collected light was focused onto the entrance slit (40 mm) of an imaging spectrograph (Princeton Instruments, Acton Series SP 2356, f = 300 mm, equipped with a 50 lines per mm grating) using a 50 mm fused silica lens. For the settings employed, the spectral resolution of the spectrograph amounted to 2.6 nm. The focal plane of the spectrograph was imaged onto the photocathode of a streak camera system from Hamamatsu (C5680-24 C). The time window was set by a fast single-sweep unit (Hamamatsu, M5677-01) with the sweep velocity chosen according to the time scale of the process under consideration. The fluorescence emission was detected for different sample temperatures of 291, 301, 322 and 334 K. For the processes on the 100 ps time scale, a sweep time per full screen of 0.96 (1.60 ns for the 291 K data set) with an effective time resolution of about ∼10 ps (∼20 ps) was used. Processes of the order of several nanoseconds were monitored with a time window of 10.2 ns and an effective time resolution of about 80 ps. The fluorescence data were captured in the continuous sweeping mode by the use of the dynamic photon counting capability of the data acquisition software (Hamamatsu, HPD-TA version 8.0.6pf) which was part of the streak system. Typically, data were collected to yield >105 counts for the ps time window and >106 counts for the 10 ns time window at the emission maximum. The time for each measurement amounted to ∼15 min.
2.3.2. Transient absorption spectroscopy
The experimental setup for the transient absorption experiments has been reported earlier [32]. In brief, the output of a Ti-sapphire femtosecond laser-amplifier system (Spitfire Pro, Spectra Physics) operated at a central wavelength of ∼800 nm and pulse durations of ∼100 fs (at 1 kHz repetition rate) was used to generate pump and probe pulses for a transient UV/Vis and a transient IR spectrometer. Excitation pulses (pump) at 323 nm were generated by frequency doubling the output of a two-stage noncollinear optical parametric amplifier [36]. An optical delay line allows us to monitor absorption changes from femtoseconds up to 3 ns. For experiments on the nanosecond to microsecond time scale, excitation pulses were generated by the third harmonic of an electronically synchronized Nd:YVO laser at 355 nm [37]. A mechanical chopper was used to block every second excitation pulse in order to improve referencing and recording of the induced absorption changes in the sample. The sample solutions were held in flow cells (UV/Vis: fused silica windows and a path length of 0.5 mm; IR: BaF2 windows and a path length of 90 μm) that allow the complete exchange of the excited sample volume between consecutive laser pulses.
In the UV/Vis experiment the pump pulses at 323 nm had an excitation energy of ∼180 nJ and a beam diameter at the sample position of dpump = 220 μm (full-width at half-maximum, FWHM). The absorption changes were probed by using a delayed white light continuum generated in a CaF2 window (dprobe = 50 μm at the sample position) [38, 39]. The relative polarization of pump and probe beams was set at the magic angle. The transmitted probe light was detected by a multi-channel detection system as described in [32]. The data points at certain delay times between the pump and the probe were measured in ten repetitive scans and 2000 laser shots per data point. The data were corrected for transient background signals of the pure solvent.
In the IR experiment, the pump pulses at 323 nm had an excitation energy of ∼850 nJ and were focused to a beam diameter of 200 μm (FWHM) at the sample position. In the nanosecond experiments, pump pulses at 355 nm with an excitation energy of 2.4 μJ and a beam diameter of 185 μm were applied. The generation of probe pulses in the mid-IR has been described in [40]. In brief, a part of the fundamental light of the laser amplifier was used to generate a pair of near-IR pulses via a combination of a noncollinear and a collinear optical parametric amplifier. Difference frequency generation of the near-IR pulses in an AgGaS2 crystal was used to generate tunable pulses in the mid-IR between 3 and 11 μm. The probe pulses were superimposed with the pump pulses under magic angle conditions. The transmitted probe light was spectrally dispersed and detected with an array of MCT detectors (32 elements, Infrared Associates). Typically, 2000 probe pulses were averaged to allow for the recording of absorption changes as small as 50 μOD. The sample solution had a concentration of 16.6 mM and the sample volume was sufficiently high to avoid artefacts due to accumulation of the Dewar isomer.
In time-resolved IR experiments, the excitation of the T(6-4)T molecules and subsequent reaction and relaxation processes leave the product molecules and the surrounding solvent with vibrational excess energy, i.e. with an overall heating of the excited sample volume. This heating of the solvent molecules induces an absorption change that superimposes the absorption signal of the investigated molecules. In the present experiment, dominant heating of the D2O solvent molecules occurs upon relaxation of the excited electronic state. Therefore the data shown in figure 8 have been corrected for the contribution of heating of the solvent D2O as has been described in detail in [32].
2.4. Theoretical methods
2.4.1. Quantum chemical calculations of electronic excited states
The calculations on the formacetal bridged T(6-4)T are based on a hybrid partitioning approach (ONIOM) [41, 42], which includes the steric effects and ground state polarization effects of the complete dinucleotide on QM/QM level of theory. The first high-level quantum mechanical (QM) part refers to the photoactive chromophore 5-methyl-2-pyrimidinone (5M2P), where the electronic excitation and subsequent bond rearrangement takes place, and the second low-level QM part describes the remaining part of the bridged T(6-4)T (sugar glycol backbone + dihydrothymidine part). The localized excitation in the chromophore (high-level QM part) is justified by the identical absorption spectra of the free base 5M2P [43] and the methylene-linked T(6-4)T and allows for the calculation of excited state energies and the optimization of conical intersections based on the constrained low-level state (=CLS) approximation (ONIOM(CAS:HF)) [44–46]. All bonding and anti-bonding π-orbitals, as well as lone pairs of the nitrogen and oxygen atoms (nN, nO), are included in the active space of the high-level QM part (CAS(12/9)). Calculations are performed with the 6-31G* split valence double zeta basis set; basis-size effects have been checked by additional calculations with the superior aug-cc-pvdz basis set. For accurate excitation energies, multi-state multi-reference perturbation theory (MS-CASPT2) [47–49] has been applied on the high-level QM part (ONIOM(MS-CASPT2-CAS(12/9):HF)).
To evaluate the branching space topography at the conical intersections involved in the photoinduced reaction, the cone parameters of CoInDewar and CoIn5M2P have been calculated with the COLUMBUS program package [50, 51].
The spin–orbit coupling matrix elements (SOCME) between singlet (S0, S1) and triplet states (T1, T2) are calculated on ONIOM(CAS(12/9):HF) level of theory using the Breit–Pauli operator [49] under the assumption of locally excited states (CLS approximation).
2.4.2. IR- and difference IR-absorption spectra
For the calculation of IR spectra, harmonic normal mode analyses have been performed at the minima structures of S0-(6-4), (Dew) and T1-(6-4). We employed density functional theory (hybrid-functional B3LYP) and all normal modes have been rescaled with the common empirical factor (0.9614) for the B3LYP functional. To account for solvation effects the molecules are implicitly solvated in a polarizable continuum model (PCM) [46, 52]. The solvation affects the investigated C = O modes both in their spectral position (redshift  ) and the intensity pattern. For the simulation of the respective difference spectra, we used a Lorentzian linewidth of 9.5 cm−1.
3. Experimental results
3.1. Steady-state ultraviolet/visible (UV/Vis) spectroscopy
Figure 2 shows ground-state absorption spectra of the dinucleotides depicted in figure 1. The dinucleotide TpT (grey) exhibits a strong electronic absorption band centred around 260 nm as expected for the intact DNA base thymine [17]. UV excitation of this ππ* transition can lead to the formation of the T(6-4)T lesion (black). Compared to TpT, the lowest ππ* absorption band of the T(6-4)T lesion is lower in oscillator strength and red-shifted by about 75 nm. It peaks in the UV-A range at about 325 nm. With the formation of the T(Dewar)T by illumination at e.g. 355 nm the characteristic ππ* absorption of the T(6-4)T lesion at 325 nm disappears. The T(Dewar)T does not show a characteristic absorption band in the near UV. The absorption is shifted below 250 nm, which hinders the investigation of the formation of the Dewar isomer in the UV range.
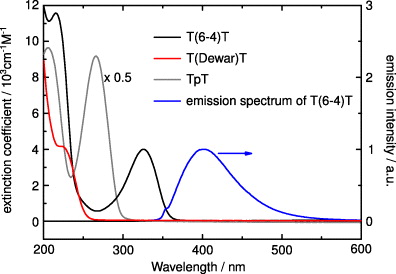
Figure 2. Absorption spectra of TpT (grey), T(6-4)T (black) and the T(Dewar)T lesion (red) dissolved in deuterated water. The extinction coefficient for TpT has been scaled by a factor of 0.5 to allow for a better comparison of the spectra. The normalized fluorescence spectrum (photon flux per wavelength interval) of T(6-4)T (blue) was determined with excitation at 325 nm. The small shoulder of the emission spectrum at ∼350 nm is due to the Raman scattering signal of the solvent.
Download figure:
Standard imageThe fluorescence spectrum of the T(6-4)T (blue) (after excitation at 325 nm) shows an emission peak at 400 nm. A similar value of 393 nm has been reported for the (6-4) lesion of TpT by Blais et al [53]. The small shoulder of the emission spectrum at ∼350 nm is due to the Raman scattering signal from deuterated water. The fluorescence quantum yields of intact DNA bases are extremely small, of the order of 10–4 (due to ultrashort excited state lifetimes) [17, 54–57]. The fluorescence quantum yield of T(6-4)T was estimated via an analysis according to Strickler and Berg [58], resulting in a value of the order of 1% in general agreement with the value of 3% reported in [53].
3.2. Time-resolved fluorescence
To gain information on the lifetime of the excited state of T(6-4)T after photo-excitation (at 320 nm), the fluorescence emission has been monitored on the picosecond and nanosecond time scale with a streak camera setup. The results of these measurements are given in figure 3. The upper diagram (figure 3(a)) is a contour representation of the fluorescence emission observed between 350 and 600 nm at 301 K. The plot covers a time window of up to 800 ps and shows a fluorescence emission with a spectral shape similar to the steady-state emission spectrum (see figure 2). A global fit of the emission spectrum reveals more details. The fit routine yields two decay components (given as dotted and solid lines on the right axis) peaking at 420 and 405 nm. They show small differences in spectral shape. The slower component exhibits a much weaker amplitude, indicating that the corresponding emitting state was populated to a smaller extent. Assuming the same emission cross-section for both components, one can deduce a relative population of 13 and 87%, respectively.
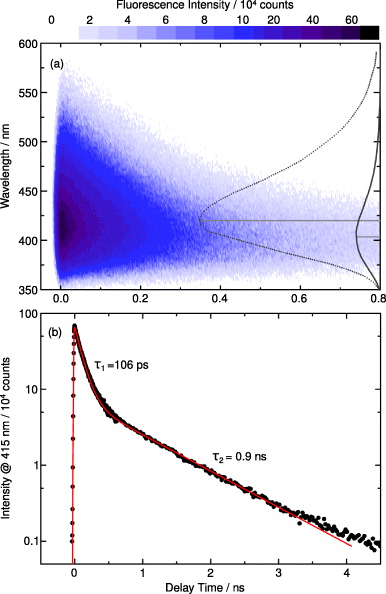
Figure 3. Time-resolved fluorescence of T(6-4)T dissolved in deuterated water. Sample solutions (concentration ∼3 mM) were held at a temperature of 301 K and excited with femtosecond laser pulses at 320 nm. (a) Contour representation of the data. The data can be fitted by a sum of two exponential decays with time constants of 106 ps and 0.9 ns. The decay-associated spectra of the fast (dotted line) and the slow component (solid line) are shown on the right. The peak positions are marked by dotted lines. (b) Time dependence of the transient fluorescence decay monitored at 415 nm. The data were taken with two experimental settings (see text) to cover the range from ps to 10 ns. A fit using two exponentials (τ1 and τ2) is given as a red line. At delay times greater than 4 ns small deviations between the fit and the experimental data are due to an instrumental offset visible at very low light intensities.
Download figure:
Standard imageThe kinetics of the fluorescence emission at 301 K is shown in figure 3(b) by plotting the emission intensity at 432 nm (with logarithmic scaling) versus the delay time in nanoseconds. The data are well reproduced by a sum of two exponentials (red line) representing the two components mentioned above: (i) a strong component 1 decays with a time constant of ∼106 ps and (ii) a weaker component 2 (by a factor 0.14) with a time constant of ∼910 ps. At late delay times (5 ns) a small deviation between fit and data is visible. This can be attributed to the instrumental offset at very small emission intensities. Performing experiments at different temperatures (between 291 and 334 K) reveals a strong temperature dependence of the decay times. An overview of the temperature-dependent results is given in table 1. Rising the temperature from 291 to 334 K leads to a decrease of the time constants from 137 to 64 ps (for decay component 1) and from 1.24 to 0.5 ns (for decay component 2); the relative amplitudes remain essentially constant. An Arrhenius plot of the data showing the observed temperature dependence of the rate constants for decay component 1 (red squares) and 2 (black dots) is given in the supplementary data (figure S1), available from stacks.iop.org/NJP/14/065006/mmedia. Both decay times decrease with increasing temperature with slightly different slopes. Analysis of the data with the Arrhenius equation k = k0 exp(−EA/kBT) yields calculated activation barriers of EA1 = 1090 cm−1 and EA2 = 1467 cm−1 for the fast and the slow component, respectively. The derived values are within an error margin of the order of 10% (see the supplementary data).
Table 1. Temperature-dependent time constants τi and peak amplitudes ai derived from time-resolved fluorescence measurements of T(6-4)T dissolved in deuterated water.a
| Temperature (K) | τ1 (ps) | τ2 (ns) | a1 (104 counts) | a2 (104 counts) | a1/(a1+a2) | a2/(a1+a2) |
|---|---|---|---|---|---|---|
| 291 | 137 | 1.24 | 129 | 19 | 0.87 | 0.13 |
| 301 | 106 | 0.91 | 61 | 8.3 | 0.88 | 0.12 |
| 322 | 86 | 0.6 | 60 | 9.0 | 0.87 | 0.13 |
| 334 | 64 | 0.5 | 24 | 4.2 | 0.85 | 0.15 |
aThe values were obtained by a global fit using a sum of two exponentials. Relative standard and systematic errors are of the order of 10% as discussed in section 3.2.
3.3. Transient UV/Vis spectroscopy
The absorption changes induced after excitation at 323 nm of the T(6-4)T lesion have been recorded in the UV and Vis spectral ranges. In figure 4(a), a contour plot shows the observed transient absorption between 350 and 700 nm. Positive absorption changes (induced absorption) are given in yellow/red, while negative absorption changes are indicated in cyan/blue. The delay time is given in a linear scale around time zero until 1 ps and with logarithmic scaling thereafter. Immediately after excitation a broad induced absorption is observed throughout most of the Vis spectral range. An absorption decrease is found in the range of the fluorescence emission at about 400 nm. Figure 4(b) depicts transients at the indicated probing wavelengths covering the areas of induced absorption in the Vis (550 nm) and UV (360 nm) part of the spectrum as well as in the range of about 400 nm with negative absorption changes (416 nm).
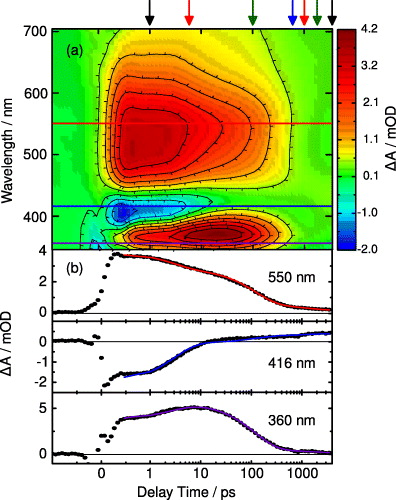
Figure 4. Transient UV/Vis absorption data of T(6-4)T dissolved in deuterated water after excitation with 323 nm femtosecond laser pulses (at room temperature). The change in absorption was probed in the range between 350 and 700 nm. Note that the time axis is linear until 1 ps and logarithmic thereafter. (a) In the contour plot, red colour indicates positive absorption changes, and blue colour the negative ones. (b) Representative time traces at the indicated wavelengths including fits (solid lines) derived from a global data analysis (positions are marked as coloured lines in the contour plot). Transient spectra at positions indicated by the arrows on top are given in figure 5.
Download figure:
Standard imageThe data were analysed using a global fit based on the sum of exponentials (solid blue lines in figure 4(b)). The fit delivers three decay times of 2.9 ps, 120 ps and 1.1 ns and an offset describing the absorption changes at very late delay times (>3 ns). The spectral characteristics of the observed absorption changes can be seen in figures 5(a) and (b). The upper panel (a) shows the transient spectra between 1 ps (black line) and 500 ps (blue line). One can see the overall decrease of induced absorption (between 450 and 700 nm) and negative absorption changes (between 400 and 450 nm). After 500 ps a residual positive and broad absorption change over the whole spectral region is visible. The residual absorption change at late delay times is given in more detail in figure 5(b), where absorption changes between 0.5 ns (blue line) and 3.5 ns (black line) are depicted. There is a further decrease of the induced absorption between 450 and 700 nm, while an increase in absorption occurs between 390 and 450 nm. For comparison, we plot also the absorption difference spectrum of the minimal model molecule 1-methyl-2(1H)-pyrimidinone (1MP; grey broken) 3 ns after photoexcitation (redrawn from [33]). These traces suggest that the long-time offset of both molecules may originate from the same transient species.
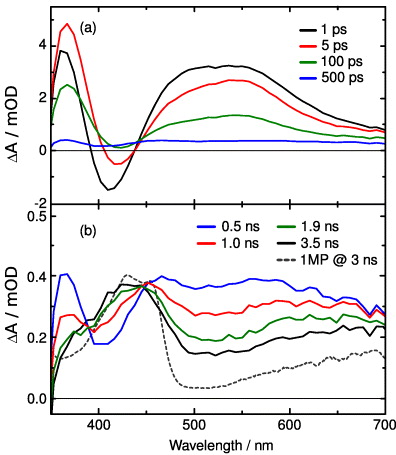
Figure 5. Transient absorption spectra of T(6-4)T at the indicated delay times after excitation at 325 nm. (a) Early absorption changes between 1 and 500 ps. (b) Changes observed on the 1 ns time scale. For comparison, the absorption change observed for 1-methyl-2(1H)-pyrimidinone (1 MP) 3 ns after 320 nm excitation is depicted as a dashed grey line (see [33] for details).
Download figure:
Standard imageThe basic features found in emission and UV/Vis absorption experiments are as follows: the early absorption changes are the result of the population of the initially excited state and represent excited state absorption (ESA) and stimulated emission of the excited T(6-4)T lesion. On the time scale of a few picoseconds a first transient occurs (∼2.5 ps) with significant changes of the amplitude and spectral position of the stimulated emission. This indicates that the processes monitored are related to vibrational relaxation in the electronically excited state combined with solvation [59]. Subsequently, most of the ESA and the fluorescence emission decay with a time constant in the 100 ps range. Here we observe the dominant part of the decay of the excited electronic state. On the 1 ns time scale one finds the decay of ESA and fluorescence emission with much weaker amplitudes. After these processes the UV/Vis absorption changes indicate that most of the excited molecules have decayed to the electronic ground state, while small absorption changes remain. The latter are compared with the results obtained for 1MP. The obtained difference spectrum after 3 ns (dashed grey line) is characteristic of the triplet state of 1MP. The close resemblance between the 3 ns spectrum of 1MP and the 3.5 ns spectrum of the T(6-4)T lesion is an indication that a considerable amount of triplet states are formed after UV excitation of the T(6-4)T lesion. Since the Dewar valence isomer does not show absorption in the Vis or near UV the experiments cannot give indications on its formation. More detailed information on the photophysical and photochemical reaction pathways will be obtained below from steady-state and time-resolved IR spectroscopy.
3.4. Steady-state infrared (IR) spectroscopy
The steady-state IR absorption spectra of the T(6-4)T and the T(Dewar)T lesion are given in figure 6. In the plotted spectral range (1625–1830 cm−1) the absorption is dominated by C = O groups. In figure 6(a), the ground state absorption spectrum of the T(6-4)T lesion (red line) is compared with the ground state absorption spectrum of the T(Dewar)T lesion (black line) obtained after extended illumination by light at 355 nm. The resulting difference spectrum is given in figure 6(b) (black line). In the T(6-4)T lesion one can identify three absorption bands with peaks at 1650 cm−1 (shoulder on the left), 1665 cm−1 and 1712 cm−1. In the T(Dewar)T lesion the absorption shows well-separated peaks at 1673 and 1714 cm−1 and one at 1781 cm−1. This latter region is typical of C = O oscillators where the C atom is incorporated into an aliphatic ring (e.g. as in a Dewar isomer). Therefore this band can be used as a marker for the formation of the T(Dewar)T lesion. Recently, the absorption band at 1781 cm−1 was used to determine the formation yield of T(Dewar)T lesions. A quantum yield of about 8% has been determined in irradiation experiments with 355 nm excitation [32].
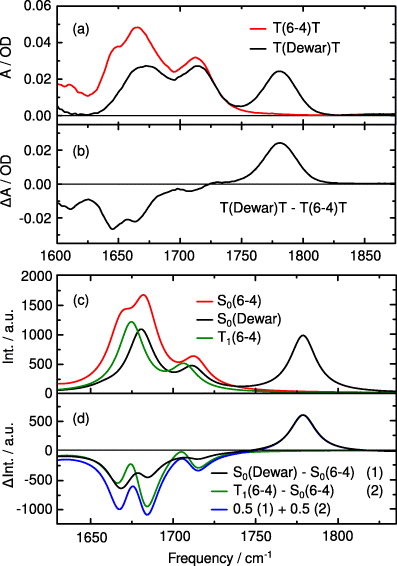
Figure 6. Experimentally determined and calculated absorption and difference spectra in the IR. (a) Ground state absorption spectra of the T(6-4)T lesion (red) and the T(Dewar)T valence isomer (black). (b) Difference spectra between T(6-4)T and the T(Dewar)T lesion determined after UV illumination (black). (c) Calculated absorption spectra of the T(6-4)T lesion in the electronic ground state (red) and the triplet state (green). The absorption spectrum of the T(Dewar)T lesion is given in black. (d) Calculated difference spectra between the T(Dewar)T isomer (black, 1) and the T(6-4)T lesion, the T(6-4)T triplet state and the T(6-4)T lesion (green, 2). The difference spectrum for a 50:50 ratio of T(Dewar)T (1) and T(6-4)T triplet state (2) is depicted in blue. Note that the blue and the black difference spectra are normalized to yield the same amplitude at the peak of the Dewar band at 1780 cm−1.
Download figure:
Standard imageFor further interpretation of the IR spectra, quantum chemical calculations were performed (see the next section for details). Panel (c) in figure 6 shows the calculated ground state absorption spectra of T(6-4)T (red) and T(Dewar)T (black) as well as the absorption of the T(6-4)T triplet state (green). Difference spectra for different ratios of ground and triplet state contributions are given in figure 6(d). The calculated absorption spectrum shows three absorption bands for the singlet ground states of T(6-4)T. In the T(Dewar)T lesion a characteristic absorption band occurs at 1780 cm−1. As expected this band represents the C = O vibration at the Dewar moiety. The calculated triplet state of T(6-4)T (green) shows two absorption bands with peaks at 1706 and 1674 cm−1 which overlap with the two lower absorption bands of the T(Dewar)T. In the calculated difference spectra, the participation of a triplet state intermediate results in characteristic spectral signatures in the range between 1650 and 1725 cm−1. This suggests that the presence of a triplet state can be monitored with time-resolved IR spectroscopy.
3.5. Time-resolved IR spectroscopy
The results of time-resolved IR spectroscopy are given in figure 7. In the contour plot of figure 7(a), blue colour indicates negative absorption changes (bleach), while red colour indicates positive absorption changes. From 1 to 600 ps, one finds a strong bleach signal between 1625 and 1690 cm−1. This bleach signal decays on the 100 ps time scale. On the same time scale there is the decay of an increased absorption centred at 1710 cm−1. In the range of the T(Dewar)T marker band (1780 cm−1, signal amplitudes scaled by a factor of 10), a positive absorption band grows concomitant with the decay in the lower frequency range.
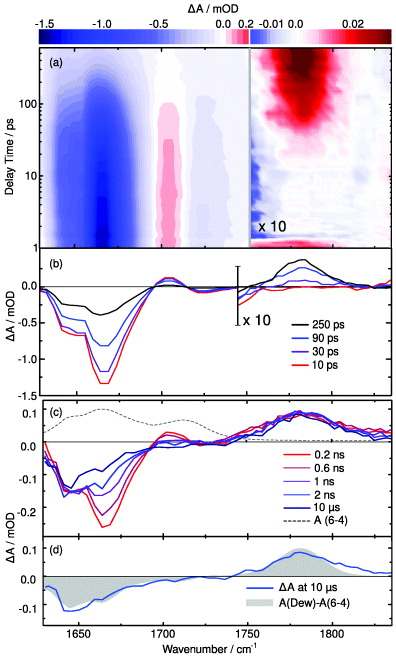
Figure 7. Transient absorption signals of the T(6-4)T lesion after excitation at 323 nm. (a) Contour plot of the absorption changes up to 600 ps. The spectral range between 1750 and 1870 cm−1 has been scaled by a factor of 10. (b) Transient spectra on the picosecond time scale at the indicated delay times. (c) Spectral changes observed on the nanosecond to microsecond time scale. The ground state absorption spectrum of T(6-4)T is depicted as a dashed grey line. (d) Comparison of the absorption change observed after 10 μs (blue line) with the spectral signature expected for the formation of the T(Dewar)T isomer (grey area). The data shown have been corrected for the contribution of heating of the solvent D2O (by about 20 mK) as has been detailed in [30].
Download figure:
Standard imageLooking at the transient spectra given in figure 7(b) one can see the spectral characteristics of the absorption changes on the picosecond time scale in more detail. The broad bleach between 1625 and 1690 cm−1 occurs in the range of the ground state absorption of the T(6-4)T lesion with a peak at about 1665 cm−1 and a shoulder at 1640 cm−1. The absorption increase at 1710 cm−1 can be tentatively assigned to an excited state C = O vibration. A global analysis of the data reveals several dynamic processes. One finds a fast 3.4 ps transient in accordance with the results of time-resolved experiments in the UV/Vis. Recovery of the ground state absorption and the formation of the marker band at 1780 cm−1 occur with the time constant of τ = 128 ps. The appearance of this band gives unequivocal evidence for the formation of the T(Dewar)T on this time scale.
In an additional transient IR experiment, we investigated the processes on the nanosecond to the microsecond time scale. The results are given in figures 7(c) and (d) together with the ground state absorption of the T(6-4)T lesion (broken curve). The transient spectra recorded between 0.2 and 2 ns in figure 7(c) show a strong change of the bleach in the region of the ground state absorption band at 1663 cm−1. The dynamics can be separated into a fast (about 1 ns) and a slower component. The latter leads to a further recovery of the ground state absorption on the 500 ns time scale. The situation is different in the low-frequency part below 1650 cm−1 where absorption recovers partially on the 100 ps range but stays constant afterwards. Within the experimental accuracy the T(Dewar)T marker band at 1780 cm−1 also does not change after t > 500 ps. At the end of our observation period at 10 μs we observe a very good match between the transient spectrum (blue line) and the steady-state difference spectrum (light grey area) in figure 7(d). With this information we can conclude that the T(Dewar)T is formed predominantly on a time scale of 130 ps.
The changes in the range of the ground state absorption of the T(6-4)T lesion (1600–1700 cm−1) on the ns time scale need further discussion. The results from time-resolved UV/Vis experiments suggest the rapid formation of a triplet state (see the comparison with 1MP given in figure 5(b)). This is in line with the fact that intersystem crossing (ISC) to a triplet state is promoted by carbonyl functions of the T(6-4)T moiety [60]. For ISC one would expect to find IR absorption changes as derived for the calculated difference spectra in figure 6(d). Indeed, one finds prominent changes around 1660 cm−1 on the 500 ns time scale as expected for a triplet decay.
3.6. Reaction model describing the experimental results
The experimental results obtained can be summarized in a reaction model as given in figure 8. UV excitation from the ground state (blue) populates T(6-4)T in the Franck–Condon region (FC T(6-4)T*, red). From the Franck–Condon region the molecules evolve on the excited state surface. We find a time constant of about 2.5 ps for the relaxation to local minima on the excited state surface. The experimental observation of two time constants in the decay of the excited electronic state is indicative of the population of two local minima in the excited state (light and dark purple boxes). The amplitudes in fluorescence emission point to relative populations of 13 and 87% for the components with life times of 1 ns and 130 ps, respectively. The experiments clearly show that the T(Dewar)T (orange) is formed via the 130 ps process with an overall quantum yield of 8% and that Dewar formation goes in parallel with the decay of the excited singlet state. At later times (>1 ns) there are signatures for a triplet state (green). The triplet is populated with a significant quantum yield in the range of 2–10% and decays on the 500 ns time scale (for details of the estimate, see supporting data (available from stacks.iop.org/NJP/14/065006/mmedia)). There are no indications that the triplet state is involved in the formation of the Dewar isomer. Further information addressing reaction paths, possible energy barriers and conical intersections will be discussed below using quantum chemical calculations.
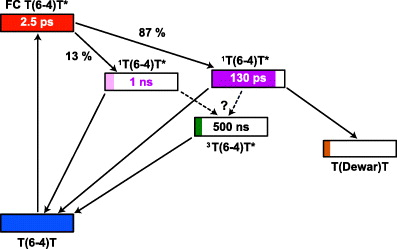
Figure 8. Reaction model for the T(6-4)T lesion after UV excitation derived from experimental results. The lifetimes of the different intermediate states (excited singlet and triplet state) are given in the boxes symbolizing the energy levels. The population of the states is illustrated by the length of the colour bars.
Download figure:
Standard image4. Theoretical results and discussion
The time-resolved measurements reveal multiple excited state decay pathways on the ps–ns time scale summarized in figure 8. In our theoretical studies, we address the different possible excited state deactivation channels, including the photochemical Dewar valence isomerization and photophysical triplet formation. As discussed in detail in [32] and in section 3.4, the Dewar valence isomer T(Dewar)T is formed with an exceptional high quantum yield. Here we focus on the interplay between molecular structure and the branching space topography at decisive conical intersections (CoIn). In detail, we compare the reactive conical intersection CoInDewar with the isolated chromophore 5M2P (CoIn5M2P). In addition, the triplet channel is characterized, and its role in the photoreaction and its signatures in the time-resolved IR spectra are discussed.
4.1. S1 relaxation pathways
4.1.1. Singlet excited state relaxation
The observed excited state lifetime on the 100 ps time scale suggests the existence of an excited state minimum. In figure 9, different areas of the potential energy surfaces involved are shown. The left part displays the four lowest singlet states along a linear interpolated coordinate (LIC) from the Franck–Condon (FC) structure to the S1 minimum. Optical excitation occurs into the lowest ππ* state (S2, green). The excitation energy S0 → S2 of 4.48 eV on the highest-level ONIOM(MS-CASPT2-CAS(12/9):HF) calculation is in good agreement with the experimental value of 3.84 eV. On this level of theory the ππ* state lies between the dark states with nNπ* (red) and nOπ* (brown) character. Relaxation (dashed black arrow) from S2 towards the S1 minimum involves a curve crossing from S2 to S1. Thereby the electronic character of S1 changes from nNπ* in the Franck–Condon region to nOπ* with some amount of ππ* at the S1 minimum. The close succession of electronic states in T(6-4)T* is intriguingly similar to the isolated chromophore 5M2P [61, 62]. The S1 minimum in T(6-4)T has nearly planar structure with butterfly distortions. The right part of figure 9 connects the S1 minimum to the reactive part of the potential energy surface including the conical intersection (CoIn) region along the intrinsic reactive coordinate (IRC). It is calculated on the ONIOM(CAS(12/9):HF level of theory. The S1 minimum is below the CoIn (by 0.4 eV) and the potential energy surface in the excited state is shallow. Nevertheless, the S0/S1 CoInDewar is not barrierless accessible, as indicated in the grey region where the connection between the two parts of the potential energy surface is sketched. The small changes in potential energy along the reaction coordinate support the experimental observation of an excited state decay on the 100 ps time scale.
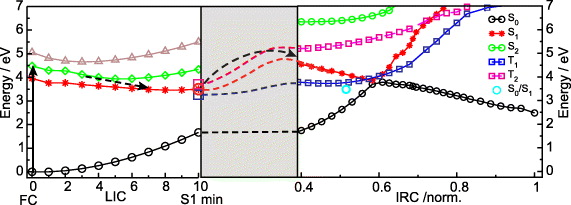
Figure 9. Sketch of the potential energy surfaces leading from the T(6-4)T dinucleotide to the Dewar photolesion. Left: the lowest four singlet states (S0—black; S1—red; S2—green; S3—brown) along the linear interpolated coordinate (LIC) from the Franck–Condon (FC) point to the S1 minimum on ONIOM(MS-CASPT2-CAS(12/9):HF) level of theory (basis: 6-31G*). The relaxation mechanism is indicated by dashed arrows. Right: the three lowest singlet states (S0—black; S1—red; S2—green) and the lowest two triplet states (T1—blue; T2—magenta) along the ground state intrinsic reaction coordinate (IRC) of the Dewar valence isomerization on ONIOM(CAS(12/9):HF) level of theory (basis: 6-31G*). For comparison the S0/S1 conical intersection (cyan circle) is depicted. The grey area indicates the thermally activated barrier crossing required for reaching the conical intersection.
Download figure:
Standard image4.1.2. Reactive conical intersection in T(6-4)T
Conical intersections are known to play a dominant role in many ultrafast photochemical reactions. Their accessibility and topography determine reaction velocity and product yield. In the direct vicinity of a CoIn the potential energy can be expressed as the first order of a Taylor expansion in the two-dimensional-branching space [63] defined by the two vectors x1 (gradient difference) and x2 (derivative coupling) and the coordinates x1 and x2. The topography of the CoIn can be described by [50]

with the parameters
and the gradient sum vector S.
The result of the Taylor expansion leads to the famous double-cone structure of the CoIn. The tilt of the double cone from the vertical axis is given by σxi. Note that Δx1x2 describes the deviation from cylindrical symmetry and dx1x2 characterizes the slope of the cone. A CoIn with perfect cylindrical symmetry (Δx1x2 = 0, σxi = 0) is designated as a peaked CoIn. All other situations lead to a sloped CoIn. The shape of the cone has a strong influence on the branching ratio of the reaction since it controls the initial gradient towards the product channels. A photoexcited system stays only for an ultrashort period in the vicinity of the CoIn. Once the system has reached the CoIn, the transfer to the low-lying state occurs immediately.
We analyse the reactive CoInDewar from which Dewar formation is possible (IRC = 0.57 in figure 9, right). In this context, we compare the topography of CoInDewar in the dinucleotide with that in the isolated 5M2P (CoIn5M2P). The cone parameters of both CoIn are given in table 2. The resulting cones are visualized in figure 10. CoIn5M2P (left) is almost peaked, while CoInDewar (right) is sloped with a stronger tilt from the vertical axis (σxi) and a larger deviation from cylindrical symmetry (Δx1x2). The peaked CoIn topography in 5M2P efficiently mediates a photophysical excited state deactivation as indicated by the yellow arrows. No Dewar valence isomerization occurs. The motions of hydrogen atoms of the 5M2P ring (see the structure in figure 10, left) are free and the lowest energy CoIn5M2P is characterized by a sofa structure [64, 65]. To reach CoIn5M2P a crucial sp2 → sp3 rehybridization at C4 is required and facilitated by the mobility of the hydrogen atoms. The situation changes for the dinucleotide where a strong clamping effect hinders the sp2 → sp3 rehybridization. The sp2 character of the C4 atom is maintained and CoInDewar becomes the lowest accessible nonradiative relaxation funnel. Displacement along the direction of the derivative coupling vector x2 further reduces the N3–C6 distance, which is a prerequisite to form the new Dewar bond. In figure 10 (right), the reactive channel is indicated by the red arrow and the photophysical deactivation by the yellow arrow. In the case of the dinucleotide, the excited state potential surface is shallow with small barriers between the Franck–Condon range and the CoInDewar. Therefore Dewar formation is mainly determined by the gradients at the CoIn. The calculations and the experiments clearly show that the Dewar formation only occurs when the dinucleotides are connected by a backbone. In the studied molecule the backbone was a formacetal linker. Other isosteric linkers as in the DNA backbone are expected to act in the same way.
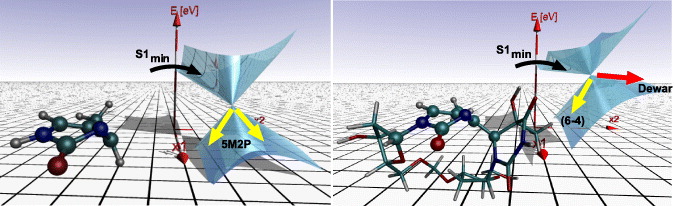
Figure 10. Branching space topography in the conical intersections of the isolated chromophore 5M2P (CoIn5M2P, left) and the T(6-4)T dinucleotide (CoInDewar, right). Photophysical deactivation is indicated by yellow arrows. The reactive channel leading from the T(6-4)T lesion to the Dewar is indicated by the red arrow.
Download figure:
Standard imageTable 2. Cone parameters (in a.u.) characterizing the potential energy surfaces of S0 and S1 in the vicinity of CoInDewar and CoIn5M2P.
| Structure | σx1 | σx2 | Δx1x2 | dx1x2 |
|---|---|---|---|---|
| CoInDewar | −0.574 | −0.915 | −0.240 | 0.104 |
| CoIn5M2P | −0.121 | −0.574 | 0.000 | 0.141 |
4.1.3. The role of triplet states
We calculated the energy of the two lowest triplet states (T1/2) along the IRC (depicted as blue and magenta curves in figure 9). Both triplet states are energetically accessible at the S1 minimum (figure 9, left). In principle T1 could also be accessed at the CoInDewar; however, since CoInDewar is passed ultrarapidly on the femtosecond time scale no efficient intersystem crossing (ISC) occurs. To estimate the probability of ISC, we calculated the singlet–triplet (S1 → T1/2) spin–orbit coupling matrix elements (SOCME) along the IRC reaction coordinate and at the S1 minimum geometry (see the supplementary data, available from stacks.iop.org/NJP/14/065006/mmedia). The strongest ISC occurs at the S1 minimum with a |SOCME| to the T1 of 35 cm−1. SOCME in the same order of magnitude with calculated ISC rates of the order of 109–1011 s−1 have been reported [66, 67]. The experimentally found low triplet yield (2–10%, see above) points to an ISC rate in T(6-4)T of the order of 109 s−1. We conclude that the ISC takes place from the S1 minimum. On the triplet surface, further relaxation to the T1 minimum takes place (coordinate not shown) from where the CoInDewar is out of reach. Therefore the ISC path contributes only to photophysical deactivation. This explains the experimental finding that no Dewar formation is observed with the decay of the triplet state.
4.2. Spectral signatures in the IR
Further support for the participation of the triplet channel in the photophysical deactivation of T(6-4)T* can be inferred from the comparison of experimental and simulated IR spectra shown in figure 6. The IR absorption of T(6-4)T ground state (red lines in figures 6(a) and (c)) shows three strong C = O bands in the 1650–1730 cm−1 frequency region. The three C = O stretch vibrations are strongly coupled. Accordingly, the displacement of the three carbonyl groups is correlated. The lowest energy normal mode at ν = 1668 cm−1 arises from an anti-symmetric linear combination of two carbonyl groups, the pyrimidinone C = O, as well as one C = O of the adjacent thymidilyl ring. The third C = O stretch vibration (located on the thymidilyl ring) has negligible displacement contributions. The mode at ν = 1682 cm−1 is composed of a symmetric linear combination of all three carbonyl groups and carries the highest intensity. The mode at ν = 1713 cm−1 shows the weakest intensity and arises mainly from the two thymidilyl carbonyl groups, the C = O group of the pyrimidinone chromophore contributes only weakly. Compared to the experimental steady-state IR spectrum (red line in figure 6(a)) we find excellent agreement in the intensity pattern of all three normal modes. Note the blue shift of the low-frequency bands (<1750 cm−1) by 20 cm−1 in the calculated spectrum.
In T(Dewar)T the modified chemical environment of the Dewar C = O group leads to a pronounced shift (87 cm−1) towards higher frequencies (ν = 1775 cm−1, black line in figure 6(c)). The now localized Dewar C = O mode serves as a unique probe for the kinetic and quantum yield of the valence isomerization reaction [32] (section 3.1.5). The two remaining carbonyl groups, located on the thymidilyl ring, show up as symmetric (ν = 1714 cm−1) and anti-symmetric (ν = 1683 cm−1) C = O stretch modes. As the Dewar C = O mode decouples from the thymidilyl C = O modes the IR absorption in the low-energy region is reduced.
Additionally, we depict the calculated IR spectrum of the triplet T1 of the T(6-4)T lesion (green line in figure 6(c)). The spin density is predominantly localized on the pyrimidinone entity, with an unpaired electron occupying the lowest anti-bonding orbital with C = O* character. As a consequence, the pyrimidinone carbonyl bond is elongated from 1.23 to 1.71 Å. The weakend C = O bond shifts to 1537 cm−1 (data not shown). Similar shifts upon triplet formation have been found by Hare and coworkers for thymine and thymidine in acetonitrile [68]. The two C = O modes of the thymidilyl entity are slightly red-shifted (Δν = 8 cm−1; symmetric C = O stretch: ν = 1706 cm−1; asymmetric: ν = 1674 cm−1).
Simulated IR difference spectra for the T(6-4)T to T(Dewar)T and triplet conversion are depicted in figure 6(d). We consider three limiting cases. The black line represents the exclusive Dewar formation. The green line represents the exclusive triplet formation. The blue line represents equal amounts of Dewar and triplet formation. Although the IR spectra of triplet and Dewar are similar, the C = O region between 1650 and 1700 cm−1 of the difference spectra can be used to identify a triplet state contribution. The major influence of a triplet state is seen at about 1685 cm−1. At about 1665 cm−1 smaller changes are expected. Comparison with the time-resolved IR data on the ns time scale (figure 7(c)) reveals a similar pattern as expected with the shift by −20 cm−1 (discussed above). While Dewar concentration is not affected between 2 ns and 10 μs (see figure 7(c), the marker band at ν = 1780 cm−1 stays practically constant) the observed pattern points to the decrease of triplet concentration in this time range.
4.3. Isomers of T(Dewar)T
From the calculations we could identify two rotational conformers of the T(6-4)T lesion which can be connected to four different T(Dewar)T isomers. They differ by the relative position of the newly formed Dewar bond (see the supplementary data (figure S3), available from stacks.iop.org/NJP/14/065006/mmedia) and the respective rotation of the former pyrimidone unit around the 6-4 σ-bond. Related structures have been proposed in the literature based on x-ray and NMR measurements [12, 69]. The Dewar isomers differ in their free reaction energies and exhibit small changes in their calculated IR spectra (see the supplementary data (figure S4)). The small variations in the reactant free energy differences (ΔG = 0.05 eV) suggest that different local minima are excited by light absorption. They may be responsible for the occurrence of side reactions. It is expected that not all side reactions have the same probability for Dewar formation or internal conversion. This can explain the experimental observation of two fluorescing states with different decay times (see figure 8).
5. Conclusions
With time-resolved spectroscopy—emission and absorption techniques—and quantum chemical modelling, we studied the photophysical and photochemical processes during the formation of the UV-induced DNA Dewar lesion from the T(6-4)T dimer and found a conclusive picture of the reaction process. UV absorption into the Franck–Condon region initiates a rapid (2.5 ps) relaxation to the S1 minimum. Two time constants have been found in the decay of the excited electronic S1 state. The 100 ps process could be assigned to Dewar formation and internal conversion originating from the same conical intersection. The slower 1 ns decay is interpreted as a side reaction originating from a local minimum on the excited state potential surface tentatively attributed to an isomer. The different temperature dependence, i.e. the different activation barriers obtained for the two decay processes, supports this interpretation. On the time scale of 500 ns, we observe the decay of a weakly (2–10%) populated triplet state. The reaction path including the triplet states was investigated by quantum chemical modelling using the hybrid partitioning ONIOM approach on the CASSCF/CASPT2 level of theory. We could show that the backbone connecting the two heterocycles of T(6-4)T is a prerequisite for Dewar formation. Only if the backbone is closed, is the Dewar isomer formed with significant yield. Theory reveals that the tension induced by the backbone is mirrored in the topography at the conical intersection and guides the reaction to the Dewar isomer. Only singlet states are involved in Dewar formation. The triplet is mostly populated via the S1 minimum and is not relevant for Dewar formation. The combination of experiment and theory leads to the understanding of a highly relevant DNA photolesion at a molecular level and adds a new facet to the role of the DNA double helix. Primarily, the DNA backbone is necessary to keep the information encoded in a serial structure, but also its influence on DNA photostability has to be considered. In the case of the CPD photolesion the intact structure of the DNA double helix keeps adjacent pyrimidine bases well separated to avoid CPD formation. The Dewar isomer is the first example where the backbone itself induces lesion formation.
Acknowledgments
This work was supported by the DFG through the Sonderforschungsbereich 'Dynamics and intermediates of molecular transformations' (SFB 749), the Cluster of Excellence 'Munich Center for Advanced Photonics' (MAP) and the project GI349/5-1. The authors thank Bert M Pilles for supporting the IR experiments and the Leibnitz-Rechenzentrum der Bayrischen Akademie der Wissenschaften (LRZ) for the allocation of computing time.