
Abstract
Understanding of the mechanisms of neural phase transitions is crucial for clarifying cognitive processes in the brain. We investigate a neural oscillator that undergoes different bifurcation transitions from the big saddle homoclinic orbit type to the saddle node on an invariant circle type, and the saddle node on an invariant circle type to the small saddle homoclinic orbit type. The bifurcation transitions are accompanied by an increase in thermodynamic temperature that affects the voltage-gated ion channel in the neural oscillator. We show that nonlinear and thermodynamical mechanisms are responsible for different switches of the frequency in the neural oscillator. We report a dynamical role of the phase response curve in switches of the frequency, in terms of slopes of frequency-temperature curve at each bifurcation transition. Adopting the transition state theory of voltage-gated ion channel dynamics, we confirm that switches of the frequency occur in the first-order phase transition temperature states and exhibit different features of their potential energy derivatives in the ion channel. Each bifurcation transition also creates a discontinuity in the Arrhenius plot used to compute the time constant of the ion channel.
Export citation and abstract BibTeX RIS
Phase transitions are important physical phenomena. A typical example is the transition between the ferromagnetic and paramagnetic phases of magnetic materials at the Curie point. In this study, we consider phase transitions in neural information processing in the brain, whereby neural activity transits to another neural activity in the network. Understanding of neural phase transition mechanisms is important for clarifying cognitive functions, such as perception and learning, in humans and higher animals, since cognitive functions largely depend on transitions of neural activity in the brain.[1–3]
To reveal mechanisms of cognitive functions, we must investigate phase transitions found in single neurons at the membrane potential level. Mathematical analysis of the neural network has shown that the transition from slow wave sleep to rapid eye movement sleep is induced by the switching of stabilities of equilibria established in the saddle node on an invariant circle (SNIC) bifurcation.[4] Similarly, a physiological experiment has found that transient neural activities, such as membrane potential fluctuations in single neurons, induce phase transitions in the neural networks with several synchronous states.[5]
A mathematical aspect of phase transitions in single neuron models appears to be less clearly understood, although the physiological aspect has been well characterized. Chiu et al.[6] found transition temperatures (i.e., breaks in the Arrhenius plot) for sodium conductance and the time constant of sodium inactivation in rabbits. Schwarz[7] demonstrated that various kinetic parameters of sodium permeability in frog nerve and muscle fibers undergo temperature-induced phase transitions at low temperature. These results are consistent with the hypothesis that temperature-dependent phase transitions found in the membrane lipids.
At the phase transition temperature, single-ion channels in the artificial membranes of unmodified lipid bilayers undergo sudden and dramatic increases in ionic permeability.[8] This finding implies that ion-specific channel phase transitions, rather than lipid phase transitions, are responsible for the sudden and dramatic increase in ionic permeability. Thus phase transitions in the voltage-gated ion channels of single neurons require further investigation and clarification.
In this Letter, we reveal that both nonlinear and thermodynamic mechanisms affect the voltage-gated ion channel dynamics in the Morris–Lecar (ML) model.[9] These mechanisms are responsible for two types of switches of frequency at different thermodynamic temperatures (Fig. 1(a)). Specifically, the ML neuron model undergoes different transitions of the bifurcation from the big saddle-homoclinic orbit (BSHCO) type to the SNIC and from the SNIC type to small SHCO (SSHCO) type. In particular, we analyze the temperature-dependent frequency immediately after a saddle-node (SN) equilibrium has disappeared with an increase in the input current (Fig. 1(b)). Let us note that in the BSHCO and SSHCO bifurcations, the SN equilibrium exists inside and outside the limit cycle (LC) attractor, respectively, before disappearing.[10]
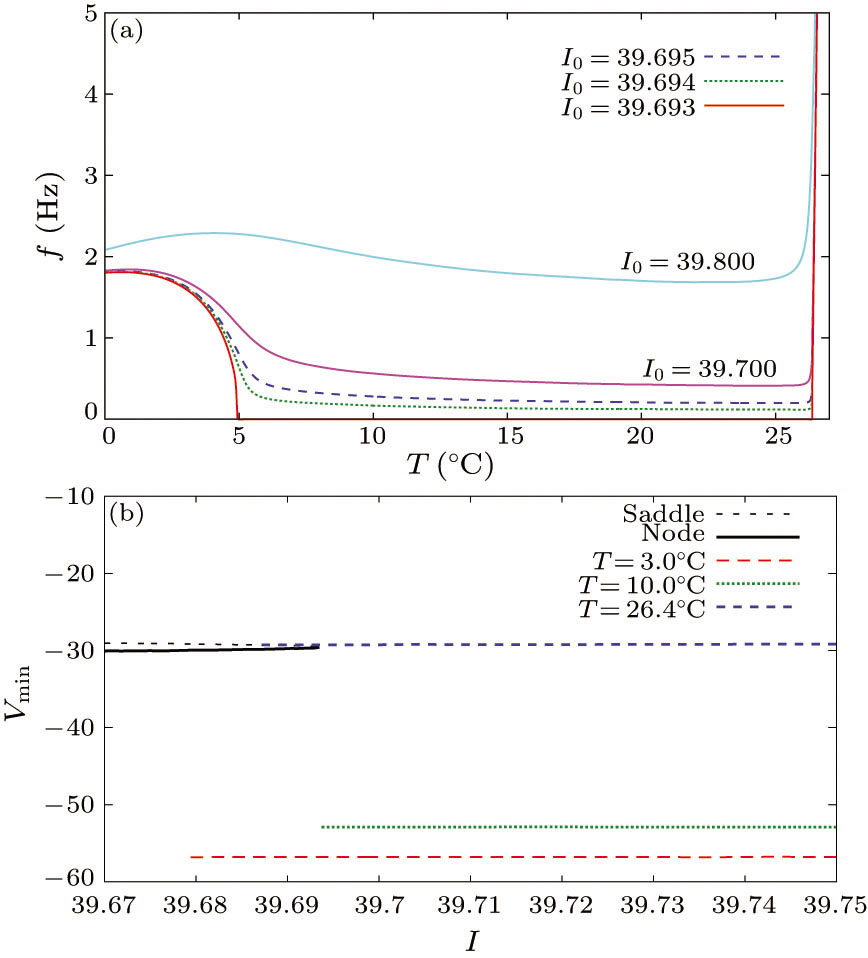
Fig. 1. Changes in the frequency-temperature (f–T) curve (a) and bifurcation characteristics (b) in the ML model evolved by Eq. (1). (a) f is plotted as a function of T for different values of the input current I0. (b) Bifurcation diagrams at each temperature show the membrane potential (V (mV)) at the fixed points (the black dashed and solid lines) and at the minimum of a limit cycle (LC) (the colored lines) as I0 increases. The red, green and blue lines at T = 3○C, 10○C and 26.4○C represent BSHCO, SNIC and SSHCO, respectively.
Download figure:
Standard imageWe now describe the ML model, defined as
where Iion(V, W) = −gL (V − VL) − gKW(V − VK) − gCam∞(V) (V − VCa), m∞(V) = (1 + tanh [(V − V1)/V2])/2, w∞(V) = (1 + tanh [(V − V3)/V4])/2, τw(V) = 1/(ϕcosh[(V − V3)/(2V4)]), x ∈ (V, W), V (mV) and W represent the membrane potential and the gating variable of the K+ channel, respectively, Cm is the membrane capacity, I0 is the constant input current, VCa, VK and VL denote the equilibrium potentials of Ca2+, K+ and the leak currents, respectively, gCa, gK and gL are the maximum conductances of the corresponding ionic currents, and m∞(V) denotes the calcium channel permeability PCa ∝ m∞(V).[11] In transition state theory,[12] the V-term in the hyperbolic tangent function of m∞(V) represents the potential energy difference ΔHm(V) when the membrane potential is V. More precisely, m∞(V) = [exp((V − V1)/V2)/(exp((V − V1)/V2) + exp(−(V − V1)/V2))] = [k+2(V)/(k+2(V) + k−2(V))], where k+2 and k−2 are the reaction coefficients of the closed-to-open and open-to-closed transition states, respectively, V1 is the potential energy difference between the open (or closed) state and the transition state at V = 0 in the Ca2+ channel kinetics, V2 is an assumed constant, although in a thermodynamic interpretation at temperature T, it represents the Boltzmann constant (as explained in detail in the following). A similar thermodynamic interpretation is applied to w∞(V) and τw(V). For τw(V), and ϕ implicitly involves the thermodynamic variables of temperature and entropy, although we here set ϕ as a constant. The potential energy difference in the K+ channel is denoted by ΔHw(V), where V3 is the potential energy difference between the open (or closed) state and the transition state at V = 0. These kinetics depend on the temperature through the relationship  in Eq. (1) where Q10 = 3,[13] and T is the temperature influencing the voltage-gated channel dynamics. Let Tc = 0○C be the environmental temperature of the physiological experiment. Thus we assume that the transition states of the channel dynamics vary under constant pressure and volume conditions at T = Tc, according to
 ![$[{\tau }_{{\rm{w}}}(T+10)/{\tau }_{{\rm{w}}}(T)]={Q}_{10}^{(T-{T}_{{\rm{c}}})/10}$](https://content.cld.iop.org/journals/0256-307X/35/5/058702/revision1/cpl_35_5_058702_ieqn2.gif) .
.
In this work, the parameters are set as Cm = 20 μF/cm2, VK = −80 mV, VL = −60 mV, VCa = 120 mV, gL = 2 μS/cm2, gK = 8 μS/cm2, gCa = 4 μS/cm2, V1 = −1.2, V2 = 18, V3 = 12 and V4 = 17.4.[9] Such a parameter setting establishes a nonlinear dynamical mechanism in which the SNIC (at T = 10○C), BSHCO (at T = 3○C) and SSHCO (at T = 26.4○C) bifurcations occur by an upward shift of the cubic V-nullcline as I0 (μA/cm2) increases (Fig. 1(b)). We observe that as I0 passes a critical value Isn ~ 39.6935 μA/cm2, a transition occurs from quiescence to repetitive firing. We also observe two different types of switches of the frequency at different temperatures. Around T = 5○C, the frequency drastically decreases to its low or 0. At T = 26.4○C, it undergoes a sudden and drastic increase (Fig. 1(a)).
To analyze how each bifurcation transition affects its relevant frequency switch, we compute the first derivatives with respect to T, which relate to the phase response curve (PRC). The PRC is widely used in neuroscience to characterize firing dynamics in the neuron. Introducing a small perturbation  G(x) = (0, γμFW(x)ΔT) ( ≪ 1) into Eq. (1), we obtain
where γ = [log(Q10)/10]. We now define a small perturbation in the phase direction on the periodic orbit xp(t) as q(ts), where ts = t is a slow time, xp(t) is a stable Tp-periodic solution for the unperturbed dynamics, [dxp/dt] = F(xp) with xp (t + Tp) = xp(t) for all t. Let us consider the vector Z(t) = (ZV(t), ZW(t)) called the adjoint solution to the following linearization around the Tp-periodic solution xp(t): [dZ/dt] = −[Dx
F(xp)]trZ, where DxF represents the Jacobian matrix of F, and the superscript tr indicates the transpose of a matrix, and Z, frequently regarded as the PRC, is assumed to be normalized by infinitesimal pulsed perturbations.[14] However, in this study, we denote the PRC by ZV for convenience. We thus find a differential equation that governs the time evolution of q. Averaging the differential equation over the period Tp, we obtain the following evolution equation for q
Introducing a phase variable θ = [(t + q(ts))/Tp] with θ ∈ [0, 1) and defining the new firing rate as [dθ/dt] = f(T0 + ΔT),[14] Eq. (3) becomes
where  ,
,  , f = f(T0) = [1/Tp], and
 ![$\langle {Z}_{W}{F}_{W}\rangle =[1/{T}_{{\rm{p}}}]\displaystyle {\int }_{0}^{1}{Z}_{W}{F}_{W}d{\theta }^{^{\prime} }$](https://content.cld.iop.org/journals/0256-307X/35/5/058702/revision1/cpl_35_5_058702_ieqn5.gif) . The new frequency is straightforwardly expanded in ΔT as follows:
. The new frequency is straightforwardly expanded in ΔT as follows:
From Eqs. (4) and (5), we obtain the relationships
where  and
and  . In Eq. (6), we used Z(t) · F(xp(t)) = 1 for any t according to Ref. [14]. Therefore, we have found that the derivative of the firing rate with respect to temperature is represented as a function relating to the PRC.
First, let us calculate γ⟨ZW[dW/dt]⟩ (corresponding to [df/dT]), where ||[df/dT] − γ⟨ZW[dW/dt]⟩|| = O(10−1). This calculation elucidates the effects of the PRC on the slope of the firing rate-temperature curve. In Fig. 2(a), the SN equilibrium remains at I0 = 39.693. The slope of the frequency with respect to T (γ⟨ZW [dW/dt]⟩) diverges to the negative infinity as T approaches the transition temperature of the BSHCO to SNIC, after which it discontinuously resets to 0. Meanwhile, in the SNIC to SSHCO bifurcation transition, the slope of the frequency with respect to T discontinuously changes from 0 to some positive value. Following the disappearance of the SN equilibrium, γ⟨ZW[dW/dt]⟩ (> 0 around T = 0○C) develops a negative valley at the BSHCO to SNIC bifurcation transition and returns to positive in the temperature range of the SSHCO bifurcation. These results indicate a conspicuous difference between dynamical properties at the bifurcation transitions from BSHCO to SNIC and from SNIC to SSHCO.
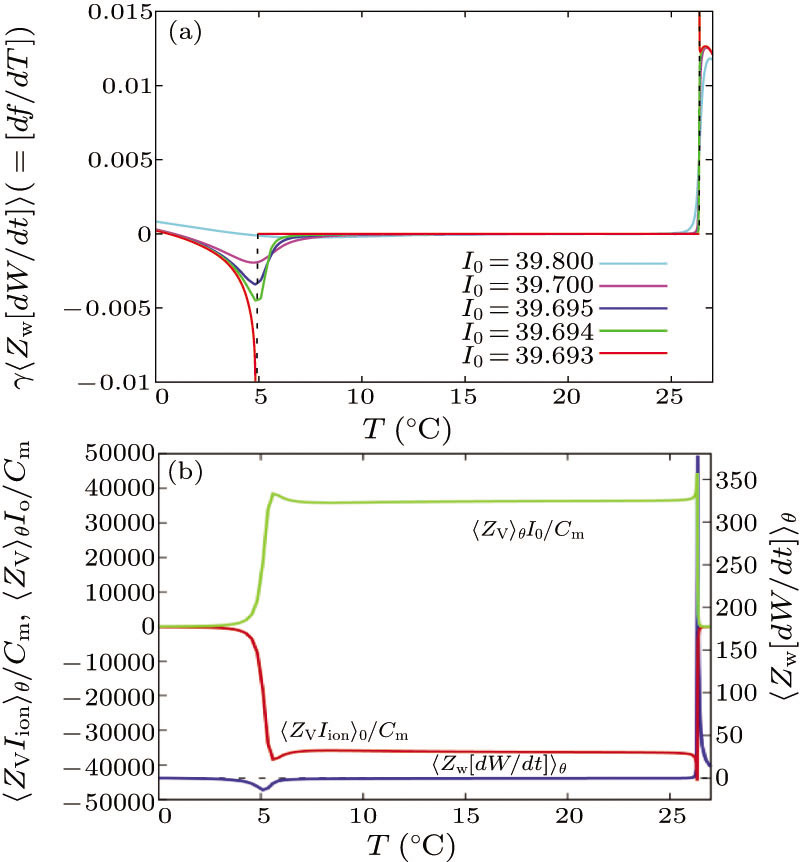
Fig. 2. Calculations of the slope of the firing rate with respect to temperature: (a) γ⟨ZW[dW/dt]⟩–T plots for different values of I0, and (b) curves of [⟨ZV Iion⟩θ/Cm]−T (the red line), [⟨ZV⟩θI0/Cm]−T (the green line) and ⟨ZW[dW/dt]⟩θ−T (the blue line) drawn for I0 = 39.694. The black dashed lines represent ⟨ZW[dW/dt]⟩θ = 1.
Download figure:
Standard imageWe now show how this conspicuous difference arises by evaluating Eq. (6) (Fig. 2(b)). In the high temperature domain (T > 26.4○C) of the SSHCO bifurcation, ⟨ZW[dW/dt]⟩θ > 0, because [⟨ZV⟩θI0/Cm] > [⟨ZV Iion⟩θ/Cm]. By contrast, in the temperature domain of the SNIC and BSHCO bifurcations, [⟨ZV⟩θI0/Cm] < [⟨ZV Iion⟩θ/Cm] and ⟨ZW[dW/dt]⟩θ can be negative. In fact, the PRC in the SSHCO and SNIC bifurcations develop different shapes, as reported in Ref. [15]. Furthermore, the PRC in SSHCO is larger by O(101) than in the SNIC bifurcation. Such differences between the PRC shapes and sizes in the SNIC and SSHCO bifurcations cause γ⟨ZW[dW/dt]⟩ to switch from positive values to negative values and vice versa.
For a thermodynamic interpretation of the bifurcation transitions, let us compute τw(V) and m∞(V). For τw(V), we observe two breaks in the Arrhenius plot of  (
( ), occurring at different transition temperatures (Fig. 3(a)). However, in the ⟨τw⟩ plot, no break appeared (data not shown). This indicates that the size of τw, not the average τw over one period, is responsible for obtaining two different discontinuities in the Arrhenius plot.
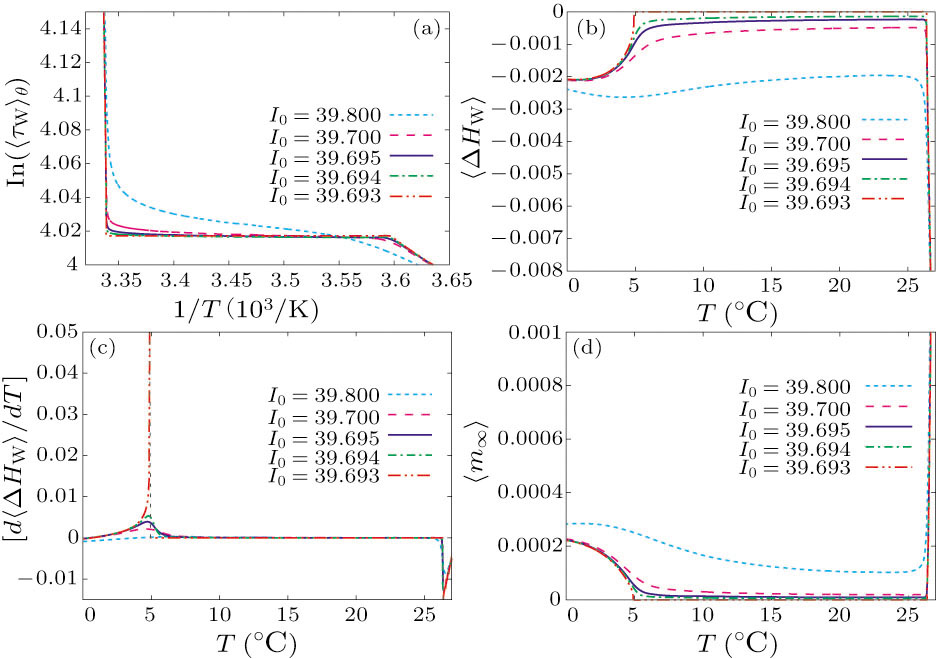
Fig. 3. The τw(V)−T and m∞(V)–T curves calculated for different values of I0: (a) Arrhenius plots for ⟨τw⟩θ, (b) ⟨ΔHw⟩−T curves, and (c) [d⟨ΔHw⟩/dT]−T. Two dashed lines at each transition temperature indicate the discontinuities in [d⟨ΔHw⟩/dT]. (d) The value of ⟨m∞⟩ plotted as a function of T.
Download figure:
Standard imageWe also plotted the potential energies ΔHw versus temperature. Along the horizontal axis of Fig. 3(b), the ⟨ΔHw⟩−T curves are almost symmetric to the f−T curves. At I0 = 39.693, the potential energy reaches the thermodynamic equilibrium through the first bifurcation transition, followed by a drastic decline as T increases further. At each bifurcation transition, we have identified different discontinuities in the first derivative of the potential energy with respect to temperature. At I0 = 39.693, [d⟨ΔHw⟩/dT] switches from +∞ to 0 through the bifurcation transition from BSHCO to SNIC. Furthermore, it rapidly ascends from −∞ following the second bifurcation transition, i.e., from SNIC to SSHCO.
To gain further insights, we now numerically calculate ⟨m∞⟩. At I0 = 39.693, as T increases, ⟨m∞⟩ is reset to 0 at the BSHCO to SNIC bifurcation transition, followed by a rapid positive increase following the SNIC to SSHCO bifurcation transition. The shape of this curve is similar to that of the f–T relation (Fig. 3(d)), and reveals breaks in permeability at the phase transition temperature of the corresponding bifurcation transition. The first derivative of ⟨m∞⟩ with respect to T reveals different discontinuities at different bifurcation transitions, similar to those of Fig. 2(a). To verify that these discontinuities represent first-order phase transitions, we calculated the average of the potential energy term in m∞, ⟨ΔHm⟩ (results not shown). Similar to Figs. 3(b) and 3(c), [d⟨ΔHm⟩/dT] developed discontinuities at different bifurcation transitions. Therefore, we infer that these two frequency switches, at which different bifurcation transitions occur, are the first-order phase transition temperatures.
We have largely neglected the important roles of bifurcation transitions in characterizing neuronal activity, because various types of bifurcations have been understood by analyzing the stabilities of the equilibria in the system. For instance, in a modified version of the Hodgkin–Hulxey (HH) model, a SHCO bifurcation of the SN equilibrium was found to be embedded in a chaotic attractor.[16] Nevertheless, it remains unclear why the SHCO bifurcation causes the intervals between spikes to expand. Although the original HH model is employed for schematically analyzing different types of bifurcations, its intrinsic parameters[17,18] do not have to be subjected to a rigorous thermodynamic interpretation. In this work, we have suggested that the two different bifurcation transitions of the BSHCO to SNIC and SNIC to SSHCO are related to first-order phase transition phenomena at the level of the voltage-gated channel dynamics.
As mentioned above, the equilibrium state of the calcium channel in Eq. (1) largely depends on the ion permeability of the membrane. Figure 3(d) displays sudden and drastic decrease and increase of the permeability at T = 5○C and 26.4○C, respectively. The drastic increase in the ion permeability is consistent with a previously reported result, which relates the appearance of a single-ion channel to the dramatic increase in its relevant ion permeability at the phase transition temperature of unmodified lipid bilayer membranes.[8] To account for the additional phase transition in the membrane lipids, a nonlinear term expressing the lipid domain interaction can be inserted into the potential energy term of the transition state. This term is expected to reasonably explain the hysteresis caused by lipid phase transitions. However, in the present study, we have found that nonlinear dynamical characteristics, particularly bifurcation transitions, significantly influence the potential energies of the voltage-gated channels in the ML model, regardless of lipid phase transitions.
In conclusion, we have confirmed that frequency switches found in the ML system, where the bifurcation transitions occur from BSHCO to SNIC and from SNIC to SSHCO as the temperature increases, represent different first-order phase transition phenomena. The nonlinear and thermodynamic characteristics of the two phase transitions are markedly different. In the BSHCO to SNIC bifurcation transition, the potential energy reaches thermodynamic equilibrium (ΔHw = 0 or ΔHm = 0) as the temperature increases. The first derivatives of the potential energy diverge towards +∞ immediately before this transition. Regarding the nonlinear dynamics, the slopes of the firing rate with respect to temperature can predominantly be composed of ⟨ZV Iion⟩θ rather than ⟨ZV⟩θ. On the other hand, in the SNIC to SSHCO bifurcation transition, both the potential energies and their first derivatives drop towards −∞ immediately following the transition. Interestingly, ⟨ZV⟩θ, rather than ⟨ZV Iion⟩θ, determines [df/dT]. Thus we have identified two first-order phase transition temperatures, at which transitions are induced by potential energy changes in biophysical channel systems, independent of lipid phase transitions.
We thank K. Aihara at the University of Tokyo for the useful comments.
Footnotes
- *
Supported by JST, CREST, and JSPS KAKENHI under Grant No 15H05919.