
Abstract
This work demonstrates accurate measurement of the amount of substance concentration of low concentration plasmid DNA by counting individual DNA molecules using a high-sensitivity flow cytometric setup. Plasmid DNA is a widely used form of DNA, and its quantity often needs to be accurately determined. This work establishes a reference analytical method for direct quantification of low concentration plasmid DNA prepared as reference standards for polymerase chain reaction-based DNA quantification. The model plasmid DNA pBR322 (4361 bp) was stained with a fluorescent dye and was detected in a flow stream in a micro-fluidic channel with laser-induced fluorescence detection, for which the DNA flow was electro-hydrodynamically focused at the centre of the channel. 200 to 8000 DNA molecules in a ∼1 µL sample volume were counted within 2 min in an 'exhaustive counting' manner, which facilitated quantitation without calibration. The sample volume was measured and validated from the close agreement of the results of two independent measurement methods, gravimetric determination of water filling the capillary and graphical estimation of actual cross sectional area of the capillary tubing with the image of calibrated scanning electron microscopy. Within the given concentration range, an excellent measurement linearity (R2 = 0.999) was achieved with appropriate data processing for the correction of the events of double molecules (detection of double molecules opposed to single molecule detection assumed, which occurs due to their coincidental passing of the detection zone). The validity of the proposed method was confirmed from the close agreement with the results of quantitation of enzymatically released nucleotides using capillary electrophoresis.
Export citation and abstract BibTeX RIS

Content from this work may be used under the terms of the Creative Commons Attribution 3.0 licence. Any further distribution of this work must maintain attribution to the author(s) and the title of the work, journal citation and DOI.
1. Introduction
Major biological entities such as nucleic acids, proteins and cells are challenging quantification targets due to their complex chemical compositions. In the case of nucleic acids, technical challenges become more demanding when a trace amount of DNA molecules needs to be accurately quantified. DNA, a carrier of genetic information, often functions in a trace amount, even with a single copy. Conventional analytical methods developed for the quantification of DNA are not applicable to low levels of DNA. For example, the quantification limit of ultraviolet (UV) absorption (optical density; OD) measurements is about 0.01 OD for about 0.5 µg mL−1 of double stranded DNA (www.epa.gov/ttnamti1/files/ambient/pm25/spec/DRISOPOpticalDensity.pdf).
Fluorescence measurements substantially extend the measurable concentration range down to but not lower than 10 ng mL−1 [1]. As an only exception, polymerase chain reaction (PCR)-based [2] measurement methods can detect even a single copy of DNA on account of its billion-fold amplification capability [3]. However, the degree of amplification is apt to vary according to various experimental parameters [4]. Thus, the accuracy of PCR-based DNA quantification is not automatically granted. Its extraordinary sensitivity excels in analytical terms only if a reliable calibration standard is available, which is also true for fluorescence measurements.
There have been noticeable efforts to provide accurate calibration standards for DNA quantification. For accurate determination of such calibration standards, newer approaches for DNA quantification such as inductively coupled plasma–optical emission spectrometry (ICP-OES) measurements of phosphorus [5–7] and capillary electrophoresis (CE) [8] or liquid chromatography–isotope dilution mass spectrometry (LC-IDMS) [9, 10] measurements of nucleotides or nucleosides, as well as quantitative-nuclear magnetic resonance (q-NMR) spectroscopy [11] have been employed. Unfortunately, however, the sensitivities of those methods are far too low to determine low levels of DNA. For lower-level calibration materials, the original DNA preparation determined by such analytical methods needs to be accurately diluted. Using dilution factors, the final concentrations of the diluted material should be assumed. However, such a cascade-dilution strategy can be accepted only after substantial evidence has been gathered using a direct measurement method.
There have been newer approaches that may work for low-level DNA analyses. These methods are based on enumeration, the counting of individual DNA copies. The counting strategy is unique as it does not, in principle, require calibration standards (see equation (1)). Therefore, such enumeration is regarded as 'absolute quantification'. The merits of enumeration in quantification are described in detail elsewhere [12].

where C is the molarity of the counted DNA, NC is the number of counted molecules, NA is Avogadro's number and V is the sample volume.
One approach for enumeration of target DNA copies is 'digital PCR', which is referred to as d-PCR [13, 14]. In this approach, DNA samples are sufficiently diluted such that they have one or zero templates of DNA in a given unit volume of the sample. Then, the single DNA copies in each unit volume are amplified by PCR to levels where amplification is easily confirmed from a large amount of DNA amplicons. The population of the positively amplified unit volumes over the total number of unit volumes with regard to the dilution factor will lead to a mathematical prediction of the concentration of the target DNA in the original sample, which includes Poissonian statistics. This approach has gained popularity, and numerous interesting applications have been revealed [14]. The unit sample volumes can be produced by micro-well structures on plastic plates or even from aqueous bubbles produced in an oil medium (droplet PCR) [15, 16]. Unfortunately, however, such PCR-based enumeration does not always result in 100% success in single copy-PCR amplification. For example, Sanders et al have reported variations in d-PCR results that are dependent on target template types as well as disagreement with the amount predicted by UV spectrophotometry [17]. In addition, Burke et al recently demonstrated that a PCR reagent itself could be contaminated with template DNA, which would lead to overestimation of the quantity of target DNA [18]. Therefore, accurate d-PCR may not be readily achievable. Validation or calibration of d-PCR using a reliable reference standard may still be necessary for ensuring the accuracy of the assay.
Another approach of enumeration-based quantitation of DNA is directly counting the individual target DNA, where fluorescently labelled DNA molecules are counted one by one in a flow stream [19]. Direct counting does not involve PCR. The measurement principle is simple and straightforward. Therefore, more reliable results can be expected from direct counting. Flow cytometric counting of individual DNA fragments was pioneered by a research team at Los Alamos National Laboratory [20, 21]. However, this team's interest more likely was directed towards the analysis of DNA fragmentation patterns for the identification of microorganisms. Recently, flow cytometric quantification DNA has been reported by other teams [22, 23]. However, such reports were rather brief, as opposed to systematic investigations. A systematic investigation of the analytical performance of count-based quantitation of DNA as a reference analytical method was first reported by Yim et al [19], where lambda phage genomic DNA (48 502 bps) was counted as model DNA. A simple flow system with a piece of capillary tubing was used and the stream of DNA particles was tightly confined to the centre of the flow cross section via an electro-hydrodynamic focusing technique [22]. This method enabled laser-induced fluorescence (LIF) detection of DNA particles with a tightly focused laser light beam. With a sensitive avalanche photodiode detector (APD), fluorescence emission from individual DNA particles was detected even with a short exposure time (∼3 ms). Therefore, quantification was completed in a convenient and rapid manner. In addition, the size of DNA particles was elucidated by the fluorescent intensities [19, 24].
Although the direct counting strategy turned out to be feasible for the genomic DNA of the lambda phage virus, the system needs to work with substantially smaller DNA samples such as plasmid DNA. Plasmid DNA is abundant and widely used, mostly as gene-carrying vectors, and their sizes are in the range 1 kbp to 10 kbp. With smaller DNA molecules, the performance of the direct counting method degrades in two aspects: (1) the degree of focusing of the stream of DNA molecules and (2) the signal-to-noise ratio of the LIF detection. The lateral dispersion of the DNA stream from the detection spot was obvious with the decrease in the size of DNA particles in our preliminary experiments. Such dispersed trajectories of DNA particles would lead to widespread histograms that would cause trouble in signal gating. Smaller DNA particles with a smaller number of intercalated dyes would produce weaker fluorescence signals in an almost linear fashion [24], which would raise the problem of poor signal-to-noise for small plasmid DNA. Therefore, the performance of the measurement system needed to be substantially improved in both fluidic control and detection sensitivity. In this work, we optimized and improved the performance of our homemade instrumentation for successful count-based quantification of a model plasmid DNA, pBR322 (4361 bp). In addition, the validity of the measurement was confirmed by comparison with the result of the capillary electrophoresis-deoxynucleoside monophosphate (CE-dNMP) analysis of concentrated pBR322.
2. Experiment
2.1. Instrumentation
Fluidics. A piece of ∼1 m long square-form fused silica tubing (50 µm × 50 µm i.d.; 375 µm × 375 µm o.d.: WWP050375; Polymicro Technologies, Phoenix, AZ) was used as the fluidic channel. The DNA stream was focused on the centre axis of the fluidic channel by applying 0.07 MPa, whereas 20 kV was applied across the capillary. An electroosmotic flow directed against the hydrodynamic flow was accordingly established. If a different pressure or voltage was applied, the change is described in the text. The fluidic channel also served as a sample cell. The entire capillary volume was filled with a sample solution and then counting was started by pushing the sample solution with a blank buffer until the sample solution was completely pushed out. The sample volume was the volume of the capillary from the injection end to the detection window. All DNA molecules in the sample volume were counted as they passed the detection window ('exhaustive counting'). The detection window was implemented ∼60 cm away from the injection end of a ∼1 m long capillary tube. The schematic description of the fluidic arrangement is shown in the online supplementary figure S-1 (stacks.iop.org/Met/51/491/mmedia).
Detection. Sybr-Gold dye (S-11494; Molecular Probes, Eugene, OR)-stained DNA molecules were detected by LIF. A water-cooled argon ion laser (Model 95; Lexel Laser, Fremont, CA) was initially used but was replaced with a diode laser (Spectra-Physics Cyan™ 488; Newport Co. Irvine, CA) for a 488 nm laser beam with a ∼150 mW output. A laser-beam stabilizer (Compact model; MRC Systems, Heidelberg, Germany) was implemented just after the laser source (figure 1). The stabilized laser beam was then expanded using a Keplerian beam expander to be delivered to the back aperture of a 4× objective lens. The objective lens was placed on a micro-translation stage to adjust the relative position of the focal volume, by which the size of the effective excitation volume was precisely adjusted. The lateral beam diameter at the detection point was typically set to ∼20 µm. The fused silica tubing of the flow channel was held vertically to expose the flow channel normal to the incident laser beam. The emitted fluorescence light was collected at the normal angle to the incident beam using a 60× objective lens. A flip-mirror was placed to switch the direction of the fluorescent light either to a charge-coupled device (CCD) camera (Cascade II; Photometrics, Pleasanton, CA) or to the APD detector (SPCM-AQR12; PerkinElmer, Fremont, CA). The CCD camera was used for the real-time visualization of the DNA stream, whereas the APD detector was used to count individual DNA particles by tracking the change in fluorescence emission intensity as single DNA molecules travel through the focused excitation field. The resulting fluorescent intensity peak is used as the indicator for DNA counting. A 488 nm rejection filter and a 520 nm band-pass filter (20 nm bandwidth) were placed in front of each detector. As the APD has a very small active area (∼180 µm in diameter), the fluorescent light was focused onto the active area using a set of collection lenses. The whole detection system was installed in a darkroom to minimize stray light.
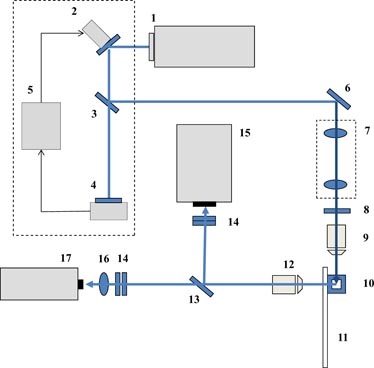
Figure 1. A schematic of the detection optics of the flow cytometric DNA counting system: (1) 488 nm diode laser, (2) piezo-actuated steering mirror, (3) beam splitter, (4) beam-position detector, (5) beam-position controller, (6) mirror, (7) Keplerian beam expander, (8) 488 nm band-pass filter, (9) 4× objective lens, (10) flow cell (fused silica square-tubing), (11) glass slide to support the flow cell, (12) 60× objective lens, (13) flip-mirror, (14) 520 nm band-pass filter and 488 nm cut-off filter, (15) em-CCD, (16) focusing lenses, (17) APD.
Download figure:
Standard image High-resolution imageSignal processing. The output pulses of the photon-counting APD responding to fluorescent photons were fed into a 16-bit frequency-to-voltage converter (AD9525; Analog Devices Inc., Norwood, MA) to generate analogue signal traces of the fluorescent intensity. The output pulses of the APD were integrated for 80 µs at every 100 µs. The analogue signal was compared with a preset threshold using an analogue comparator for the detection of meaningful events with the intensity higher than the threshold level, regarding only them as true events (the passage of a DNA molecule) and traced the rise of the fluorescent intensity to capture the peak of the curve involving a series of consecutive events. The peak intensity of each curve was then recorded. The data system checks if the signal rises again before it reaches the level below the threshold level. If it happens, the data system regards it as a new event involving the passage of a different DNA molecule, which means more than one DNA molecules contribute to a single intensity distribution curve. Peaks with durations greater than the normal duration were counted as events of double molecules (number of events of 'double molecules by width', Ndw). In addition, peaks with significantly larger heights than normal were also counted as events of double molecules (number of events of 'double molecules by height', Ndh).
Criteria for such events of double molecules were experimentally adjusted for optimization for the given experimental conditions where applied pressure and signal amplification were highly influential. For determining an event of double molecules by width, an average time span for the most frequent events was a starting point. Typically, a peak of a popular event lasted for 8 data sampling points for digitizing (∼3 ms). Therefore, the optimum criterion was sought among 7, 8, 9 or 10 data sampling points. Appropriateness of such a setting was determined by monitoring the screen of a digital oscilloscope that indicated events of double molecules in real time (online supplementary figure S-5 (stacks.iop.org/Met/51/491/mmedia)). In determination of an event of a double molecule by height, the criterion was first set to peak heights greater than 1.8-fold of the height of the most frequent events. This criterion was adjusted by 0.1-fold to result in the best measurement linearity together with the optimized criterion for calling events of double molecules by width. Multiple combinations of these criteria set were tried until a satisfactory measurement linearity (e.g. R2 = 0.999) up to 8000 counts was achieved.
In addition to events of double molecules, events possibly attributed from dye-containing background were also corrected. At the beginning and end of the experiment, a dye-blank solution (a solution containing everything including the fluorescence-dye but DNA) was measured. The averaged results of these measurements (Ndye) were subtracted from the results of sample measurements. Even after subtraction of dye-background counts, small numbers of events were occasionally observed at the weaker signal region on a histogram. In such a case, the counts of such events (Nnoise) were regarded as noise and subtracted from the total counts. Therefore, the finally adjusted counts (Nc) was determined by the following equation.

where
 is the number of events counted, Ndw is the number of events of double molecules determined by width; Ndh is the number of events of double molecules determined by height, Ndye is the number of events counted with a dye-blank solution and Nnoise is the number of events gated out as noise signals
Multiple runs, typically 10 runs, were made for each sample, and the results were averaged to obtain the value of Nc. Then, the final value of a measurement was calculated by the following equation to have a unit of (mol kg−1).

where C is the amount of substance of DNA in the unit of mole per sample mass, D is the density of a test solution and V is the sample volume.
If dilutions were necessary, dilutions were made gravimetrically in the fewest steps possible, and the dilution factor was reflected in the final value.
Histograms were generated on the x-axis of a 0.1 V step from 0 to 10 V, full scale. An in-house software program using Turbo-C language was utilized as well as Microsoft Excel and Microcal Origin for signal processing and data reduction.
2.2. Counting experiment
Plasmid DNA pBR322 was purchased from Fermentas (Burlington, Canada). The initial stock solution was diluted 1 000 000-fold to 50 mL of 1X TE buffer (10mM Tris/HCl at pH 8.0 + 1mM EDTA). For counting, 1 to 120 µL of this solution was gravimetrically diluted into 1.5 mL of run buffer (10mM Tris/HCl at pH 9.5 + 10% dimethyl sulfoxide) that contained 0.1 X Sybr Gold dye (S-11494; Invitrogen, Carlsbad, CA). The well-mixed sample solution described above was introduced into the fluidic channel by applying 0.2 MPa for 1 min. The sample solution was replaced with a buffer solution, then 0.07 MPa was applied with 20 kV as counting started. Counting was performed for 1.5 min. For repeated counting, the fluidic channel was occasionally cleaned by flushing with 0.1 N NaOH.
2.3. d-PCR
d-PCR quantification of pBR322 DNA was performed at a laboratory in the Advanced Institute of Science and Technology in Tsukuba, Japan. A typical d-PCR protocol was performed by an experienced scientist using Fluidigm EP1™ System (South San Francisco, CA). The PCR amplification conditions with a Taqman® probe are as follows:
- Master mix: Taqman®
- Forward primer: TATCGACTACGCGATCATGG
- Reverse primer: GCGACTCCTGCATTAGGAAG
- Probe: FAM-CGGCCTCAACCTACTACTGG-BHQ1
- Preheating: 90 °C, 10 min
- 40 cycles of 2-step reactions
- (melting: 90 °C, 15 s; annealing and extension: 60 °C, 60 s).
2.4. CE-dNMP analysis of pBR322
About 10 000 000-fold concentrated pBR322 relative to the concentration for count-based measurement was quantified by our in-house CE-dNMP analysis protocol [8]. In brief, a sample solution of pBR322 in a Tris buffer was mixed with DNase I and phosphodiesterase, then incubated at 37 °C for 1 h followed by the deactivation of enzymes proceeded at 80 °C for 10 min. The resulting individual nucleotides were separated by electrophoresis and then detected at 260 nm by a UV–VIS system. The UV signal was transferred to the quantities of each nucleotide type that were calibrated by the reference materials of nucleotides, which were certified using phosphorus measurement by ICP-OES [5]. The original concentration of pBR322 was then calculated based on its base sequence (www.ncbi.nlm.nih.gov/nuccore/208958).
2.5. Measurement of the sample volume
Three measurement methods were applied for determining the sample volume. First, fluorescent dye filling the given length of capillary tubing was completely expelled into the known volume of a buffer solution, then the concentration of the diluted dye solution was determined using a fluorescence measuring plate reader (Victor3; PerkinElmer, Walthem, MA, USA). Dilution factor calculated from the concentration led to the volume of the dye solution expelled from the capillary [19]. Second, a piece of about 7 m long fused silica capillary of the same batch as the capillary used as the fluidic channel was filled with deionized water by applying pressure. Then, the water filling the entire length of the capillary was pushed out to a water container to determine the mass of the water added to the container. The water container (a 1.5 mL Eppendorf tube) contained ∼1 mL of water beforehand for pre-equilibrium of water evaporation. The capillary tip was passed through a fine hole (∼1 mm in diameter) on the cap of the tube to be immersed into water in the container. This procedure was repeated four times, and the results were averaged (table 1). Third, the piece of fused capillary tubing used as a fluidic channel was prepared for imaging its cross section with scanning electron microscopy (SEM). The cross sectional area of the open channel was calculated by comparing the mass of its cut-out with that of a cut-out of a known area from a print of the SEM image of a reference standard (30 µm × 30 µm on the same SEM image, see the online figure S-8 (stacks.iop.org/Met/51/491/mmedia)). For comparing results of three methods using different capillary lengths, unit volume (volume for 1 cm in length) was calculated assuming that the channel is straight along the given length, which is highly likely. The gradation of the tubing dimension along the length of the tubing is typically ∼0.1 µm m−1 according to the manufacturer's specifications. In calculation of the sample volume, the unit volume was multiplied with the length of capillary from the injection end to the detection window. The detection window is the position where the laser beam was focused for excitation. Results of three measurement methods are compared in table 2.
Table 1. Repeatability in determination of the mass of water expelled from the 6.7 m long fused silica tubing of which the nominal cross sectional dimension was 49 µm × 49 µm.
| Measurement | Initial weight/g | Final weight/g | Net weight/g |
|---|---|---|---|
| 1 | 1.898 28 | 1.9168 | 0.018 52 |
| 2 | 1.904 03 | 1.922 41 | 0.018 38 |
| 3 | 1.894 24 | 1.912 69 | 0.018 45 |
| 4 | 1.896 47 | 1.915 05 | 0.018 58 |
| Avg | 0.018 48 | ||
| SD | 0.000 09 | ||
| RSD | 0.5% |
Table 2. Comparison of the results of determination of the unit volume (volume of unit length) of the flow cell using three different methods.
| Measurement method | Unit volume/μL cm−1 | Precision (CV) |
|---|---|---|
| Fluorescence measurement [19] | 0.0258 | 2.3% |
| Weighing water filling the capillary | 0.0243 | 0.5% |
| Calculation from SEM images | 0.0246 | 1.5% |
| Manufacturer's estimation | 0.0240 | NA |
2.6. Estimation of the measurement uncertainty
Overall measurement uncertainty of the proposed method was numerically driven using the Kragten method for spreadsheet calculation (www.uttv.ee/naita?id=17721). As the results vary along with the range of the final output value, we aimed at calculation of uncertainty for a sample of ∼5000 copies/mg, which is equivalent to ∼6 × 10⁻¹⁵ mol kg−1. Uncertainty components in equations (2) and (3) were evaluated (table 3). Rationales or the basis of such estimations are described in section 3. Those uncertainties were then input to the Kragten method for a spreadsheet to produce the combined uncertainty of the overall measurement procedure. Coverage factor of 2 was used to calculate the expanded uncertainty.
Table 3. Uncertainty components of the count-based quantitation that were used as the input uncertainties to the Kragten method for spreadsheet calculation. The concentration of the exemplified sample was ∼6 × 10⁻¹⁵ mol kg−1.
| Quantity | Unit | Value | Uncertainty | Uncertainty sources |
|---|---|---|---|---|
| Nc | (5473.3) | |||
|
|
(counts) | 4691 | 51.5 | Repeatability of multiple runs |
| Ndw | 561.3 | 59.2 | ||
| Ndh | 114 | 34.5 | ||
| Ndye | 90.7 | 20 | ||
| Nnoise | 16.3 | 10 | ||
| NA | mol−1 | 6.0221 × 10²³ | Not considered | |
| D | mg µL−1 | 1.0202 | 0.0067 | |
| Dwater (22.3 °C) | g cm−3 | 0.999 16 | 0.000 01 | |
| T | °C | 22.3 | 0.1 | ΔD/ΔT (22 °C) = 0.000 097 g cm−3 °C−1 |
| Wwater | g | 0.199 37 | 0.000 25 | From weighing |
| Wsample | g | 0.203 56 | 0.001 31 | |
| V | μL | 1.4167 | 0.0142 | |
| Vunit | μL cm−1 | 0.0243 | 0.000 27 | Difference between two methodsa |
| l | cm | 58.3 | 0.01 | Determination of length |
| Output | mol kg−1 | 6.04 × 10⁻¹⁵ | 0.13 × 10⁻¹⁵ | Combined using Kragten method |
3. Results and discussion
3.1. Need for calibration standards for PCR-based DNA quantification
As reported previously by others [17, 25], real time-PCR or d-PCR may underestimate the concentration depending on the structure of the template DNA. For example, natural plasmid DNA is mostly in the form of supercoils, which may create difficulties when it comes to primers reaching the designated priming sites during the annealing step, or it may not melt completely to fully expose the designated template regions during the extension. In this study, the d-PCR measurement with intact pBR322 DNA yielded only ∼30% of the expected result (figure 2), whereas a closer agreement between yield and expectation was seen with linearized lambda phage DNA. One could fully optimize the PCR conditions for pBR322 DNA to avoid such underestimation. However, a near 100% success rate in the single-copy PCR may not be ensured unless it is confirmed with a reliable reference standard. The proposed direct counting method that does not include PCR amplification may serve as such a reference standard.

Figure 2. Possible underestimation of the quantity of supercoiled pBR322 DNA by a digital PCR method. Only about 30% of the expected quantity was measured by a digital PCR procedure. The x-axis was driven from the analytical results of CE-dNMP analysis of a stock solution combined with gravimetric dilution factors. Experimental details are described in section 2.
Download figure:
Standard image High-resolution image3.2. Improvement of the count-based measurement system for applications to plasmid DNA
The performance of the counting system had to be further optimized or improved from what has been reported previously [19] in order to ensure robust detection of substantially smaller plasmid DNA. Under the previous conditions optimized for lambda phage DNA, histograms for pBR322 were dramatically poorer, as shown in figure 3. Poor histograms indicate that electro-hydrodynamic focusing of the stream of pBR322 DNA molecules is not tight enough to maintain the trajectory of the molecules within the focal area of LIF detection that was set along the central axis of the channel. It was observed that smaller DNA particles easily escaped the pressure gradient formed by the hydrodynamic flow of a parabolic profile (Bernoulli's theorem). We have found the same trend with plastic beads. Plastic beads smaller than 1 µm were hardly focused in their trajectories, whereas larger beads were focused well under appropriate pressures and electric fields. Nevertheless, focusing of the trajectories of pBR322 DNA was improved with an increased pressure for faster hydrodynamic flow, which can be seen in the improved histogram (figures 3(b)-b relative to figure 3(b)-a). However, there was still a significant fraction of pBR322 DNA detected with weak fluorescence signals that substantially deviated from the intensity of the main population, which implies that those DNA molecules flow along in the proximity of the capillary wall. An increased electric field, however, reduced the fraction but did not narrow the peak width of the histogram (figure 3(b)-c relative to figure 3(b)-a). The two effects of faster flow and stronger electroosmotic flow (EOF) were additive, as seen in figure 3(b)-d. The rationale for the effect of faster flow is straightforward and relies on Bernoulli's theorem. However, a fast flow would still result in stagnant layers along the capillary wall; some of the DNA molecules may escape from the pressure gradient into these layers. Stronger EOF rising along the capillary wall might more effectively disrupt such stagnant layers as it is directed against the hydrodynamic flow. In this case, DNA molecules in the stagnant layers would fall back into the pressure gradient. This hypothesis is supported by occasional observations of turbulent motions of DNA particles close to the capillary wall. Although far inferior to the results for lambda phage DNA, the finally optimized conditions resulted in acceptable histograms for pBR322 DNA. However, too fast flows shortened the exposure time to the detector to degrade the detection sensitivity whereas the voltage for EOF was limited to 20 kV. Higher voltages made the system unstable by occasional arcs.

Figure 3. Peak shapes of the histograms for larger (48.5 kbp) lambda phage DNA (a) and smaller (4.36 kbp) pBR322 plasmid DNA (b). For lambda viral DNA (a), 5 kV and 0.4 MPa was applied. Improvement of the peak shapes of histograms for pBR322 by increasing applied voltage and hydrodynamic pressure: a, 5 kV and 0.4 MPa; b, 5 kV and 0.7 MPa; c, 20 kV and 0.4 MPa; d, 20 kV and 0.7 MPa.
Download figure:
Standard image High-resolution imageSince the fluorescent signal decreased with the size of the DNA, the background noise became relatively significant in counting pBR322 DNA. Therefore, a fluorescent detection needed to be made at the best sensitivity. It was most critical to focus the fluorescent light onto the small active area of the APD (∼180 µm in diameter), which was ensured with the help of a CCD-equipped microscope where the fluidic channel was filled with a concentrated fluorescein solution to produce constant fluorescence emission to adjust the focusing optics (see the online supplementary figure S-2 (stacks.iop.org/Met/51/491/mmedia)). A combination of lenses for a short focal length (∼0.5 cm) was applied for this purpose. Then, the well-aligned optics for detection resulted in a satisfactory histogram even for pUC18 plasmid DNA of 2.69 kbp (see the online supplementary figure S-3 (stacks.iop.org/Met/51/491/mmedia)). However, such alignment was time consuming and painstaking. In particular, whenever the laser was turned on, some degree of deviation in the radiation direction occurred, which required repeated alignment. This problem has been overcome with a beam stabilizer equipped with a position sensor combined with a piezo-actuated mirror (the dotted section in figure 1). This approach considerably improved the efficiency of the operation of the measurement system.
3.3. Treatment of raw data for measurement linearity
The validity of the measurement principle of a newly proposed quantification method can be proved with its measurement linearity of an acceptable quality. The counting method did not result in satisfactory measurement linearity if a simple summation of the events (
in equation (2)) was used for quantitation. As shown in figure 4 (∘ symbols), counts for relatively concentrated pBR322 DNA (counts >5000) substantially curved downwards to result in underestimation. This result may be caused by the events of 'multiple DNA detection', opposed to the events of 'single molecule detection' assumed in the measurement principle. Unlike sheath flow-based flow cytometry, DNA particles were not accelerated to have enlarged interparticle distance in the suggested counting method. The absence of acceleration is advantageous to avoid shear stress on DNA chains but raises an issue of short interparticle distances for concentrated DNA samples. With an insufficient interparticle distance, chances are high to observe two or more DNA particles pass the detection zone together. If we assume equal spacing among linearly arranged DNA particles along the 60 cm long sample cell, 30 000 DNA particles can pass the detection zone that is 20 µm wide without simultaneous exposure to the detector. In reality, however, the spacing is randomly distributed, which causes simultaneous exposures for a number of DNA molecules. Furthermore, there could be a small but detectable portion of pBR322 dimer, as indicated in gel electrophoresis (see the online supplementary figure S-4 (stacks.iop.org/Met/51/491/mmedia)). We categorized the simultaneous exposures into three groups. In the first group, two DNA molecules pass the detection zone simultaneously but with a detectable space in between, which results in two local maxima within a single time-traced intensity curve (see the online supplementary figure S-5A (stacks.iop.org/Met/51/491/mmedia)). In this case, we simply separated this event as two independent events as we do for chromatographic peak separation. In the second group, there was no detectable space between the two molecules but the combined fluorescent signal peak was significantly wider than the ordinary peak of a single DNA molecule, implying the sequential passage of two molecules in a row (see the online supplementary figure S-5B (stacks.iop.org/Met/51/491/mmedia)). These events were counted as 'events of double molecules by width'. Finally, two DNA molecules passed with minimal space to result in a fluorescent peak with a regular width but of a substantially greater peak height. These events were counted as 'events of double molecules by height', implying possible aggregation of molecules (see the online supplementary figure S-5C (stacks.iop.org/Met/51/491/mmedia)).

Figure 4. The measurement linearity of the count-based quantification of pBR322 plasmid DNA: before (∘) and after (▵) correction of the events of double molecules. The details of the correction method are described in the text.
Download figure:
Standard image High-resolution imageAs described in section 2, criteria for determining the events of double molecules were experimentally optimized until satisfactory measurement linearity was achieved. Typically, the peak duration of nine or more data sampling points was the optimum criterion for events of 'double molecules by width' where the average peak duration of the most frequent events was eight data sampling points. The optimum peak height as the criterion for events of 'double molecules by height' was 2.1-fold of the peak height of the most frequent events. This set of criteria needed to be adjusted if the major experimental conditions such as flow rate and the gain of signal amplification were changed. The temporal resolution of data sampling point needed to be improved for finer adjustment of the criterion for double events by width.
The proportion of events of double molecules increased in an exponential manner as DNA concentration increased (see the online supplementary figure S-6 (stacks.iop.org/Met/51/491/mmedia)). For example, for 2000 event counts
 , counts for events of double molecules by width (Ndw) and double molecules by height (Ndh) were 105 (5.3%) and 15 (0.7%), respectively. These increased to 560 (12.1%) and 114 (2.5%), respectively, for 4600 event counts. The CVs of counts of double events (Ndw + Ndh) were in the range 5% to 20% for multiple runs. The minimum CV (∼5%) was observed for ∼2000 event counts. As the final outcome of the correction of events of double molecules, the measurement linearity was dramatically improved up to 8500 counts (▵ in figure 4).
For samples of higher concentrations, however, the linearity was not maintained, which indicates imperfection of the current correction scheme for concentrated samples. At higher concentrations, there are increased chances of coincidental detection of triple or quadruple DNA molecules, which are not discerned by the current correction scheme. Application of Poissonian statistics instead may be more appropriate in this case. However, it does not seem to justify giving up the current correction scheme that works with real data. Dilution of samples to lower appropriate concentrations would provide better results than application of Poissonian statistics in terms of measurement uncertainty. The standard uncertainty of the current correction scheme was estimated as ∼2% of ∼5000 event counts. Nevertheless, this point needs to be studied further.
Considering counts in a weaker fluorescent intensity region, background counts prevailing in this region caused instability in the signal gating. The distribution of events for a dye-blank solution (a test solution containing everything, including dye, except for the sample DNA) was compared with other pBR322 solutions of different concentrations in figure 5. For less concentrated DNA solutions, the superposition of events with the background counting seemed unavoidable, but it became negligible with concentrated DNA solutions. Nevertheless, a background count was subtracted from the results of the sample counting as a simple data treatment. The background count of a dye-blank solution resulted in 20 to 80 exhaustive counts, being highly influenced by the day-to-day instrument setup. Therefore, the background count was determined in every new experiment. Such a treatment led to excellent measurement linearity in the plot of measured versus expected values down to 100 exhaustive counts (see the online supplementary figure S-7 (stacks.iop.org/Met/51/491/mmedia)). We estimated the measurement uncertainty due to the variation in background counts to be ±20 counts.
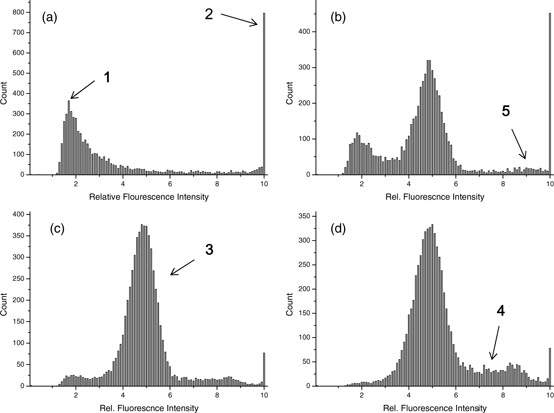
Figure 5. Representative shapes of the histogram for pBR322 at different concentrations: (a) dye-blank solution, (b) 0.13 × 10⁻¹⁵ mol kg−1, (c) 2.43 × 10⁻¹⁵ mol kg−1, (d) 6.03 × 10⁻¹⁵ mol kg−1. Longer counting time was applied for dilute solutions to accumulate a meaningfully large number of events: (a) 120 min, (b) 50 min, (c) 4 min, (d) 1.5 min.
Download figure:
Standard image High-resolution imageOverall, an excellent measurement linearity (R2 = 0.999) in the plot of measured versus expected values was achieved between 100 and 8500 exhaustive counts (0.1 × 10⁻¹⁵ mol kg−1 to 10 × 10−15 mol kg−1) with the data treatment described above, which strongly supports the validity of the accuracy of the measurement platform and data processing. In addition, potential adverse phenomena such as wall-adsorption, fragmentation or cluster forming by adhesion of multiple DNA molecules were shown not to occur in observable degrees.
3.4. Determination of the volume of the sample cell
In exhaustive counting, calculation of the molar concentration of DNA involves the sample volume (equations (1) and (3)). Therefore, an accurate determination of sample volume V is as crucial as the counts (Nc) of DNA. Considering a small sample volume close to 1 µL, its accurate determination was not a trivial task. Initially, we calculated the volume of the applied capillary of a given length by the fluorescent dye-dilution method [19]. However, the precision of this measurement was not satisfactory (up to 5% CV). A different approach of weighing water filling the given length of capillary tubing produced a surprisingly high precision (0.5% CV for n = 4), as seen in table 1. Pre-equilibrium of water evaporation in a virtually closed water container worked well to reduce water evaporation rate down to ∼0.08 mg min−1, where the weighing procedure took 10 min to 15 min. Therefore, ∼185 mg of water from the capillary tubing could be weighed precisely. However, this result was noticeably different (6% less) from the result of the fluorescence measurement (table 2). The third method of determining the cross sectional area of the flow-cell capillary from a calibrated SEM image (see the online supplementary figure S-8 (stacks.iop.org/Met/51/491/mmedia)) resulted in acceptable agreement (1.1%) with the method of weighing water from capillary, which indicates a high possibility of the validity of two measurement methods. Furthermore, the result of the method of weighing water from capillary agreed within 1% with the dimensions claimed by the manufacturer (49 µm × 49 µm). As it was ensured that measured values were not unexpectedly false, we took the most precise result, 0.0243 µL cm−1 (from the water weighing method), as the unit sample volume. The uncertainty of the method of weighing water from capillary was estimated as 0.7% including weighing repeatability, evaporation correction and length determination. The difference from the SEM image method, 1.1%, was taken as the uncertainty of determination of unit sample volume to avoid possible underestimation by unknown sources. The sample volume was then determined 1.42 µL by multiplying the length between the injection end and the detection window, 58.3 cm with the uncertainty of ∼0.1 cm. As samples were prepared gravimetrically, sample mass instead of sample volume was required for calculation of the concentration of an original sample. The density of the test solution (1.020 mg µL−1) was measured to be slightly greater than pure water due to the addition of DMSO (density = 1.100 kg L−1). Uncertainty in determination of the density of the test solution included repeatability and calibration uncertainty of weighing for determination of the relative mass of test solution to water as well as uncertainty in temperature that changes water density. Applying its exact density, the sample mass was determined to be 1.445 mg. The final results of flow cytometric measurement in table 4 were calculated using the test sample mass of 1.445 mg.
Table 4. Comparison of the results of count-based quantitation of three pBR322 samples with their predicted values from the result of CE-dNMP analysis in regard to the dilution factors. Expanded uncertainties (k = 2) are indicated along with the values.
| Sample | Count-based quantitation | CE-dNMP analysis | |||
|---|---|---|---|---|---|
| Average Nc (count) | FCM result (k = 2) (×10−15 mol kg−1) | CE-dNMP prediction (×10−15 mol kg−1) | Dilution factor (×10−8) | CE-dNMP result (k = 2) (mol kg−1) | |
| S1 | 2096 | 2.41 ± 0.11 | 2.41 ± 0.10 | 1.42 | (1.70 ± 0.07) × 10−9 |
| S2 | 5259 | 6.04 ± 0.13 | 6.05 ± 0.25 | 3.56 | |
| S3 | 6897 | 7.92 ± 0.28 | 8.02 ± 0.33 | 4.72 | |
3.5. Measurement uncertainty
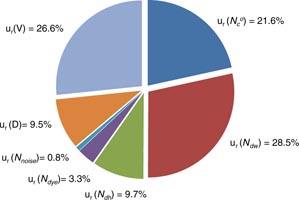
Uncertainty components in equations (2) and (3) were estimated and listed in table 3. The results for the sample of 6 × 10⁻¹⁵ mol kg−1 (∼5000 counts) were exemplified. For the quantities of counts involved in determination of Nc, standard deviations in ten consecutive runs were used as their standard uncertainties. For Ndw and Ndh, uncertainty might be greater than just the standard uncertainties due to possible incorrectness in the criteria setting. For the time being, however, there was no clear evidence for such underestimation. As the concerned concentration range was covered with satisfactory linearity, such probability was ignored for now. Even so, uncertainty in determination of events of double molecules counted ∼40% of the overall combined uncertainty. Repeatability in event counting itself was 22% of the overall combined uncertainty whereas uncertainty in determination of sample volume took 27%. The uncertainty sensitivity calculated using the Kragten method is shown in figure 6. Considering the relatively even distribution of uncertainty among four different sources, the coverage factor of the expanded uncertainty (k) was set to 2.0. For the given case, the measured value and expanded uncertainty were (6.04 ± 0.13) × 10−15 mol kg−1. The relative expanded uncertainty was 4.3%. Relative expanded uncertainties for other samples were in the range 3% to 6%. For samples of less than 1000 event counts, relative expanded uncertainties were substantially worse (e.g. ∼20% for the sample of ∼380 event counts) mostly due to relatively poor repeatability in event counts. On the other hand, underestimation obviously enlarged uncertainty.
Figure 6. Sensitivities of various uncertainty contributors estimated using the Kragten method for spreadsheet calculation. The uncertainty components are the same as in table 3. Refer to equations (2) and (3) for the meanings of the quantity symbols.
Download figure:
Standard image High-resolution image
3.6. Validation by comparison with CE-dNMP analysis
The proposed count-based quantification of pBR322 DNA was further validated by comparing with the predicted concentration of samples from the CE-dNMP analysis [8]. The CE-dNMP analysis method developed in this laboratory has been validated in terms of both perfection of enzymatic digestion of DNA to nucleotides and the accuracy of the capillary electrophoresis (CE) analysis. The calibration standards for CE analysis of nucleotides were certified with ICP-OES measurements of their phosphorus content in nucleotides, combined with phosphorus impurity analysis with HPLC-ICP-MS. Because of the lack of sensitivity, CE-dNMP analysis was performed with about 100 million-fold concentrated pBR322 solutions. Gravimetric dilution factors of the samples for counting were multiplied with the result of CE-dNMP analysis to directly compare with the result of count-based quantification. As shown in table 4, the results of the two methods agree to within their measurement uncertainties. Although such closeness (less than 1.3% deviation) could be led by statistical coincidence from the limited set of data, such agreement between two methods of totally different measurement principles strongly supports the validity of both analytical methods. This agreement also confirmed that the gravimetric dilution of DNA under the given conditions (a mildly alkaline solution in glassware with minimal dilution steps) worked as expected.
From this result, we also confirmed that the previously observed underestimation of lambda phage DNA by flow cytometric counting relative to CE-dNMP analysis was due to fragmentation of large linear DNA. In our previous work, a significant underestimation (∼30%) was found in count-based quantification of lambda phage DNA compared with the results of the CE-dNMP analysis [19]. The cause of this underestimation was hypothesized to be due to the fragmentation of linearized lambda phage DNA from routine sample handling. It has been confirmed that linear DNA is subject to fragmentation by routine manipulations if its length is greater than 20 kbps, whereas smaller DNA is quite immune to fragmentation [24]. Although it does not count as much as 30% of lambda phage DNA of its integrity, substantial amounts of fragments are visible in the histogram of lambda phage DNA samples (figure 3(a)). Smaller fragments could exist but be invisible due to the limited window of the fluorescence intensity. In contrast, pBR322 is not prone to such fragmentation as it is about 10-fold smaller than lambda phage DNA and is mostly in the form of tightly wound supercoils. Therefore, substantial fragmentation is not likely with pBR322, and no extra DNA was detected by the CE-dNMP analysis other than countable, intact pBR322. Consequently, underestimation should not be observed in this study.
3.7. Current applications
An international measurement comparison has been organized among several national metrology institutes. In this comparison, the measurement performance for pBR322 plasmid DNA based on the direct counting method and d-PCR methods will be compared. Both the supercoiled form and the linearized form will be measured. The outcome of this study will ultimately prove the analytical validity and applicability of both enumeration-based DNA quantification methods.
4. Conclusions
In this work, the feasibility of quantification of low-level plasmid DNA by flow cytometric counting of individual DNA molecules is demonstrated. The improved signal-to-noise ratio of LIF detection, as well as the tightened stream of DNA molecules, allowed for the extension of the applicability of the proposed analytical method from large lambda phage DNA (∼50 kbp) down to pUC18 plasmid DNA (∼3 kbp). The optimized gating strategy led to a satisfactory measurement linearity (R2 = 0.999) within the count range of 100 to 8000 counts, which strongly supports the validity of the measurement principle. With accurate assessment of the sample volume, the 'exhaustive counting' strategy worked well as the measurement results agreed well, to within 1%, with the results of the conventional CE-dNMP analysis.
The principle and procedure of the direct counting method are simple and straightforward. There is less chance of producing false results since the measurement performance is clearly revealed in histograms. Therefore, reliable measurement standards, certified reference materials (CRMs), could be produced using this method. Such plasmid DNA CRMs would facilitate proper validation and calibration of PCR-based DNA quantification methods such as real-time PCR, d-PCR and droplet PCR, by which such analytical methods can be widely used with a high degree of confidence.
Acknowledgments
This work was supported through S&T Promotion Funds by the National Research Foundation of Korea (NRF, Korea) and internal R&D funds of the Korea Research Institute of Standards and Science (KRISS). This research was supported by the NIST intramural innovative measurement science (IMS) program on 'optical medical imaging for clinical applications' and by the NIST intramural Nanoparticle Environmental Health and Safety (NanoEHS) program.