


ABSTRACT
We present the search for both diffuse interstellar bands (DIBs) and molecules in Comet 17P (Holmes) and Comet C/2007 W1 (Boattini) occultation observations. Absorption spectra were taken during stellar occultations by Comet Holmes of 31 and β Persei, and the occultation of BD+22 216 by Comet Boattini. While no signature of the comets was detected, we present upper limits for some common cometary molecules such as C2, C3, CH, CN and for the most common DIBs. We did not detect either comet in absorption, most likely because of the large distance between the line of sight to the star and the nucleus of the comet. Interstellar sight lines with comparable reddening to what was measured in Comet Holmes have DIB equivalent widths between 5 and 50 mÅ. However, future observations with closer approaches to a background star have great potential for spatially mapping molecule distributions in comets, and in discovering DIBs, if they are present, in comets. Future observations could detect DIBs and molecules if they are done: (1) less than ∼104–103 km from the nucleus (2) with a signal to noise in the background star of ∼300 and (3) with a resolving power of at least 38,000.
Export citation and abstract BibTeX RIS
1. INTRODUCTION
The diffuse interstellar bands (DIBs) are over 550 unidentified interstellar lines between 4100 and 9200 Å (e.g., Hobbs et al. 2008, 2009). For over 80 years the carriers for the diffuse interstellar bands have remained elusive. While many hypotheses have been put forward (e.g., Snow 2001; Smith et al. 1977), they have either failed to withstand observational tests (e.g., hyper-excited H2 transitions, Destree et al. 2007) or they are impractical or impossible to test in the lab, whether from the inability to do gas phase chemistry (ionized polycyclic aromatic hydrocarbons (PAHs)) or to synthesize nitrogenated PAHs (Salama et al. 1996). Because of the current failure of laboratory and observational studies (see Herbig 1995, and references therein) to lead to direct identification of the DIBs, we have attempted a search for the DIBs in a new astronomical site: comets, specifically a particularly interesting outburst of Comet Holmes in late October of 2007 and the long period comet C/2007 W1 (Boattini). Detection of DIBs in comets is a particularly attractive approach in light of the possibility of also obtaining direct samples of the material (i.e., the Stardust mission, Brownlee et al. 2006).
The detection of DIBs in comets would imply that DIBs were either present in the pre-solar nebula, indicating a specific radiation and density environment, or that they are created as organic molecules evaporate into the comet's coma. In either case, finding DIBs in comets would help to identify the DIB carrier molecules. For instance, the detection of DIBs outside the coma would imply that the DIB carrier is associated with gas instead of dust; any shifts in the position of the lines would indicate a change due to temperature or phase; other physical characteristics of the comet could point toward associations of ionization state and or density with the DIBs. Furthermore, while some interstellar medium (ISM) sight lines are very well studied (e.g., ζ Oph; see Black & Dalgarno 1977; Morton 1975), the proximity of comets has allowed us to characterize and understand their environments more completely. For instance, we are able to obtain physical sizes and shapes (Lamy et al. 2004), molecular and atomic profiles (e.g., Combi et al. 2004) and a detailed understanding of their radiation environment from solar observations (Ip 2004). Therefore, if DIBs are found in comets they can be easily compared to environmental factors. Any one of these clues would be a large step in understanding the DIB carriers.
There is a remarkable similarity between interstellar absorption features and cometary emission features in that nearly every atomic or molecular feature detected in the ISM is seen in comets (Herbig 1975; Ehrenfreund & Charnley 2000). Therefore, it is plausible to expect some of the DIB molecules to be sequestered in comets or to be formed out of evaporated cometary material (Sandford 2008) as the solar nebula presumably formed from an ISM environment (Mannings et al. 2000), and it is therefore possible we could detect them in ejected nuclear material or evaporated pristine material that would be seen in long period comets. Furthermore, there have been recent detections of PAH signatures in comets (Moreels et al. 1994) that further the case for the presence of DIBs in comets if the DIB carrier is some form of PAH, e.g., nitrogenated or ionized PAHs (Salama et al. 1996).
In the following, we will give a background explanation of our research in Section 2, Section 3 will detail our observations, Section 4 gives a methodology followed by Sections 5 and 6 where we give our analysis and results. Section 7 discusses the results and their implications and Section 8 sums up with a conclusion.
2. BACKGROUND
Because of its massive expansion beginning in late 2007 October, which brought unmodified nuclear material into the coma, Comet Holmes was ideal for occultation studies. The spectacular brightening of the comet well after perihelion likely owing to a phase change and energy/dust release from the nucleus, presented a number of occultation opportunities. In theory, these occultations would allow us to study the changes in the spatial and temporal abundance of molecules and DIBs, if they were detected.
A long period comet, Comet C/2007 W1 (Boattini) was also studied in an occultation event. Since this was most likely the comet's first pass by the Sun, material evaporated from it as it approached the Sun potentially represents primordial, unaltered solar nebula material that, as it evaporates, could form one or many of the DIB carriers.
There have been three previous unsuccessful absorption searches for DIBs in comets thus far. Crawford & McNally (1987) studied an occultation of τ Ari (BV IV, V = 5.3) by Comet Halley at the INT. The closest projected distance between the comet and the star was about 8.0 × 10⁵ km. Estimates of the size of the coma indicate that comet molecular material was in the line of sight, but they speculate that the dust portion of the coma was not. Crawford and McNally only focused on the two prominent DIBS at 5780 and 5797 Å and found no significant change between the τ Ari spectrum with the comet in front of it and a spectrum without the comet in the line of sight. They found upper limits for the column densities of the 5870 and 5797 DIBs an order of magnitude lower than typical ISM equivalent widths.
Herbig (1990) also published a separate search for DIBs in Comet Halley, with two occultation events, the first was also of τ Ari and the second was of HD 17435 (A3, V = 8.4) at the Lick Observatory. The results of the τ Ari occultation were similar to Crawford and McNally's and in this paper we learn that the τ Ari observation was at a high air mass and in this case had bad seeing as well. The HD 17435 occultation brought Comet Halley to within 1.4 × 10⁴ km of the background star. However, this observation was also plagued with poor observing conditions. Herbig only focused on the 6177, 6203, and 6292 DIBs and did not detect any variation in their equivalent widths in the occulted versus the unocculted spectrum. He reports a 10 mA Wλ for the 5780 mÅ.
Herbig & McNally (1999) looked for DIBs in Comet Hale-Bopp as it occulted HD 12859 (B8, V = 8.2) at Keck I using HIRES. The minimum separation distance between the comet and the background star was only 3.08 × 10⁴ km, however this was through an air mass of 3.66, and in fact all of their observations of HD 12859 were taken at an air mass equal to or greater than that. They obtained a high-resolution spectrum (R = 45, 000) with full optical wavelength coverage. Herbig and McNally searched for changes in the 4726, 4779, 5780, 6269, and 6613 Å DIBs and found no significant difference between their occultation spectrum and their comparison spectrum and report upper limit for the 5780 DIB of 10 mÅ. No groups searched for molecular absorption from the comet to confirm that the coma was sufficiently dense in the line of sight to expect the DIB carriers to be there. Herbig (1975) searched for DIBs in emission in Comet Kohoutek 1973f and was unsuccessful. However, the most likely detection will be in absorption against a background star as the DIBs are only rarely seen in emission (e.g., the Red Rectangle, Scarrott et al. 1992; Hobbs et al. 2004).
Observations of a comet in absorption against a background star offer many advantages over traditional emission observations. Absorption measurements of atomic and molecular transitions offer spatial information much more localized than emission, as emission observations are sensitive to the entire beam of the telescope. Measurements of column densities are directly proportional to the measured equivalent width of unsaturated lines and are completely model independent, unlike emission studies. Through the course of the occultation, the portion of the comet along the line of sight toward the star changes which allows observers to study how the spectrum, and therefore the density, of the comet changes as a function of distance from the nucleus.
An absorption spectrum of the comet free of stellar and interstellar contamination can easily be obtained by dividing out the stellar spectrum. Assuming the optical depth of the comet is small (τ ≪ 1) the radiative transfer through the comet adds a simplistic exponential term (Beer 1853) that can be isolated by observing the star before or after the occultation and dividing out the intrinsic intensity of the star.
3. OBSERVATIONS
Observations were taken using the Astrophysical Research Consortium Echelle Spectrograph (ARCES) on the 3.5 m telescope at The Apache Point Observatory (APO). ARCES is a 120 order, high-resolution, cross-dispersed echelle spectrograph with a resolution of ∼38,000 and a usable wavelength range between 3400 and 10000 Å (Wang et al. 2003).
Ephemerides for Comet Holmes and Comet Boattini were obtained using NASA's JPL Horizons ephemeris program. The orbit of Comet Holmes was calculated for every 10 minutes from early 2007 November through 2008 February while the orbit of Comet Boattini was calculated for every 10 minutes from early 2008 July through 2008 September. The orbits were then cross-checked against early-type stars listed in the Simbad database to determine if the comet's orbit came sufficiently (∼ 0 5) close for occultation observations. While the spectral type theoretically does not matter since it is divided out to obtain a pure comet spectrum, in practice O and B stars are much easier to work with due to their simple optical spectra. However, Comet Boattini's orbit was compared to F and earlier types to obtain a closer impact sight line with the comet.
Two stars were found that matched the Comet Holmes orbit that were observable with the APO telescope, 31 and β Persei. 31 Per is a B5V star with magnitude V = 5.036 and a reddening EB−V of 0.11 (Chavez et al. 1995). Algol, or β Per, is a V = 2.12 ± 1.14 mag eclipsing binary of spectral type of B8V and K2IV. There is no published value for the reddening of β Per. However, B−V measurements from Simbad give −0.05 and using a B8V intrinsic B−V of −0.11 gives a reddening of EB−V = 0.06, consistent with a lack of detection of the strong interstellar absorbers Ca ii (at 3933.7 Å, Vallerga et al. 1993) and the Na i D lines (Welsh et al. 1990). The low reddening for both of these sight lines implies the strengths of any interstellar DIBs and molecules (e.g., C2 and C3) that would also be found in comets, are low if present at all.
Many suitable background stars matched Boattini's orbit, but BD+22 216 was chosen as it was thought that it has the smallest occultation separation distance (less than 36'' or 2.1 × 10⁴ km), though using more accurate ephemerides and because of a slight miscalculation, the separation distance was 012 (2.58 × 10⁵ km). BD+22 216 is an F5 star with a magnitude of V = 9.94 and an inferred reddening of 0.03 assuming BD+22 216 is a main-sequence star, again implying any interstellar detections of comet-like material are low.
Observations of the 31 Per occultation by Comet Holmes lasted 10 minutes, during which the comet's velocity was 0.31 arcsec minute−1. Observations of the β Per occultation by Comet Holmes lasted for 30 minutes with the comet velocity at 0.97 arcsec minute−1. Finally, observations of the Comet Boattini occultation took 2 hr and the comet's velocity was 1.5 arcsec hr−1.
For each occultation a spectrum of just the background star was taken without the comet in front of it to be used as a comparison spectrum. For the Comet Boattini occultation this comparison spectrum was taken 9 days ahead of time when the comet was well away from the background star (see Table 1). The comparison spectrum for 31 Per was 24 days taken after the comet had already occulted the star. While remnant cometary material could have been left behind as the comet passed, the average photodissociation lifetime of almost every molecule we examined is shorter than 24 days and therefore, not enough material remained to provide any substantial absorbing column to be detected in our spectrum (see Figures 1–3). The comparison spectrum for the β Per occultation was taken only 3 days prior to the occultation event. We know that cometary material was present while taking the comparison spectrum as estimated by reports of observations of the coma size (see Table 1). Section 4 examines the β Per occultation in more detail.
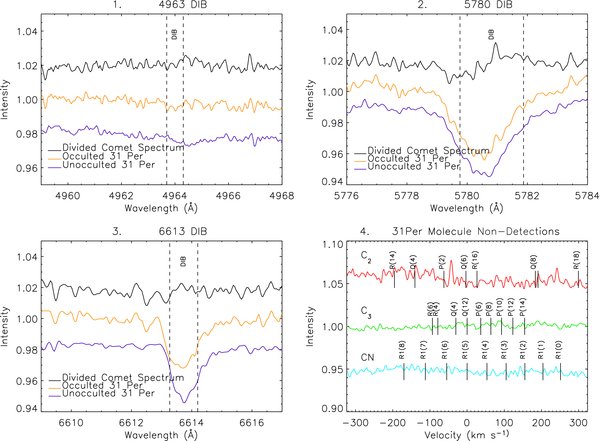
Figure 1. 31 Per occultation spectra of (1) the 4963 DIB, (2) the 5780 DIB, (3) the 6613 DIB, and (4) the comet occultation absorption spectrum showing the Phillips 2-0 C2 band, the A-X 000-000 C3 band, and the B-X violet 0-0 CN band. For each molecule V = 0 corresponds to the wavelength given in Table 2, shifted to the relative velocity of the comet. Note there is no evidence that any of these molecules have been detected. In black is the Comet Holmes occulted spectrum taken on 2007 November 21 divided by the unocculted spectrum taken on 2007 December 12 resulting in a pure comet spectrum. Dashed lines represent the FWHM of the DIB and are centered at the relative velocity of the comet with respect to Earth on 2007 November 21.
Download figure:
Standard image High-resolution image
Figure 2. β Per occultation spectra of (1) the 4963 DIB, (2) the 5780 DIB, (3) the 6613 DIB, and (4) the comet absorption occultation spectrum showing the Phillips 2-0 C2 band, the A-X 000-000 C3 band, and the B-X violet 0-0 CN band. For each molecule V = 0 corresponds to the wavelength given in Table 2, shifted to the relative velocity of the comet. Again we see no evidence that any of these molecules has been detected. In black is the Comet Holmes occulted spectrum taken on 2008 January 23 divided by the unocculted spectrum taken on 2008 January 21. Dashed lines represent the FWHM of the DIB and are centered at the relative velocity of the comet with respect to Earth on 2008 January 23.
Download figure:
Standard image High-resolution image
Figure 3. BD +22 216 occultation spectra of (1) the 4963 DIB, (2) the 5780 DIB, (3) the 6613 DIB, and (4) the comet absorption occultation spectrum showing the Phillips 2-0 C2 band, the A-X 000-000 C3 band, and the B-X violet 0-0 CN band. For each molecule V = 0 corresponds to the wavelength given in Table 2, shifted to the relative velocity of the comet. These plots show that there is no evidence of a detection of molecules in Comet Boattini. In black is the Comet Boattini occulted spectrum taken on 2008 September 24 divided by the unocculted spectrum taken on 2008 September 15. Dashed lines represent the FWHM of the DIB and are centered at the relative velocity of the comet with respect to Earth on 2008 September 24.
Download figure:
Standard image High-resolution imageTable 1. Observational Parameters
| UT Date | Target | Closest Line of Sight Distance | Estimate of Gas Extenta | Visual Diameter |
|---|---|---|---|---|
| (°) (106 km) | (106 km) | Arcmin (106 km) | ||
| Comet Holmes | ||||
| 2007 Oct 28 | Comet Holmes emission | 0 (0) | 0 | < 22 (1.6)b |
| 2007 Nov 21 | 31 Per occultation | 0.55 (2.4) | 2.3 | 36 (2.6)c |
| 2007 Dec 18 | 31 Per background | 4.9 (22.9) | 4.7 | 65 (5.2)d |
| 2008 Jan 20 | β Per background phase = 0.427 | 0.50 (2.9) | 7.5 | ∼80 (7.8)e |
| 2008 Jan 23 | β Per occultation phase = 0.457 | 0.28 (1.65) | 7.8 | ∼80 (8.0)e |
| Comet Boattini | ||||
| 2008 Sep 24 | BD+22 216 occultation | 0.12 (0.259) | 4.9 | 2(.072)f |
| 2008 Sep 15 | BD+22 216 background | 4.04 (8.08) | 4.3 | 2(.066)f |
Notes. aEstimate assuming a uniform, constant expansion of 1 km s−1 for Comet Holmes starting on 2007 Oct 25 and 0.78 km s−1 for Comet Boattini starting on 2008 Jul 13. bGreen (2007a). cGreen (2007b). dGreen (2007b). eGreen (2008a). fBased on reported size 3.5 months before periapse (Green 2008b), while occultation took place 3.5 months after periapse.
Download table as: ASCIITypeset image
Along with comparison spectra, Holmes was observed directly in emission with ARCES soon after its initial expansion to know which molecules were actually present in the comet. The dates of the observations along with a description of the target, the distance from the comet nucleus during observation, an estimate of the gas extent from the nucleus using an expansion velocity of 1.0 km s−1 for Comet Holmes (Drahus et al. 2008) and a velocity of 0.78 km s−1 for Comet Boattini (Lovell & Howell 2008), as well as the visual size of the coma are given in Table 1.
Because β Per is an eclipsing binary, care was taken to only compare the occulted spectrum with a comparison spectrum of β Per taken at the same phase. Table 1 lists the observations of β Per and the corresponding eclipse phase at the beginning of observations. We used the ephemeris given by Kreiner (2004). Looking at published phase diagrams for β Per (e.g., Richards et al. 1988), it appears as though a difference in phase of 0.03 between our occultation and calibration spectra would not substantially cause differences in stellar lines. We see no evidence in the final divided spectrum of residual stellar features that would be due to a phase mismatch. Any residual stellar features would always appear as emission next to absorption and would be easily recognized. To quantify any noise introduced in the final divided spectrum due to the phase mismatch, the signal to noise in the final divided spectrum was compared to the average of the two signal-to-noise values from the occulted and comparison spectrum. On average the signal to noise in the divided spectrum was 0.8 times the average signal to noise in the two original spectra. Supposing both occultation and comparison spectra had the same signal to noise (which is nearly the case here), the divided spectrum would have 1/ or ∼0.7 times the signal to noise in the raw spectra. We therefore conclude that there was no substantial loss in spectral quality due to the small phase difference in our observations of β Per.
Infrared photometry was taken of BD+22 216 during and after the occultation using the Near-Infrared Camera and Fabry–Perot Spectrometer (NICFPS; Hearty et al. 2004) at APO in an attempt to measure the comet extinction. Data were also taken by Montalto et al. (2008) to measure the extinction due to Comet Holmes.
4. DATA REDUCTION
The ARCES echelle data reduction is non-standard and is described in great detail in Thorburn et al. (2003). Briefly, IRAF procedures are used to clip and bias subtract the exposures. They are then magnified along the dispersion access to reduce aliasing and the orders are extracted. After extraction the data are flat-fielded, continuum fitted, a wavelength scale is added from a Th/Ar lamp exposure and the orders are combined into a blazeless sum. To obtain the final comet spectrum, the reduced blazeless sums from the occultation and the calibration exposures are cross-correlated and divided.
The stellar and interstellar lines are very well removed using this method, especially when using earlier type stars. Figures 1–3 show the occulted and unocculted spectra along with the divided spectrum for all three occultations. In the 31 and β Per exposures, areas with stellar or interstellar lines have no additional noise in the divided spectrum than areas without. Since BD +22 216 is a later-type star, there is imperfect division which contaminates the final comet spectrum. These contaminations however, are easily spotted by examining the divided, occulting and non-occulting spectra simultaneously and can be identified as stellar in origin. Areas with telluric contamination do not divide well as telluric contribution varies nightly. In principle, the telluric lines could be removed during the reduction process, but that was not done in our case. Therefore, we did not examine the comet spectrum in areas of telluric contamination with the exception of measuring the 6280 Å DIB which was done by fitting Gaussian profiles to the DIB and all telluric lines in the separate occulting and comparison spectra.
Reduction of the NICFPS infrared photometry was performed using IDL programs expressly written for NICFPS reduction. These programs compute a median dark, create a sky image from the median of the object exposures (since the exposures were dithered). A flat field is then created from the dark and sky images, which is acceptable as the IR sky is uniform enough to allow this. The sky and dark frames are then subtracted from the image which is then divided by the flat field. The program also removes non-Gaussian noise on a line by line basis and corrects for a slight warp in the NICFPS focal plane. The photometry on the reduced images was obtained using the IRAF routine QPHOT. To obtain the extinction in each band, we found the difference in magnitudes between the occultation and calibration magnitudes. Assuming the interstellar extinction is constant, all extinction observed would be due to comet material in the line of sight.
5. ANALYSIS
Each occultation spectrum was systematically searched for comet signatures. The direct emission spectrum of Comet Holmes taken at APO shows the comet had emission lines from C2, C3, CH, CN, CH+, and other typical comet and interstellar features (Figure 4). Because we know these molecules are present in Comet Holmes, we should detect absorption lines from ground state transitions of these molecules in the occultation spectrum. Comet Boattini was not as well studied as Comet Holmes, we did not obtain an emission spectrum from APO, and the only molecule detection reported was OH by Lovell & Howell (2008).

Figure 4. Emission spectrum of Comet Holmes showing (1) the detected C2 Swan 0-0 band, (2) the C3 A-X 000-000 band, (3) the CN violet B-X 0-0 band, and (4) the lack of detection for the DIB most strongly correlated with interstellar C2. All spectra were taken on 2007 October 30 07:23:37 UT with a beam size of about 7100 km2 at the distance of the comet.
Download figure:
Standard image High-resolution imageSearches for absorption features of C2, C3, CH, CN, and CH+ in both comets were unsuccessful, and therefore we place upper limits for each of these species (Table 2). The upper limits were obtained from the divided occultation spectrum in the following way. Assuming the limit of detection of each molecule is a line two resolution elements wide (m = 2 × 2.5 pixels per resolution element for ARCES) the equivalent width for a line just barely resolved is given by
Here, Δλ is the resolution of the telescope. Because we are in the limit of τ ≪ 1 the equivalent width is directly related to the density in each rotational level by
where f is the rotational oscillator strength of the transition. We present an upper limit for each molecule in the rotation state that would be most highly populated given an equilibrium temperature for the comet. The equilibrium temperature was computed using
where S0 is the solar constant at 1 AU (1361 W m−2; Kopp et al. 2005), d is the heliocentric distance to the comet (in AU), a is the albedo, assumed to be 4% (a typical albedo, Lamy et al. 2004), and σ is the Stefan–Boltzmann number. The most populated rotational state was computed using
Here, k is Botzmann's constant and B is the average rotational constant of the upper and lower electronic states of the transition.
Table 2. Upper Limits for Molecules
| Molecule | Max J | Wavelength | S/N | 2σ Wλ | N |
|---|---|---|---|---|---|
| (Å) | (mÅ) | (cm−2) | |||
| 31 Per | |||||
| H i | 4.1 × 10¹⁰ | ||||
| C3 | 12 | 4051.929 | 457 | 0.44 | <3.8 × 10¹¹ |
| C2 | 6 | 8767.759 | 254 | 0.78 | <1.6 × 10¹² |
| CH | 1.5 | 4296.661 | 443 | 0.45 | <4.9 × 10¹¹ |
| CH+ | 2 | 4239.370 | 454 | 0.44 | <1.0 × 10¹² |
| CN | 5 | 3871.364 | 337 | 0.59 | <2.6 × 10¹¹ |
| Beta Per | |||||
| H i | 3.2× 10¹⁰ | ||||
| C3 | 12 | 4051.929 | 404 | 0.49 | <4.3 × 10¹¹ |
| C2 | 6 | 8767.759 | 331 | 0.60 | <1.3 × 10¹² |
| CH | 1.5 | 4296.661 | 437 | 0.46 | <5.0 × 10¹¹ |
| CH+ | 2 | 4239.370 | 440 | 0.45 | <1.0 × 10¹² |
| CN | 5 | 3871.364 | 360 | 0.56 | <2.4 × 10¹¹ |
| Comet Boattini | |||||
| H i | 9.8 × 10⁹ | ||||
| C3 | 12 | 4051.929 | 70 | 2.84 | <2.4 × 10¹² |
| C2 | 6 | 8767.759 | 94 | 2.12 | <4.4 × 10¹² |
| CH | 1.5 | 4296.661 | 60 | 3.31 | <3.6 × 10¹² |
| CH+ | 2 | 4239.370 | 52 | 3.87 | <8.9 × 10¹² |
| CN | 6 | 3870.657 | 36 | 5.62 | <1.4 × 10¹¹ |
Download table as: ASCIITypeset image
All upper limits are from transitions from the ground electronic state. When there was more than one electronic and vibrational transition to choose from (i.e., the red and violet CN transitions each with many different bands), we chose the transition with the highest oscillator strength so as to give the strictest upper limits. Because C2 is a homonuclear diatomic molecule, the rotational population does not follow a Boltzmann distribution, as is assumed in Equation (8), but rather depends both on temperature and the radiation field. However, for the sake of simplicity and consistency we assume that the most populated J state is given by Equation (8) and report an upper limit for that rotation state. Nevertheless, since the C2 transition is an A1 ← X1 transition, each line in the Q branch has the same oscillator strength and therefore our upper limit holds for any max j⩾ 2. We do not compute a total column density since at these temperatures, most of the molecules have a complicated rotational population that does not warrant the calculation for simply reporting an upper limit.
The oscillator strengths for the rotational transitions were calculated by multiplying the vibrational oscillator strengths by the H nl–London factor. Table 3 gives the transition, band oscillator strength, and H
 nl–London factor for the molecules for which we give upper limits.
Table 3. Molecular Transitions
| Molecule | Transition | Band Oscillator Strength | H nl–London Factor nl–London Factor |
Reference |
|---|---|---|---|---|
| C3 | A1Π← X 1Σ+ 000–000 Q(12) | 0.016 | 0.5 | 1 |
| C2 | A1Π← X 1Σ+ 2–0 Q(6) | 0.001424 | 0.5 | 2 |
| CH | A2Δ← X1Π 0–0 R2cd +R2dc | 0.00563 | 0.5 | 3 |
| CH+ | A1Σ+← X1Π 0–0Q(2) | 0.0055 | 0.5 | 4 |
| CN | B2Σ+← X2Σ+ 0–0 R1(5,6) | 0.0342 | 0.51(J = 5), 0.92(J = 6) | 5 |
References. (1) Oka et al. 2003; (2) Schmidt & Bacskay 2007; (3) Hsu & Smith 1977; (4) Welty et al. 2006; (5) Jackson 1974.
Download table as: ASCIITypeset image
While the January 23 occultation yields the strictest upper limits, these results must not be taken as being very strict, as even the visual portion of the coma was occulting the star on the date of the comparison, "off comet," spectrum taken on January 20. Therefore, the divided spectrum does not represent the optical depth at that location, but rather a difference in optical depths from the different locations of the coma that were occulting on the different nights,
Therefore, the divided spectrum gives
Thus, the upper limit represents the difference in optical depth at 1.7 million km and 2.9 million km (corresponding to the distances between β Per and the comet nucleus on January 20 and January 23).
Using a two (H2O → OH + H) and three (H2O → OH → O + H) generation Haser model (Haser 1957) incorporating secondary product velocities (e.g., Combi et al. 2004), we can estimate the H i column density in the comet toward the background star. We assumed the hydrogen production rate varies as Q0r−3h (Combi et al. 2000) and used an average of the production rates from Schleicher (2007) and Dello Russo et al. (2008) for Comet Holmes and the production rate from Lovell & Howell (2008) for Comet Boattini. Table 2 gives the results for this calculation and shows H i column densities that are about 10 orders of magnitude lower than interstellar sight lines with DIBs (Herbig 1993).
A'Hearn et al. (1995) find that the production rates of molecules like C2, CN, and C3 are between 2% and 9% of OH production rates. The H i production rate is comparable to QOH, but slightly higher due to OH dissociation as well as hydrocarbon dissociation. Therefore, we assume that other molecules in the comets are present at about 1% the abundance of hydrogen. This implies that the column densities of the diatomics we searched for are at least 3 orders of magnitude below our detection limit, likely more as the scale heights for these molecules are much lower than the hydrogen scale height. Looking at Haser models of molecules like C2 (e.g., Cochran 1985) shows that in order to have column densities at our threshold limit of about 1011 cm−2 we need to observe a background star with a projected distance from the nucleus of less than about 104 km.
6. RESULTS
All spectra were searched for changes in each DIB listed in Hobbs et al. (2008, 2009). The two Hobbs atlases are the most comprehensive in the literature, and include DIBs not previously noted. We expect that any DIBs present in comets would include the strongest DIBs that are well represented in almost any sight line, so these atlases are adequate for the present purpose.
No significant changes in any DIBs were seen during any occultation. Figures 2–4 show the occultation spectra of the DIBs at 4963, 5780, and 6613 Å. The 4963 Å DIB has been shown by Thorburn et al. (2003) to be the strongest DIB correlated with the C2 molecule in diffuse clouds. On the other hand both the 5780 and 6613 Å DIBs are among the strongest DIBs and are correlated with neutral hydrogen column density but show little if any such relationship to molecules (S. D. Friedman et al. 2010, in preparation; Welty et al. 2006). The 31 Per spectra show the 5780 and 6613 DIBs present in both the calibration and occultation spectra, however there is no significant difference in the equivalent width in the two spectra and there is no evidence of a DIB in the divided comet spectrum. It appears that there may be a signature of the 5780 DIB in both the comparison and occulted β Per spectrum, which is inconsistent with the lack of any reported detection of optical interstellar lines such as Na and Ca ii (Welsh et al. 1990; Vallerga et al. 1993) and the dip in the spectra is not at the correct wavelength for the 5780 DIB. However, our observations, which have higher signal to noise, show Na i absorption and DIBs have been detected in sight lines with a reddening below 0.06 (e.g., Kumar 1986; Galazutdinov et al. 1998). Nevertheless, there is no significant change in this feature and no signature of the DIB in the comet absorption spectrum. The BD +22 216 spectrum shows possibly the 5780 and 6613 DIBs in both spectra, although they could be confused with stellar lines. However, in the divided spectrum there is no residual absorption lines indicative of DIBs in the comet.
Photometric occultation measurements performed by Montalto et al. (2008) show that the extinction produced by the comet grains strongly matches standard ISM extinction. Figure 5 plots the measured extinction in the B, V, and I bands for HD 23676, a star occulted on 2007 October 28, along with a typical ISM extinction curve taken from Draine & Lee (1984). This indicates that there is a subset of grain sizes that are similar in both the ISM and the comet. Therefore, if the DIB carriers are associated with this subset of grains, they should be present in the comet even with the low H i column density that we measured since the gas to dust ratio in comets is much higher than in the ISM. From these measurements, we estimate a reddening EB−V = 0.09 for the comet at the location where we measured this extinction (∼106 km). This reddening is uncertain due to high estimated errors in the magnitude calculations, but there is still significant extinction in the B and V bands, consistent with dust grains attenuating the background stellar light. While DIBs are usually studied in highly reddened sight lines, they have been detected in sight lines with extinction as low as we see in the comet (Kumar 1986; Galazutdinov et al. 1998).

Figure 5. Extinction plot with 1σ error bars of Comet Holmes as measured by an occultation of CCDM J03492+5023AB in the B, V, and I bands on 2007 October 28. Data are from Montalto et al. (2008) and M. Montalto (2008, private communication).
Download figure:
Standard image High-resolution image
It has long been known that extinction correlates with DIB strength (e.g., Merrill & Wilson 1938; Herbig 1995) and this can be used to compute expected equivalent widths for the DIBs in the comet. We used relationships determined by a least-squares fitting of observed equivalent widths and extinction values of many (>63) sight lines observed at APO (see S. D. Friedman et al. 2010, in preparation; McCall et al. 2009 for details). These expected equivalent widths can be compared to the 2σ equivalent widths measured in our Comet Holmes occultation spectra. The upper limits are calculated using an equivalent width Wλ = (1.064 × FWHM)/(S/N) (Hobbs et al. 2008). We assumed an intrinsic FWHM of the DIBs tabulated in Hobbs et al. (2008). Table 4 lists both the measured upper limit and the expected equivalent width based on the extinction, the corresponding signal to noise and FWHM used. It also gives the measured equivalent widths for two stars in our DIB database, HD 35149 (a C2 DIB star, see Thorburn et al. 2003) and HD 24760, which have extinction comparable to the comet extinction. Finally, Table 4 shows two of our standard DIB stars, HD 204827 (Hobbs et al. 2008), a C2 DIB star (Thorburn et al. 2003), and HD 183143 (Hobbs et al. 2009) whose equivalent widths have been scaled down to a reddening equal to the comet extinction.
Table 4. Upper Limits on DIBs
| DIB λ | S/N | 2σ Wλ | Expected Wλ | HD 204827 | HD 35149 | HD 183143 | HD 24760 |
|---|---|---|---|---|---|---|---|
| (Å) | (mÅ) | (mÅ) | Scaleda Wλ | Wλ | Scaleda Wλ | Wλ | |
| EB−V = 1.11 | EB−V = 0.11 | EB−V = 1.27 | EB−V = 0.1 | ||||
| Comet Holmes | |||||||
| 31 Per | |||||||
| 4428 | 464 | 103.1 | 73.1 | 99.0 | 0 | 403.9 | 0 |
| 4727 | 484 | 12.0 | 27.0 | 23.0 | 45 | 11.1 | 34 |
| 4963 | 481 | 2.7 | 1.5 | 4.3 | 2.2 | 1.9 | 0 |
| 5780 | 371 | 12.1 | 47.1 | 20.8 | 57 | 55.2 | 81 |
| 5797 | 358 | 4.6 | 18.1 | 16.1 | 15.7 | 13.2 | 22 |
| 6196 | 569 | 1.6 | 6.2 | 3.1 | 5.5 | 6.4 | 7.3 |
| 6283 | 434 | 23.4 | 174.0 | 37.3 | 286 | 133.5 | 283 |
| 6379 | 353 | 3.5 | 5.3 | 7.7 | 6.1 | 7.5 | 8 |
| 6613 | 432 | 4.6 | 13.9 | 13.4 | 21.7 | 24.2 | 19.5 |
| β Per | |||||||
| 4428 | 402 | 119.0 | 73.1 | 99.0 | 0 | 403.9 | 0 |
| 4727 | 544 | 10.7 | 27.0 | 23.0 | 45 | 11.1 | 34 |
| 4963 | 53 | 2.5 | 1.5 | 4.3 | 2.2 | 1.9 | 0 |
| 5780 | 492 | 9.1 | 47.1 | 20.8 | 57 | 55.2 | 81 |
| 5797 | 452 | 3.6 | 18.1 | 16.1 | 15.7 | 13.2 | 22 |
| 6196 | 619 | 1.4 | 6.2 | 3.1 | 5.5 | 6.4 | 7.3 |
| 6283 | 448 | 22.7 | 174.0 | 37.3 | 286 | 133.5 | 283 |
| 6379 | 470 | 2.6 | 5.3 | 7.7 | 6.1 | 7.5 | 8 |
| 6613 | 577 | 3.4 | 13.9 | 13.4 | 21.7 | 24.2 | 19.5 |
| Comet Boattini | |||||||
| 4428 | 94 | 509.9 | ... | ... | ... | ... | ... |
| 4727 | 109 | 53.4 | ... | ... | ... | ... | ... |
| 4963 | 163 | 8.1 | ... | ... | ... | ... | ... |
| 5780 | 225 | 20.0 | ... | ... | ... | ... | ... |
| 5797 | 178 | 9.2 | ... | ... | ... | ... | ... |
| 6196 | 200 | 4.5 | ... | ... | ... | ... | ... |
| 6283 | 208 | 48.9 | ... | ... | ... | ... | ... |
| 6379 | 152 | 8.1 | ... | ... | ... | ... | ... |
| 6613 | 172 | 11.5 | ... | ... | ... | ... | ... |
Note. aEquivalent widths are scaled to a reddening equal to the comet reddening of 0.09.
Download table as: ASCIITypeset image
The 2σ upper limits on the equivalent widths are on order the same or lower than what would be expected based on the Wλ E(B − V) correlations and the equivalent widths of sight lines with similar extinction. This could imply that we should have detected the DIBs if they were present. However, given the uncertainties in the measured extinction, in the intrinsic scatter in the Wλ E(B − V) correlations (see Krełowski et al. 1987, 1999 for examples), and the fact that the extinction could have changed between when it was measured in October and when the occultations occurred in late November and January, we cannot reject the hypothesis that DIBs are absent in the comet.
The calculated H i column density does not match the reddening seen in the comet if one uses correlations expected from ISM material. If we used H i column density correlations to compute expected DIB equivalent widths they would be orders of magnitude lower than those computed from extinction correlations. However, the same would be true if we tried to compute an expected column density of any molecule seen in comets. This is due to the fact that (1) there is a much larger gas to dust ratio in comets than in the ISM and (2) hydrogen is not the main constituent of comets as it is in the ISM. We have therefore used the DIB extinction correlations to compute our upper limits rather than the DIB H i column correlations.
Attempts were also made to measure extinction in Comet Boattini. Infrared photometry was taken of the BD+22 216 occultation. The J, H, and Ks bands were measured before and during the occultation to determine the extinction caused by Comet Boattini. Table 5 shows the measured magnitudes for both the Holmes and Boattini photometry. There was no measurable extinction of BD+22 216 due to the comet in the near IR, indicative of either very large particles, or, more likely, not a substantive abundance of dust particles from the comet were in the line of sight.
Table 5. Extinction Measurements for Comets Holmes and Boattini
| Comet Holmesa | Comet Boattini | ||
|---|---|---|---|
| Band | ΔM | Band | ΔM |
| B | 0.386 ± 0.1 | J | −0.033 ± 0.062 |
| V | 0.297 ± 0.1 | H | −0.001 ± 0.064 |
| I | 0.063 ± 0.1 | Ks |  0.046 0.046 |
Note. aData are from Montalto et al. (2008) and M. Montalto (2008, private communication).
Download table as: ASCIITypeset image
7. DISCUSSION
There are a number of possible reasons for why our observations did not result in a detection of the comet. However, most likely it appears that the comet was not close enough to the line of sight of the star to provide high enough gas density to be detectable.
Drahus et al. (2008) observed that the gas expansion velocity was approximately 1 km s−1 as measured from the CS (3–2) and the strongest HCN (1–0) lines around 150 and 880 GHz, respectively, from Comet Holmes. If we assume a uniform expansion, which is warranted by both dust expansion rate measurements and photometry showing a quasi spherical morphology carried out by Montalto et al. (2008) and Mugrauer et al. (2009), the gas should have been about 2 × 10⁶ km from the nucleus during the occultation of 31 Per, assuming the expansion started on October 25 (see Table 1). Since errors for this are difficult to quantify because there is only one published value for the gas expansion taken recently after the initial expansion (from 2007 October 25 to October 31), it is quite possible the gas was simply not in the line of sight toward the star. Continuing with the assumption of a uniform expansion, it is only at the time of our January 20 and January 23 observations that the gas would be in the line of sight, but even in this case we did not detect any comet signatures. By this time it is possible that the molecules we were searching for had been dissociated by solar UV light, that their concentrations were too low to be detectable, or that the gas only underwent uniform expansion for a certain small period of time. Nonetheless, we do know from visual reports of the coma size (Table 1) that the coma was large enough that the gas was in the line of sight of the star.
Lovell & Howell (2008) gave a 0.78 km s−1 gas expansion velocity for comet Boattini measured from 18 cm OH lines in July of 2008. For lack of any supporting observations, we use the same assumptions as above (e.g., uniform and constant expansion) to estimate that the gas from the comet should have reached 1.7 × 10⁶ km from the nucleus during the occultation. As the closest approach of the Boattini occultation was about 2.5 × 10⁵ km the gas should have been along the line of sight given our assumptions. These assumptions are not necessarily valid as expansion velocities typically vary both with distance from the nucleus and heliocentric distances (Combi et al. 2004). We are therefore not able to definitively determine if the comet coma did in fact occult the background star. However, given that we observed no dust extinction, it is likely either there was no gas toward the line of sight or that the molecular densities were too low to be detected. Future occultation observations should include mapping of the comet to avoid the uncertainty of whether or not gas is present in the line of site.
Models and observations (e.g., Ellis 2008) show that the abundance of C2 and CN are reduced to below 1% of their peak intensity after about 105 km out from the nucleus. As the closest approach to the line of sight toward the background star was over 2 × 10⁵ km during all occultations, it is not surprising to see no detection of the traditional comet lines. Table 1 shows that during the β Per and BD +22 216 observations, the estimated gas extent is large enough that there should have been gas in the line of sight toward the star. However, the low H i column density estimates from our Haser model indicate the gas was simply too tenuous for any molecules or DIBs to be detected.
8. CONCLUSIONS
Observations of the occultations of 31 and β Per by Comet 17P (Holmes) and the occultation of BD+22 216 by Comet C/2007 W1 (Boattini) resulted in no detection of both standard cometary molecules in absorption and any diffuse interstellar band. It appears this is most probably due to a combination of the gas not being far enough away from the nucleus to be in the line of sight toward the background star, as is the case for the 31 Per occultation, and the gas when present, as is most likely the case for the β Per and BD+22 216 occultation, is so diffuse that the density is below the threshold detection.
The extinction produced by the dust form Comet Holmes was measured on October 28 with a value of E(B − V) = 0.09. Interstellar sight lines with comparable extinction have DIB strengths between 5 and 50 mÅ. A simple Haser model shows that the hydrogen column density at the locations of our spectra (105–106 km from the nucleus) are too low to detect molecules or DIBs. Therefore, future occultation observations will likely have to be closer than 104–103 km. In order to detect any weak DIBs, observations will require a signal to noise in the background star of at least 300, corresponding to a 3σ DIB equivalent width limit of 5 mÅ assuming a FWHM of 0.5 Å. Finally for comparison with other molecules present in the coma, which could give insight into the DIB carriers, observations should be taken with spectrograph of resolving power of at least 38,000 so that the rotational lines of C2, C3, CN, and other molecules and atomics viewable in the visible can be resolved and therefore accurate measurements of their column densities can be made.
While these observations were unsuccessful, observations of comets during closer occultations have the potential to provide information on the spatial distribution of cometary gas material as well as providing a better opportunity to search for DIBs in comets.
Depending on how close the comet nucleus needs to get to the background star to see the comet in absorption, stellar occultations by comets may be common enough for extensive future study. We can roughly estimate the frequency of suitable occultations in the following way. We begin by assuming that the comet comes within 100 arcsec of a background star that is sufficiently bright (<9.0 mag) and has an F or earlier spectral type, that the stars are uniformly distributed and that the comet transverses 10 degrees across the sky while it is sufficiently close to Earth. A 9.0 mag cutoff was used in this calculation because it is about the magnitude limit needed at the Apache Point Telescope to obtain a high enough signal to noise in a short (∼30 minutes) exposure. With the above assumptions there is one such star every 0.68 square deg and the occultation region spans 0.56 square deg resulting in a 56% probability of finding a suitable background star. However, for ground-based observations, half or less of these occultations will occur during the day and an additional half will be in the wrong hemisphere. We therefore estimate only 14% (25% × 56%) of occultations are observable from ground based telescopes. There are many comets that come within 1 AU of Earth every year; for instance, in 2009 there were seven. Using that as a typical number there should be an observable occultation about once every three years. This is a very rough estimate. For instance, most early-type stars are not uniformly distributed but are located in the galactic disk, furthermore the distance of a comet's path in the sky is highly variable. Nonetheless, this estimate indicates that comet occultations are not once in a lifetime opportunities, but rather can be studied and pursued more frequently.
Further occultation observations of comets should allow us to place more constraints on DIBs in comets. If DIBs continue to be elusive in comets this could imply they were not present in the pre-solar nebula, or that they were subsequently destroyed during formation of comets or that they were destroyed only within a certain region of the nebula. Observations of long period comets are essential to this process as they are thought to represent unaltered primordial material (e.g., Whipple 1951). These could all be keys in unlocking the DIBs mystery.
The authors thank Dr. Marco Montalto of the Max Planck Institute for his willingness to share his data with us and for doing some additional calculations which allowed us to obtain the Holmes extinction plot. We also thank Gabrelle Saurage and Russet McMillan, the operators at the Apache Point Observatory during our observations, for their assistance in obtaining our data. Finally, we thank Dr. Paul Feldman of John Hopkins University for his suggestions and comments. This work was supported by NASA grants NNX08AC146 and NA55-98043 to the University of Colorado at Boulder. This research has made use of the SIMBAD database, operated at CDS, Strasbourg, France.
Facilities: ARC - Astrophysical Research Consortium 3.5m Telescope at Apache Point Observatory