


Abstract
The primary goal of this study is to investigate the effect of increasing battery size and driving range to the environmental impact of electric vehicles (EVs). To this end, we compile cradle-to-grave inventories for EVs in four size segments to determine their climate change potential. A second objective is to compare the lifecycle emissions of EVs to those of conventional vehicles. For this purpose, we collect lifecycle emissions for conventional vehicles reported by automobile manufacturers. The lifecycle greenhouse gas emissions are calculated per vehicle and over a total driving range of 180 000 km using the average European electricity mix. Process-based attributional LCA and the ReCiPe characterisation method are used to estimate the climate change potential from the hierarchical perspective. The differently sized EVs are compared to one another to find the effect of increasing the size and range of EVs. We also point out the sources of differences in lifecycle emissions between conventional- and electric vehicles. Furthermore, a sensitivity analysis assesses the change in lifecycle emissions when electricity with various energy sources power the EVs. The sensitivity analysis also examines how the use phase electricity sources influences the size and range effect.
Export citation and abstract BibTeX RIS

Original content from this work may be used under the terms of the Creative Commons Attribution 3.0 licence. Any further distribution of this work must maintain attribution to the author(s) and the title of the work, journal citation and DOI.
1. Introduction
The number of light duty vehicles (LDVs) is currently around one billion globally and is expected to double in the next few decades (Sousanis 2011). As LDVs already consume around one-fourth of global primary oil (Sims et al 2014), the predicted growth in LDVs forecasts an increase in fossil fuel consumption and greenhouse gas (GHG) emissions. The fifth IPCC report stresses that without aggressive and sustained mitigation policies being implemented, transport emissions could rise at a faster rate than emissions from the other energy end-use sectors (Sims et al 2014). As a measure to reduce combustion of fossil fuels and thereby mitigate climate change, many governments have introduced favourable policies to promote market uptake of electric vehicles (EVs). Contrary to conventional vehicles that rely on combustion of fossil fuels for propulsion, EVs use electricity and, typically, lithium ion (Li-ion) batteries for electricity storage. As a result, EVs have no tailpipe emissions. However, the indirect emissions due to electricity generation can be significant depending on energy sources (Faria et al 2012, Hawkins et al 2012). Thus, EVs have the potential to reduce GHG emissions, but a lifecycle perspective is required to obtain knowledge of the full carbon footprint of EVs.
Lifecycle assessment (LCA) can contribute to comprehensive environmental understanding, thus avoiding problem shifting. Although LCA studies have assessed EVs and Li-ion batteries, the assessments are limited to small to medium sized EVs and batteries (Bauer 2010, Notter et al 2010, Zackrisson et al 2010, Majeau-Bettez et al 2011, Dunn et al 2012, Faria et al 2012, Hawkins et al 2012, Ellingsen et al 2014, United States Environmental Protection Agency 2013, Dunn et al 2015, Li et al 2014). However, EVs are no longer limited to small city cars as the availability of EVs with increasing battery sizes and driving ranges is growing. Knowing how EVs perform across different size segments and against similar sized ICEVs is necessary to support policy and technology developments.
The primary objective of this study is to find out how much increasing the size and range of EVs affects the lifecycle climate change potential (CCP) of EVs in a European context. For this purpose, we assess the cradle-to-grave GHG emissions of EVs in four different size segments. A second objective is to find out how the EVs perform environmentally compared to similarly sized conventional vehicles. In this way, the study will offer an improved understanding of the state of current EVs. The article is divided into five sections, including this introduction as section 1. Section 2 outlines the EV data that provided the background for the scope of the study and describes the method for calculating the CCP. Section 3 presents the results of the main analysis as well as the sensitivity analysis. In section 4, we discuss our findings and key parameters related to the presented work. Furthermore, we compare our results to findings reported by previous academic studies as well as industry reports. Lastly, in section 5, we sum up the findings of our study and formulate the conclusions of the study.
2. Scope and method
In this section, we first present data for available EVs and explain how the data enabled us to establish essential parameters for our study. Then, we turn to the compilation of the lifecycle inventories. Lastly, we explain how LCA results for conventional vehicles were obtained.
To get an overview of available EVs and determine what size segments to assess, we collected data on EVs powered by Li-ion batteries. Data collection was limited to models that stated driving range according to the new European driving cycle (NEDC). For twenty EVs, we obtained curb weight (kg) and NEDC energy requirement (kWh km−1). For conventional vehicles, the vehicle weight and the fuel consumption are strongly coupled (Modaresi et al 2014). We plotted energy requirement as a function of curb weight (figure 1). Although energy requirement is affected by a number of technology features other than vehicle mass (Kim & Wallington 2013), we assumed a linear regression curve. The resulting slope yields an increase in energy requirement of 5.6 Wh km−1 per 100 kg additional weight.
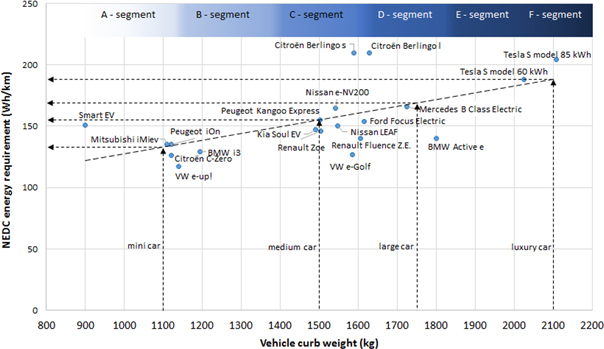
Figure 1. NEDC energy requirement of EVs as a function of vehicle curb weight.
Download figure:
Standard image High-resolution imageWith figure 1 as a starting point, we decided tomodel four EV sizes: mini car (A-segment), mediumcar (C-segment), large cars (D-segment), and luxurycar (F-segment). Curb weights similar to existing carsmodels were chosen. Using regression analysis, the energy requirement of the different EVs was determined. Once curb weight and energy requirement were determined, suitable battery sizes were chosen for the EVs. To calculate the driving range, the battery size was divided byNEDC energy requirement. To calculate the total EV energy requirement we accounted for the efficiency of the charger (96%) and battery (95%). The EV parameters are found in table 1.
Table 1. Electric vehicle parameters.
| Segment | Curb weight (kg) | Battery size (kWh) | Driving range (km) | EV energy requirement (Wh km−1) |
|---|---|---|---|---|
| A—mini car | 1100 | 17.7 | 133 | 146 |
| C—medium car | 1500 | 24.4 | 171 | 170 |
| D—large car | 1750 | 42.1 | 249 | 185 |
| F—luxury car | 2100 | 59.9 | 317 | 207 |
Now that we have decided what size segments to model and established their parameters, we continue on to the lifecycle inventories. Cradle-to-grave inventories were compiled for each of the four EV size segments. To ensure comprehensive understanding of each of the lifecycle phases, the most complete and detailed inventories available on EVs (Hawkins et al 2012) and Li-ion batteries (Dewulf et al 2010, Ellingsen et al 2014) were synthesised and adapted. The cradle-to-gate inventories reflect what can be considered common EV production practice; batteries are produced in East Asia (Ellingsen et al 2014), but vehicle production, as well as assembly, takes place in Germany (Hawkins et al 2012). We adapted the cradle-to-gate inventory published by Hawkins et al (2012) to fit the vehicle (without battery) weight. For the batteries, we modified the lithium nickel-cobalt-manganese oxide battery inventory that we published in Ellingsen et al (2014). For the compilation of the original inventory, we relied on a bill of materials provided by the manufacturer. Since some components do not scale linearly with the number of battery modules, the same bill of materials provided the details required for a more appropriate representation of these components. We received the bill of materials and the data on energy use from the cell manufacturer in 2012. As the weight of the cell is the same today as it was then, it is unlikely that the material inputs have changed. For the electricity use in battery cell assembly however, we expect reduction as the industry strives to reduce its energy usage. After consideration and review of industry reports on EVs (Daimler AG 2012, Volkswagen AG 2013, Daimler AG 2014, Volkswagen AG 2014), we assumed a 50% reduction in electricity usage compared to 2012.
For the EV use phase, we made two key assumptions: lifetime and electricity mix. Lifetime is a parameter that entails uncertainty in impact assessment of vehicles regardless of powertrain configuration. Industry reports most commonly apply an EV use phase of 150 000 km (Volkswagen AG 2012, Daimler AG 2012, Volkswagen AG 2013, Volkswagen AG 2014, Daimler AG 2014, Nissan Motor Co. LTD 2014). The manufacturers are likely to be somewhat conservative regarding the lifetime. We assumed a lifetime of 12 years and a yearly mileage of 15 000 km, resulting in a total mileage of 180 000 km. The total mileage and the EV energy requirement were multiplied to find total EV electricity requirement. We attempted to model EVs in a European context and assumed the average European electricity mix (521 g CO2 kWh−1) (Itten et al 2014) for the use phase. In addition, sensitivity analysis assessed electricity mixes with different carbon intensities.
The inventories for end-of-life (EOL) treatment of the vehicle (without battery) were also weight-based modifications of the inventory published by Hawkins et al (2012). To model EOL treatment of the battery, an inventory was compiled based on the pyrometallurgical treatment described by Dewulf et al (2010). The multi-output process delivers disposal of the battery, a slag containing lithium, manganese, and aluminium, and a liquid alloy containing copper, iron, cobalt, and nickel (Meskers et al 2009, Reuter et al 2012). Consistent with the surplus method (Majeau-Bettez et al 2015), impacts were ascribed entirely to the EOL treatment of the battery. The batteries and the vehicles were not attributed any benefits from the EOL processes. The supplementary data, available at stacks.iop.org/ERL/11/054010, contains more information regarding the inventories.
Impacts were calculated in terms of ton carbon dioxide equivalents (CO2−eq) per vehicle over a lifetime of 180 000 km. The inventories were linked to ecoinvent as a background system (Ecoinvent Centre 2010). Process-based attributional LCA and the ReCiPe characterisation method were used to estimate the climate change potential (CCP) from the hierarchical perspective.
As a point of reference, we also estimated lifecycle impacts of conventional internal combustion engine vehicles (ICEVs). For this purpose, LCA results for production and use of cars in segment A, C, D, and F were collected from LCA reports published by Daimler and Volkswagen. Data collection was limited to models produced from 2010 and newer. Results were gathered for two mini cars (segment A), four medium cars (segment C), four large cars (segment D), and one luxury cars (segment F). To get a larger sample size of the luxury car use phase impacts, we also included use phase emissions (g CO2 km−1) for two other luxury cars. We converted these use phase emissions to use phase impacts (g CO2-eq km−1) by multiplying the emissions (g CO2 km−1) with a conversion factor. The ICEV inventory (Hawkins et al 2012) on EOL treatment was scaled to estimate EOL impacts. For more details regarding the ICEV lifecycle impacts, see the supplementary data. Note that the LCA results for the ICEVs provide an indicative, rather than an absolute, benchmark.
3. Results
In this section, we present the results of the main analysis (figure 2) and the sensitivity analysis (figure 3). First, we highlight the main differences in lifecycle emissions between different car segments and drivetrain technologies. Then, we examine the sources of the observed differences. Lastly, in the sensitivity analysis, we explore the effect of using different electricity mixes for EV charging.

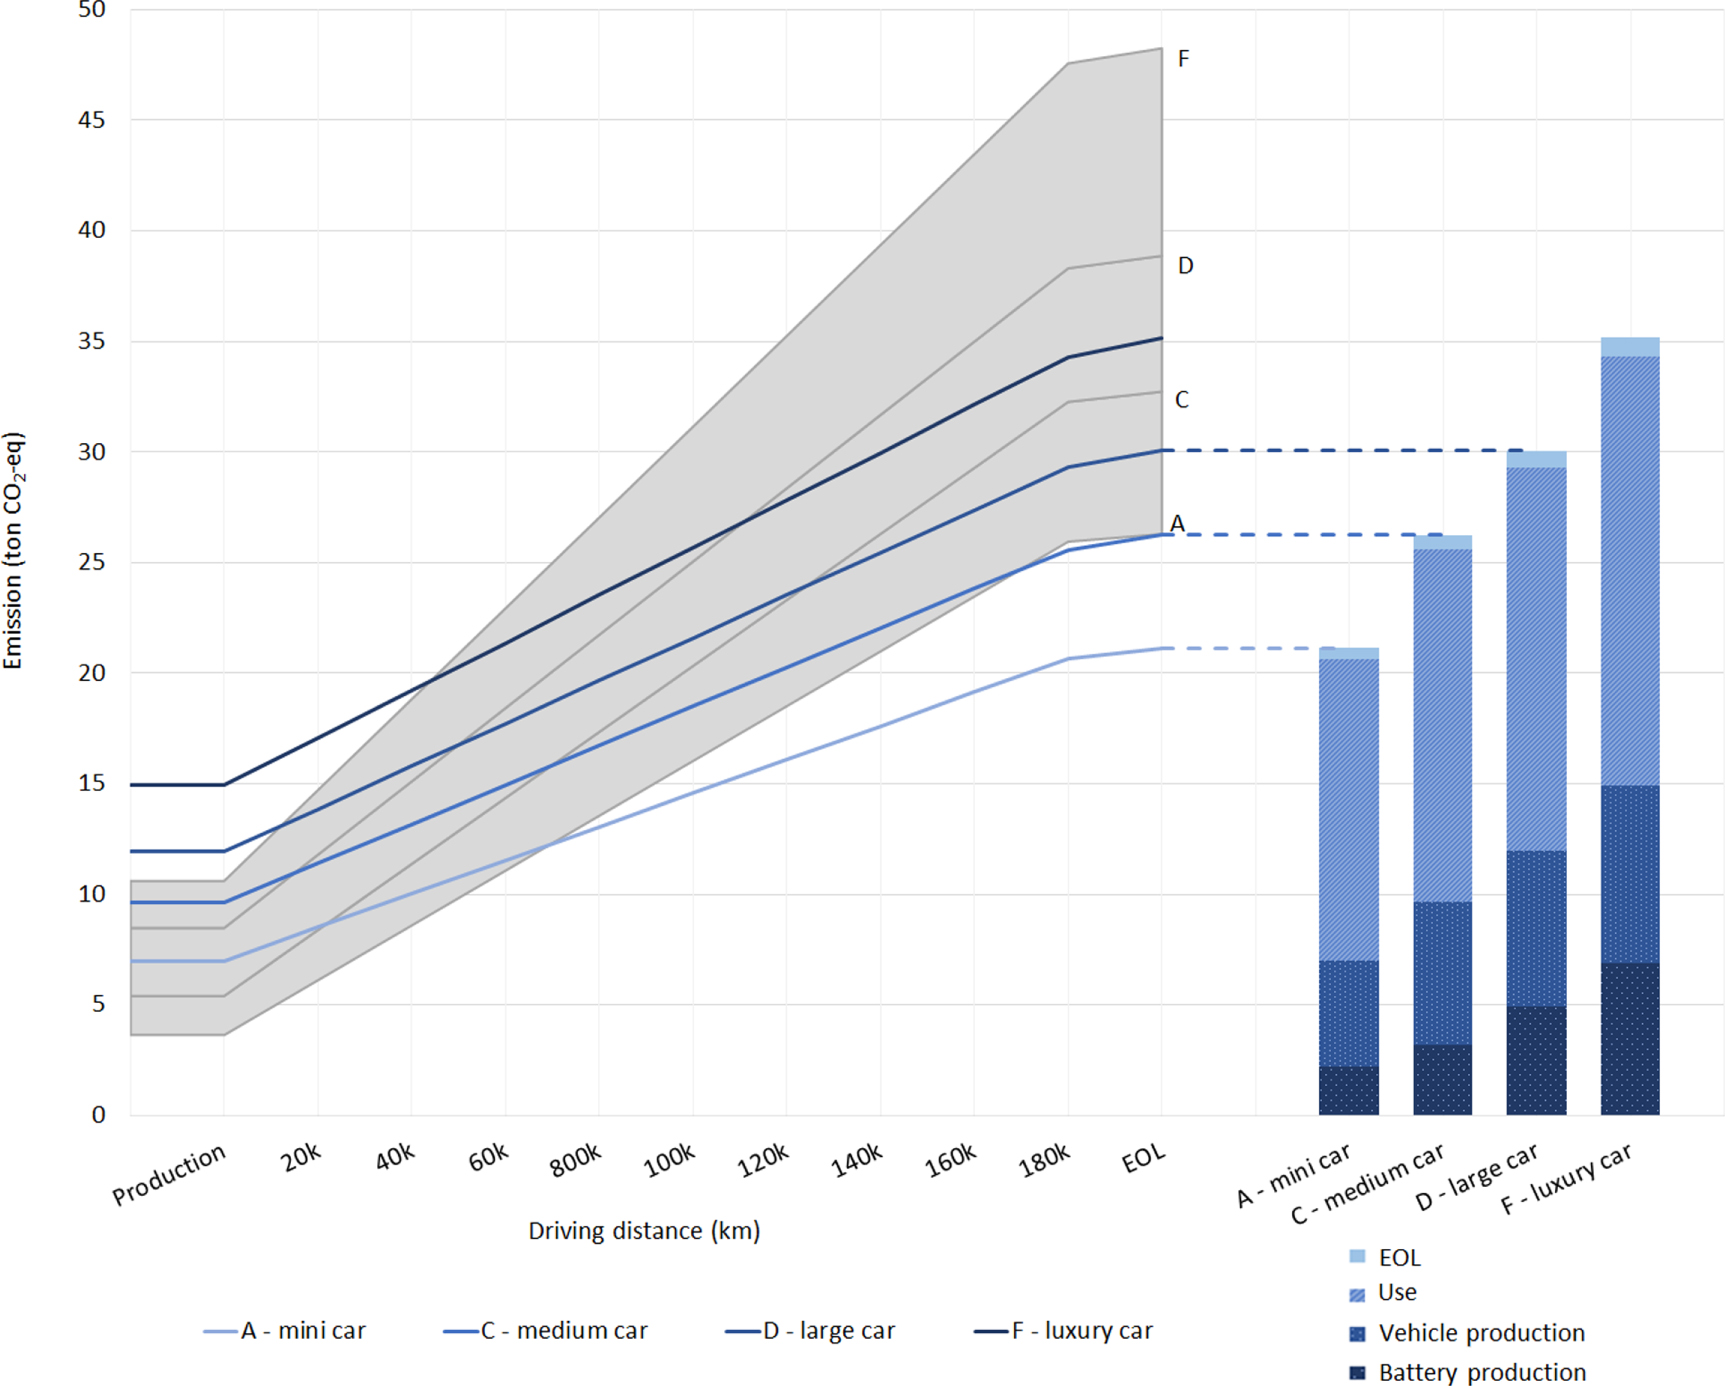
Figure 2. Lifecycle impacts of conventional and electric vehicles. The chart on the left side displays emissions in a cumulative manner with production, use, and end-of-life (EOL) treatment. The grey shaded area, which we refer to as the fossil envelope, indicates the lifecycle GHG emission of the conventional vehicles (segments A, C, D, and F are indicated on the right of the fossil envelope). The EV results are coloured blue. In the column chart on the right, the emissions are broken down in a contributional manner with battery production, vehicle production, use, and EOL treatment.
Download figure:
Standard image High-resolution image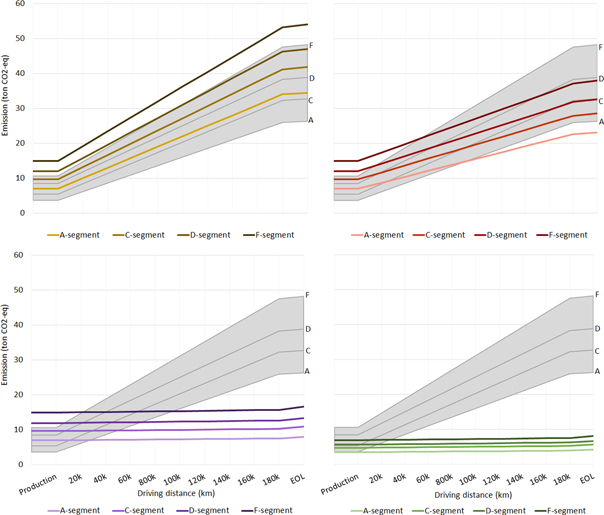
Figure 3. Sensitivity analysis. Electric vehicle lifecycle emissions with use phase electricity based on (a) coal, (b) natural gas, (c) wind, and (d) the prospective green energy scenario where electricity in all lifecycle phases based on wind power.
Download figure:
Standard image High-resolution image
3.1. Lifecycle GHG emission variation with size
Figure 2 compares the different vehicles in terms of lifecycle GHG emissions measured in ton CO2-eq. The figure consists of two charts that share a common y-axis, the impacts. The graph on the left side of figure 2 displays impacts in a cumulative manner over the lifecycle stages production, use, and EOL treatment. The grey shaded area, which we refer to as the fossil envelope, indicates the lifecycle GHG emission of conventional vehicles. The results of our analysis—the lifecycle GHG emissions of EVs—are coloured blue. The column chart on the right side of figure 2 displays the EV emissions in a contributional manner with battery production, vehicle production, use, and EOL treatment.
Across the different segments, there were large variations in lifecycle emissions. Regardless of powertrain configuration, the smaller and more energy efficient vehicles generally performed better than the larger ones did. The factor between the highest and the lowest lifecycle emissions was 1.8 for the ICEVs and 1.7 for the EVs. The EV production phase was more environmentally intensive than that of the conventional vehicles, but the EVs compensated the higher production emissions by having lower use phase emissions. Because of the higher EV production impact, the ICEVs covered considerable distances before their emissions broke even with the EVs. The electric and the conventional cars broke even between 44 000 km and 70 000 km (see figure 2). The larger the EV was, the sooner it was able to make up for the higher production impact. For both the ICEVs and the EVs, the use phase was responsible for much of the GHG emission, whether it was directly through fuel combustion or indirectly through electricity production. Regardless of drivetrain technology, the emissions stemming from the EOL treatment were small compare to the emissions stemming from production and use. The mini and medium EVs (segment A and C) made it below the entire fossil envelope. Although the large and luxury EVs (segment D and F) were within the fossil envelope, they performed better than their conventional counterparts did. When comparing equal sizes, the EVs had 20%–27% lower lifecycle impact than the ICEVs.
The underlying sources of the EV lifecycle emissions differed from the ICEVs. The cradle-to-gate CCP intensity of the EVs was 6.3–7.1 kg CO2-eq kg−1 of car, whereas for the ICEVs it was 3.9–5.7 kg CO2-eq kg−1 of car. The difference in the cradle-to-gate CCP intensity between the EVs and the ICEVs was mainly due to battery production, which caused 31%–46% of the total EV production impact. For both the conventional and the electric vehicles, the energy use and the sources of energy were important factors in the use phase. The EV use phase contributed to 55%–65% of the total lifecycle emissions. Energy losses in the battery and charger were responsible for 4.0% and 5.0%, respectively. As for EOL treatment, the EVs had somewhat higher impact than the conventional vehicles due to EOL treatment of the battery. The battery contributed to 14%–23% of the total EOL treatment emissions of the EVs. Battery contributions to the total lifecycle impact of the EVs varied between 13%–22%. In summary, even though the EVs had higher emissions from production and EOL treatment than the ICEVs had, the EVs compensated by having significantly lower use phase impact.
3.2. Sensitivity analysis
To explore how the carbon intensity of the electricity used for charging influences the lifecycle emissions of EVs, we used electricity based on energy from (a) world average coal (1029 g CO2-eq kWh−1) (Bruckner et al 2014), (b) world average natural gas (595 g CO2-eq kWh−1) (Bruckner et al 2014), and (c) wind (21 g CO2-eq kWh−1) (Ecoinvent Centre 2010). In addition, we assessed (d) a prospective green energy scenario where electricity in all lifecycle phases was based on wind power. This resulted in very low carbon intensity (17 g CO2-eq kWh−1). Figure 3 is divided into four charts, one for each scenario.
Charging the EVs with coal-based electricity made the EV lifecycle emissions 12%–31% higher compared to the conventional vehicles (figure 3(a)). Before, when the EVs were charged with the European electricity mix, the benefit of EVs compared to ICEVs increased with distance, but in this scenario, it was the other way around. The carbon intensity of the electricity based on natural gas is slightly higher than the average European electricity mix. The EVs powered by electricity from natural gas had 12%–21% lower lifecycle impact compared to their conventional counterparts (figure 3(b)). When powered by wind-based electricity, all of the EVs made it below the fossil envelope (figure 3(c)). Compared to the ICEVs, the lifecycle emissions were reduced by 66%–70%. In this scenario, the use phase was of low importance. In contrast, the relative importance of EOL impact increased. We chose to compare the prospective green energy scenario to the reference vehicles in today's fossil envelope and found that the EVs offered 83–84% lower lifecycle impact (figure 3(d)). In the prospective green energy scenario, the production intensity of the EVs was 3.2–3.3 kg CO2-eq kg−1. Battery production now contributed to 23%–34% of total EV production impact (see figure S1 in the supplementary data). The use phase contributed very little to the overall impact. Note that the prospective green energy scenario is not an aim at predicting future EV lifecycle emissions, but rather an indication of where we can hope to land the EV emissions. When we compare the different scenarios presented in figure 3, we find that the absolute differences in lifecycle impact between the size segments became smaller as the carbon intensity of the electricity mixes decreased. In other words, the size and range effect decreased with lower carbon intensity electricity mixes.
4. Discussion
The aim of this study was to investigate the environmental consequences of increasing battery size and driving range and compare the EV lifecycle emissions to those of ICEVs. Regardless of powertrain configuration, a shift from larger to smaller vehicles was found to be beneficial. The EVs charged with the European electricity mix had lower lifecycle impacts than the conventional vehicles (figure 2). However, EVs do not have lower lifecycle impact than ICEVs regardless of size. Although the production impacts of EVs were higher than the production impacts ICEVs, the EVs made up for this by having lower use phase impact. The EV use phase had lower impacts owing to lower energy requirement and cleaner energy sources. The CCP benefits of the EVs increased with distance compared to the conventional vehicles. Because of the battery, the EVs had somewhat higher EOL impact than the ICEVs. The overall contribution of EOL to lifecycle emissions was small.
Several parameters influence the lifecycle impact of EVs. The results of our analysis are indicative and do not represent any specific vehicle make and model. In connection with EV production, variability in EV design and technology is likely to cause some differences in production emissions of EVs. In relation to battery production, we deem the uncertainty associated with the scaling of the cradle-to-gate battery inventory to be relatively small, as the battery cells and the module packaging, which are not subject to scaling errors, contributed to 82%–88% of cradle-to-gate battery emissions. There is however, some uncertainty regarding energy use in battery cell assembly; it may be somewhat higher or lower than what we used in this study. For the use phase, EV energy requirement numbers were based on the linear regression line in figure 1 and energy losses in charger and battery. Even though the assumption of a linear relationship between curb weight and NEDC energy requirement of EVs may not be accurate, the deduced energy requirements were in close agreement with NEDC energy requirement of existing EV models (see figure 1). Therefore, we deem the estimates to be suitable proxies. The NEDC has been criticised for not representing real-life driving. In relation to EVs, the NEDC has also been accused of being biased, both for and against EVs. On one hand, the NEDC test may be performed with all the auxiliaries turned off and the test will therefore not capture parasite loads that increase the energy use of EVs. On the other hand, the test does not fully capture that EVs are less sensitive to stop-and-go traffic than ICEVs are. Until the newly developed Worldwide harmonised Light vehicles Test Procedures (WLTP) comes into widespread use, the NEDC energy requirement numbers offer an unambiguous alternative method for comparison.
Another important use phase parameter for EVs is battery longevity. Studies assessing the environmental impacts of Li-ion batteries have assumed total driving distances between 150 000 km and 200 000 km (Notter et al 2010, Zackrisson et al 2010, United States Environmental Protection Agency 2013, Li et al 2014). Battery warranties for different EV models range from 100 000 km within the first five years to unlimited km within the first eight years (The Norwegian Consumer Council 2014). As the car manufacturers themselves set the warranties, a reasonable assumption is that these warranties represent the minimum of what can be expected from the battery packs. In addition, some vehicle manufacturers suggest that vehicle batteries can be used for energy storage during and after vehicle life (Carranza 2013). Therefore, we deem the assumption of a total driving distance of 180 000 km to be reasonable.
Now that we have discussed the results and some of the limitations of our study, we compare our findings to those reported by previous academic studies and industry reports. Our estimates of the CCP production impact of EVs are higher than impacts reported by Dunn et al (2015), but lower than Faria et al (2013). The differences are mainly due to battery-related impacts. Although our results differ from the preceding academic studies, our findings align well with industry reports (Volkswagen AG 2012, Daimler AG 2012, Volkswagen AG 2013, Daimler AG 2014, Volkswagen AG 2014). We obtained similar CCP production intensities (6.3–7.1 kg CO2-eq kg−1 of car) as the industry (6.0–8.2 kg CO2-eq kg−1 of car) (Volkswagen AG 2012, Daimler AG 2012, Volkswagen AG 2013, Daimler AG 2014, Volkswagen AG 2014). In the use phase, we report similar use phase CCP impacts as Dunn et al (2015) and the industry studies (Volkswagen AG 2012, Daimler AG 2012, Volkswagen AG 2013, Volkswagen AG 2014, Daimler AG 2014), whereas Faria et al (2012) report slightly higher impact. Differences in the use phase are due to the EV energy requirement and the carbon intensity of the electricity mixes. As for EOL treatment, Volkswagen estimated 0.2 ton CO2-eq for EOL treatment of their concept e-Golf (Volkswagen AG 2012) in 2012, but this number increased to 0.9 ton CO2-eq for the e-Golf that became commercially available in 2014 (Volkswagen AG 2014). Their later estimate is in better alignment with our result as well as the other industry reports and Faria et al (2012).
The modern EV powered by Li-ion batteries is a young technology that still has many opportunities to reduce its lifecycle impact. As EVs do not face the inherit limitations of thermodynamic engines as ICEVs do, they are not as limited as ICEVs in reducing their use phase emission. Since the introduction of Li-ion battery powered EVs, the industry has succeeded in improving the performance of EVs in very short time. For example, the NEDC energy requirement of the Nissan Leaf was reduced by 13% in only four years (Nissan Motor Co. LTD 2010, Nissan Motor 2014). In 2012, Volkswagen estimated 11.1 ton CO2-eq for the production of their concept e-Golf (Volkswagen AG 2012), but the production impact of the currently available e-Golf is 9.7 ton CO2-eq (Volkswagen AG 2014). The BMW Group has installed wind power turbines for more sustainable production of their EVs (BMW GROUP 2014). Furthermore, Tesla Motors is currently building their Gigafactory from which the company expects benefits from local electricity from solar and wind as well as economies of scale (Tesla Motors 2014). Decarbonising the energy sector offers a long-term opportunity to reduce the lifecycle GHG emissions of EVs.
5. Conclusion
We assessed the lifecycle GHG emissions of four differently sized EVs based on comprehensive inventories. The size and range penalty (going from segment A to F) of the EVs was a 1.7 increase in lifecycle CCP impact (figure 2). The penalty was less pronounced for EVs powered by electricity mixes with lower carbon intensity (figure 3). Thus, areas already rich in green energy sources will experience less difference in GHG emissions between smaller and larger EVs. From a GHG perspective, EVs equipped with smaller battery packs are more competitive than the heavier EVs with larger battery packs. However, EVs with small battery packs suffer from shorter driving ranges and are more dependent on infrastructure in the form of fast charging stations. Compared to the conventional vehicles, the EV production phase was environmentally more intensive (figure 2). Yet, depending on the energy source used for charging, the EVs were able to make up for the higher production impact in the use phase (figure 3). The EV technology is still developing, and there are both near- and long-term opportunities to reduce their lifecycle GHG emissions. Near-term opportunities are mainly available through technology and production improvements. Impact reductions due to cleaner electricity is considered as more of a long-term opportunity. We also found that larger EVs can have higher lifecycle GHG emissions than smaller conventional vehicles (figure 2). Thus, at the current state of the technology, finding the right balance between battery size and charging infrastructure is an important element in maximising the climate change mitigation of EVs. As the technology develops, it is important to keep assessing the environmental impact of EVs so that potential opportunities and pitfalls can be identified in addition to providing directions for R&D and policy-makers.
Acknowledgments
This research was in part made possible by CenSES. The authors thank Thomas Gibon for Matlab programming.