
Abstract
Graphene oxide (GO)-based membranes hold significant promise for applications ranging from energy storage to protective coatings, to saline water and produced water treatment, owing to their chemical stability and unique barrier properties achieving a high selectivity for water permeation. However, unmodified GO membranes are not stable when submerged in liquid water, creating challenges with their commercial utilization in aqueous filtration and pervaporation applications. To mitigate this, we develop an approach to modify GO membranes through a combination of low temperature thermal reduction and metal cation crosslinking. We demonstrate that Zn2+–rGO and Fe3+–rGO membranes had the highest permeation flux of 8.3 ± 1.5 l m−2 h−1 and 7.0 ± 0.4 l m−2 h−1, for saline water separation, respectively, when thermally reduced after metal cross-linking; These membranes maintained a high flux of 7.5 ± 0.7 l m−2 h−1, and 5.5 ± 0.3 l m−2 h−1 for produced water separation, respectively. All the membranes had a salt rejection higher than 99%. Fe3+ crosslinked membranes presented the highest organic solute rejections for produced water of 69%. Moreover, long term pervaporation testing was done for the Zn2+–rGO membrane for 12 h, and only a minor drop of 6% in permeation flux was observed, while Zn2+–GO had a drop of 24%. Both modifiers significantly enhanced the stability with Fe3+–rGO membranes displaying the highest mechanical abrasion resistance of 95% compared to non-reduced and non-crosslinked GO. Improved stability for all samples also led to higher selectivity to water over organic contaminants and only slightly reduced water flux across the membrane.
Export citation and abstract BibTeX RIS

Original content from this work may be used under the terms of the Creative Commons Attribution 4.0 licence. Any further distribution of this work must maintain attribution to the author(s) and the title of the work, journal citation and DOI.
1. Introduction
The petroleum industry generates large volumes of wastewater as a byproduct of crude oil and gas extraction. This is known as produced water and contributes significantly to the volume of waste produced at around 80% to 98% of the total waste generated in the oil fields [1, 2]. Produced water typically consists of a mixture of variable constituents of organic and inorganic chemicals dissolved in water that contains salts, minerals and heavy metals, suspended solids, as well as bacteria [3–5]. These put a burden on the environment [6, 7], and need to be treated in an economical and safe way.
In the few past years, membrane separations has emerged as a promising technology for economically treating produced water streams. It can be less expensive and more energy efficient compared to conventional separation methods [8]. Reverse osmosis (RO) is widely used in saline water desalination and metal and organic removal [9, 10]. However, RO is energy intensive and conventional membranes suffer from rapid and extensive fouling caused by the build-up of suspended particles and can easily become clogged with oily contaminants, which eventually cause a permeation flux reduction [11].
On the other hand, pervaporation is an alternate technology that has gained traction in recent years. Pervaporation consumes less energy, and can reject organic solutes at a higher rate than RO [12, 13]. Moreover, less turn down periods are needed for pervaporation membrane module cleaning and maintenance caused by fouling and clogging [12–14]. Pervaporation separates liquid mixtures based on the difference of the component's volatility. The liquid mixture is fed to the membrane module, and the more volatile component (higher partial pressure) is driven across the membrane to the permeate side, by the large capillary partial pressure difference generated from the nanochannels of the membrane using a vacuum pump or a sweep gas on the permeate side. The permeated phase is then captured in a low temperature condenser [15–18].
The selection of membrane material for pervaporation has been broadly investigated. Most membrane materials exhibit a trade-off between fouling resistivity, permeation flux, solute selectivity, and life span [17, 19]. To address these challenges, graphene oxide (GO) has been investigated using pervaporation separation. Although GO possesses about four to fivefold higher affinity towards organic solutes than polymeric membrane materials [20], the interaction of these organic solutes take place at the basal surface side of the structure, which in return does not enhance the fouling accumulation. Additionally, pervaporation separation demands less energy input, unlike the other pressure driven separation methods [21]. Recently, GO and its derivatives have been considered as a prominent potential membrane material for water treatment and growing number of research studies have investigated its performance in different applications [22–24]. GO is a two-dimensional material with a similar single layer of hexagonal carbon structure as graphene but is decorated on top and bottom in oxygen-containing functional groups such as epoxy, carboxyl, and hydroxyl groups [20, 23–26]. These oxygen-containing functional groups are located asymmetrically at the edges and on the basal surface which provide it with high mass transportation rate, molecular sieving, and antifouling aspects [20]. GO is produced under harsh oxidizing conditions, it is rather chemically inert, not as oleophilic as polymeric membranes, and does not corrode under saline conditions [27, 28].
Nevertheless, the large number of oxygen groups (carbon to oxygen ratio (C/O) of ∼2 is typical) impart the GO with a negative charge when submerged in liquid water. This causes the GO to swell and repel each other due to the osmotic pressure difference between the overlapping charged sheets (the physical origin of the electrostatic repulsion force). This acts to increase the interlayer d-spacing, and thus, the GO swell and delaminate until they overcome the attractive forces (hydrogen bonding and van der Waals), causing the membrane to eventually disintegrate [29–31]. Consequently, the stability of GO membranes in water-based environments is a concern in membrane water treatment applications. Several attempts to enhance the GO membranes' stability has been conducted, such as crosslinking [32–35], physical restriction [36], and partial GO reduction [37].
In GO crosslinking, different crosslinkers can be employed to hold the neighboring GO nanosheets together and inhibit the increase in d-spacing due to hydration, such as through the use of polymers [32], organic molecules [33], low molecular weight molecules [34], and ions [35] by covalent and non-covalent interactions. Moreover, this modification method can also be used to precisely control the GO interlayer d-spacing to meet the solute rejection specifications via adding a spacer of specific molecular size [36, 38–40]. Unlike polymeric and organic crosslinkers, metal cation crosslinkers offer greater control over the lamellar distance in GO. This control leads to higher permeation and selectivity rates, along with increased stability in aqueous solutions. [35].
Furthermore, in GO nanosheets reduction, the oxygen groups are partially reduced via chemical reaction or thermal treatment. However, there is a trade-off between the permeation flux, rejection, and stability of rGO membranes [37, 41].
Reducing GO results in introducing more of the pristine graphitic sp2 regions, where there is less amount of oxygen functional groups in the basal plane, and therefore the water permeation through it has lower flow resistance that is created by the hindrance from the hydrogen bond interaction between water and oxygen. In fact, water permeation in lower oxidation degree GO membrane is ten times higher than that of high oxidation degree [42–44]. However, reducing GO can also result in decreasing the interlamellar d-spacing between the nanosheets, and thus decreasing the transportation channel volume for the water to pass through significantly [37, 43]. Additionally, reducing GO will also improve the membrane's stability by substantially improving the π–π interactions between the rGO sheets [45].
This paper aims to improve GO stability by combining different strategies. In particular, we aim to use both a partial reduction and metal cation crosslinking of GO membranes after vacuum filtering the GO on a polyethersulfone (PES) support. The GO membranes were fabricated by either metal cation crosslinking the rGO membranes (method I) or reducing the crosslinked GO membranes (method II). Metal cations of Zn2+ and Fe3+ were incorporated into the laminar structure of rGO as divalent and trivalent crosslinkers, respectively, to crosslink the nanosheets together. The prepared M+–rGO were further tested by the pervaporation technique for produced water derived from the steam-assisted gravity drainage (SAGD) process in the petroleum industry. Additionally, an abrasion test was performed to assess the mechanical stability of the membrane.
This work shows a novel approach to improve GO membrane stability, increase its permeability and selectivity for produced water membranes via the new process of pervaporation separation that was introduced in our previous study [46]. The innovation lies in integrating partial reduction and metal cation cross-linking to improve GO stability. By employing these techniques in various treatment orders, we assess the impact of water permeation flux and selectivity.
2. Experimental
2.1. Materials
Graphite powder (−10 mesh, metal basis, 99.9%) was purchased from Alfa Aesar, Haverhill, MA, USA. Potassium permanganate (KMnO4), sulfuric acid (H2SO4), phosphoric acid (H3PO4), hydrogen peroxide (H2O2, 30%), hydrochloric acid (HCl, 10%), ethanol (95%, reagent alcohol grade), n-butanol, zinc chloride (ZnCl2), Iron (III) chloride (FeCl3), sodium dodecyl sulfate (SDS), hexadecane, phenol, and naphthenic acid were supplied from Sigma Aldrich, St. Louis, MO, USA. Polyethersulfone filter papers (pore size of 0.1 microns, diameter of 47 mm) were purchased from Sterlitech Corporation, Kent, WA, USA. Cresol (mixture of isomers) was obtained from TCI America, Tokyo Chemical Industry, Portland, OR, USA. All obtained chemicals were used in the experiments without any further modifications.
2.2. GO synthesis and membrane preparation
A modified Hummer's method [47, 48] was used to synthesize GO. 1.5 g of graphite flakes were oxidized in a mixture of 9 g of KMnO4 dissolved in concentrated 240 ml of H2SO4 and 20 ml of H3PO4 and the reaction was kept at 45 °C for overnight. Subsequently, the solution was cooled in around 200 ml of ice water in which about 5 ml of H2O2 was carefully added to the mix under continuous stirring until the solution turned a brilliant yellow color. Afterwards, washing the obtained GO dispersion of residual acids, etc was done with two cycles using HCl and three cycles using ethanol by centrifugation at 3500 rpm for 30 min (acuuSpinTM3, Fisher Scientific, Waltham, MA, USA), and redispersing the pellet. Lastly, the GO was redispersed in ethanol and the resulted slurry stock was sealed and kept for future uses after measuring its concentration, and analyzing its functional groups to confirm that the GO was synthesized successfully using Fourier transform-infrared spectroscopy (FTIR, Thermo Nicolet, Madison, WI, USA). FTIR scanning was applied from 4000 to 400 cm−1 using a potassium bromide (KBr) disc.
GO membranes were fabricated by vacuum filtration. A volume of 89.6 μl was pipetted from 6 mg ml−1 GO in ethanol stock solution and dispersed in 50 ml of n-butanol. Afterwards, the solution was sonicated in an ice bath at 50% amplitude for 10 min using a tip sonicator (Sonics, Vibra cellTM, Tip model: CV334, CT, USA). Subsequently, the solution was vacuum filtered through a polyethersulfone (PES) filter substrate and was kept covered overnight. All fabricated membranes were dried for at least 24 h in a dry air desiccator (Series-100, Terra Universal) at a relative humidity (RH) of 0.5%.
2.3. Preparation of Zn2+-rGO and Fe3+-rGO
The prepared membranes were further treated by either of the two different treatment methods as shown in figure 1. The first path is by partially reducing the membrane for different time periods, and then followed by crosslinking. The second path is by crosslinking the membrane in different crosslinking solutions concentrations, and then partially reducing the GO.

Figure 1. Methods of treatments for vacuum filtered membranes.
Download figure:
Standard image High-resolution imageIn the first method, the prepared GO/PES membranes were reduced in a vacuum oven (Isotemp, Thermo Fisher Scientific, Marietta, OH, USA) at 200 °C for 5, 10, or 15 min. The rGO membranes were then left to cool down to room temperature in a dry air desiccator (Terra Universal, Series-100) for 24 h under a relative humidity (RH) of 0.5%, before immersing in the crosslinking solutions for 24 h. Two types of solutions of 100 ml of 0.1 M were prepared by dissolving ZnCl2 and FeCl3 in DI-water, and adjusting their pH to approximately 5–6 using dilute HCl solution (<1%). Afterwards, the membranes were left to dry in the dry air desiccator for at least 24 h before any characterization or pervaporation testing.
In the second method, the prepared GO/PES membranes were crosslinked in solutions of 0.01 M, 0.1 M, and 0.5 M of Zn2+ and Fe3+ ions as prepared above, followed by drying. Afterwards, the crosslinked membranes were reduced under vacuum in the vacuum oven at 200 °C for 5 min, and then kept in the dry air desiccator before characterization or pervaporation testing.
2.4. Membrane characterization
The prepared membranes were characterized using different techniques. The degree of reduction and metal cation crosslinker loading on the membrane were measured using an energy dispersive x-ray spectroscopy (EDS, Oxford Instruments, model: INCA X-act) fitted on a thermal emission scanning electron microscope (SEM, TESCAN Vega).
The change in the interlayer d-spacing between GO sheets was detected via powder x-ray diffraction (XRD, Rigaku Miniflex II), by measuring 2θ over a range between 5° and 65° using radiation of Cu kα (λ = 1.54059 Å). Samples were kept sealed away from humidity until they were tested. The intensities of the measured peaks were corrected to the internal PES reference peak. In a custom python code, peaks were identified using a prominence-based method. These peaks then served as initial guesses, modelled by the Gaussian function. Summation of these peaks was executed to reconstruct the original spectral data, and the optimization of parameters utilized the limited-memory Broyden–Fletcher–Goldfarb–Shanno with bound constraints (L-BFGS-B) method. This optimization aimed to minimize the error between the sum of the fitted Gaussian peaks and the spectral data.
Raman spectroscopy was carried out using a Renishaw inVia Reflex system, featuring a sample stage capable of precise 100 nm positioning in three dimensions. A 532 nm laser from Renishaw DPSSL, operating at 50 mW and filtered to 0.5% intensity, was directed onto the samples through a 20× objective, with a total acquisition time of 250 s. Internal calibration of the system was carried out using a Si standard. Raman scattered light was analyzed using a 2400 lines/mm grating. All acquired spectra were collected and analyzed using the Renishaw WiRE 5.3 software. The D and G peak were both fit to two Lorentzian line-shapes using a custom Python code to estimate the peak height ratios and the integrated peak intensity ratios.
Further, the change in membranes' hydrophilicity was evaluated by a laboratory made sessile drop technique and a smart phone camera [49]. ImageJ software was used to measure the apparent contact angle of a DI-water droplet pipetted on the surface of the membrane. The analysis was repeated three times using different locations on the membrane.
2.5. Membrane performance testing by pervaporation
Membrane separation performance was evaluated in a laboratory designed pervaporation filtration model as outlined in figure 2. Two types of solutions were used for testing: saline water, and a laboratory made produced water model based on produced water originating from the SAGD process [50]. Saline water solution was prepared by dissolving 30 000 ppm (30 g l−1) of NaCl in DI water. The produced water model was prepared by adding 45 ppm of phenol, 45 ppm of cresol, and 10 ppm of naphthenic acid to the saline water solution. The solutions were fed to the laboratory made customized pervaporation test cell module via a peristaltic pump (Fisher Scientific), at a rate of 75 ml min−1, and the temperature inside the test cell was maintained at 30 °C by a thermocouple measuring the instant solution temperature and connected to the hotplate's feedback controller. The pervaporation experiment was run for 2 h and samples were collected every 20 min from the condensers (Sigma Aldrich, inner cold surface area of 334 cm2) that are cooled to about −35 °C using a slurry of dry ice in ethanol. Each membrane sample was examined for three runs using a new sample on each run.
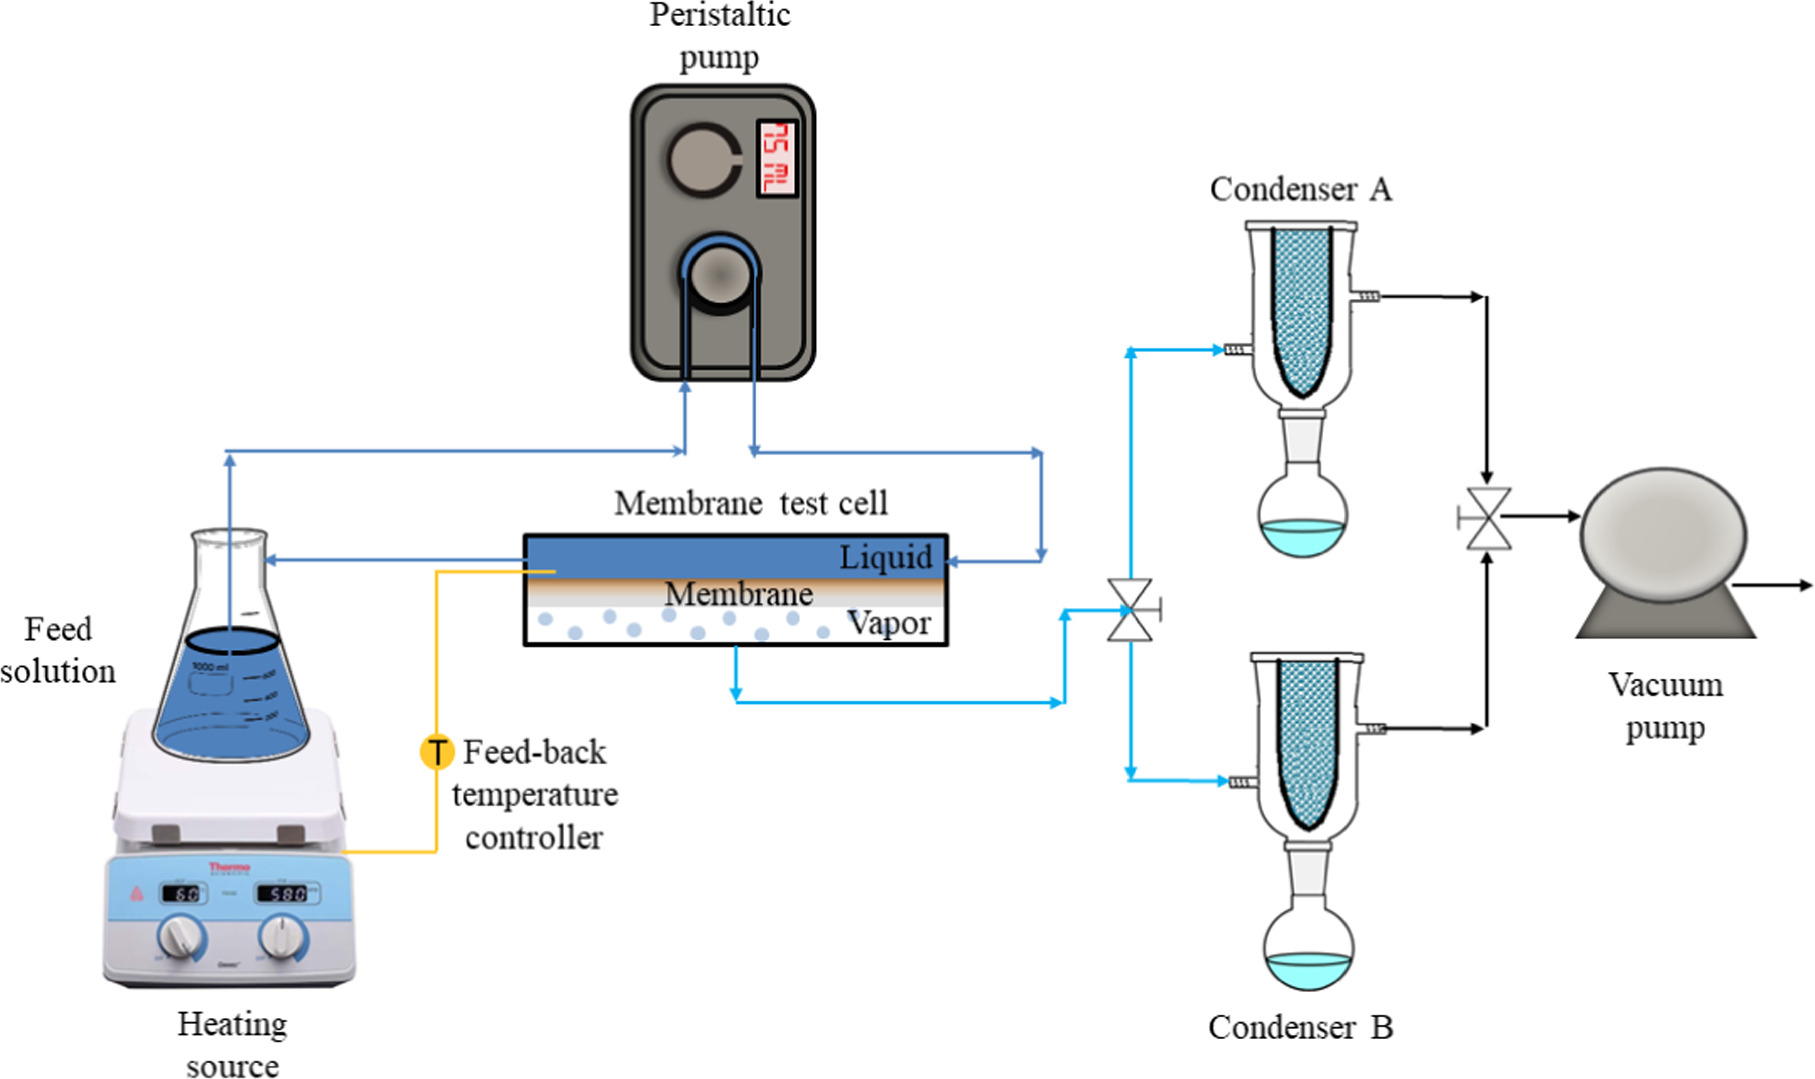
Figure 2. Membrane pervaporation separation apparatus outline.
Download figure:
Standard image High-resolution imageLong term pervaporation tests were carried out for Zn-rGO membrane prepared by method II of crosslinking GO/PES in 0.1 M of Zn2+ solution followed by reduction. The membrane was tested for pervaporation using PWM mixed with oil foulants solution. The solution was prepared by mixing 50 ppm of SDS and 1500 ppm hexadecane in 500 ml DI water using a homogenizer (CAT, Model: X-120, Staufen, Germany) at 1500 rpm for 2 h [51]. Subsequently, the PWM solutes were added to the resulting white milky emulsion, and the pervaporation was run at 30 °C for 12 h and samples were collected every 60 min.
The water permeation flux was determined by measuring the mass of the condensers before and after each cycle by a digital balance (OHAUS, Model: NV2101, repeatability =0.1 g). The permeation flux (J) through the membrane was calculated using equation (1):

where M is the mass of the collected water, A is the effective membrane area and Δt is the collection time period. In order to identify the permeation flux outliers for collected samples, Nelson's rule was used which points out the samples that are greater than three standard deviations from the average flux.
Further analysis for the collected permeated water samples was done to determine their salt content and produced water model components concentration by measuring the conductivity (OAKTON PC700, Vernon Hills, IL, USA), and using the ultraviolet visible analysis (UV–vis, Thermo Scientific Evolution 300). The solute rejection was calculated using equation (2):

where Cp and Cf are the collected permeate and the initial feed solute concentrations, respectively.
2.6. Mechanical abrasion testing
Membrane stability and mechanical integrity was tested using a laboratory-built abrasion resistance assessment that follows the ASTM International G195–13a standard. The setup consists of an abrasive rotary wheel that is connected to a PC and controlled by Allpath software. In this method, the membranes were dipped in water for around 1 s and placed flat at the sample holder, and the wheel (Material: canton flannel buffs, diameter = 15 cm, McMaster-Carr, USA) was rotated at a speed of 1 rpm for 10 s. The main difference between the current setup and the ASTM standard setup is that the test specimen is mounted on a fixed platform and the abrasive wheel is rotating on a horizontal axis since the prepared membranes have a small size, whereas in the ASTM standard the sample is mounted on a turntable platform that is rotating around its vertical axis against two abrasive wheels causing them to rotate in opposite direction. Also, a variable accessory weight can be added to the abrasive wheels in the standard procedure, while weight applied to the sample in the abrasion apparatus that was built in the current study is the weight of the sample holder only (303.40 g). In addition, no vacuum suction was applied to collect the debris as abrasion GO layer as not much debris is generated. The experiment was conducted at room temperature.
The total area of the GO layer on the substrate was determined before and after the abrasion by analyzing photographs for abraded versus non-abraded areas using ImageJ software.
3. Results and discussion
3.1. Membrane characterization
An FTIR spectrum of the synthesized GO nanosheets used in fabricating the membranes is shown in figure 3(a). Detected characteristic peaks shows the GO was successfully synthesized with ample oxygen containing functional groups presented for crosslinking the nanosheets together. Characteristic peaks for GO were observed, including a broad peak at 3600–2500 cm−1 due to the O–H groups stretching vibration, a sharp peak at 1735 cm−1 caused by the stretching vibration of C=O groups, a sharp peak at 1623 cm−1 attributed to the unoxidized sp3 C–C bonding, a peak at 1380 cm−1 attributed due to the bending deformation of C–OH groups, and a peak at 1226 cm−1 attributed to the vibration of C–O–C groups [48, 52]. The obtained membranes by vacuum filtration are defect free and uniform as shown in figure 3(b).

Figure 3. (a) FTIR spectrum of the synthesized GO sheets, (b) A photo of GO/polyethersulfone (PES) vacuum filtered membrane.
Download figure:
Standard image High-resolution imageTo determine the extent of reduction and the crosslinking of the prepared GO membranes, EDS was carried out for membrane samples before and after reduction and crosslinking treatments. Figure 4 and table 1 show the C/O ratio and the metal cation crosslinker content in the membrane measured by EDS. Table 2 shows an example EDS measurement for one sample of the prepared membranes (method II: crosslinked in 0.1 M Fe3+ solution followed by reduction) along with its EDS and SEM micrograph as shown in figure 5.

Figure 4. C/O ratio and their metal cation crosslinkers loading percentage for GO membranes prepared via (a), (b) first method (reduced then crosslinked), respectively, (c), (d) Second method (crosslinked then reduced), respectively, measured by EDS. The error bars represent one standard deviation of three independent measurements.
Download figure:
Standard image High-resolution imageTable 1. C/O ratio and metal cation crosslinkers loading percentage for the treated GO membranes measured by EDS.
| Membrane type: | Metal loading | |||
|---|---|---|---|---|
| Method I: | C/O ratio | |||
| Reduction time (min) | Zn2+ | Fe3+ | ||
| 0 | 2.32 ± 0.1 | 0.81 ± 0.05 | 0.71 ± 0.04 | |
| 5 | 2.48 ± 0.05 | 0.69 ± 0.05 | 0.58 ± 0.04 | |
| 10 | 2.73 ± 0.14 | 0.60 ± 0.03 | 0.54 ± 0.03 | |
| 15 | 3.35 ± 0.19 | 0.55 ± 0.05 | 0.48 ± 0.03 | |
| Method II: M+ loading (M) | Zn2+ Crosslinked | Fe3+ crosslinked | Zn2+ | Fe3+ |
| 0.01 | 2.86 ± 0.15 | 2.54 ± 0.13 | 0.15 ± 0.05 | 0.12 ± 0.04 |
| 0.1 | 3.28 ± 0.06 | 3.02 ± 0.11 | 0.34 ± 0.05 | 0.29 ± 0.04 |
| 0.5 | 3.87 ± 0.25 | 3.66 ± 0.16 | 0.72 ± 0.03 | 0.66 ± 0.03 |
Table 2. An example of the at% of elements observed on the membrane surface after treatment. Experiment was carried out by energy dispersive x-ray spectroscopy (EDS) measurement for one membrane sample. The membrane was prepared by method II: crosslinked in 0.1 M Fe3+ solution followed by reduction and gold coating.
| Element | at% |
|---|---|
| C | 68.29 |
| O | 23.05 |
| S | 7.46 |
| Cl | 0.31 |
| Fe | 0.31 |
| Au | 0.57 |
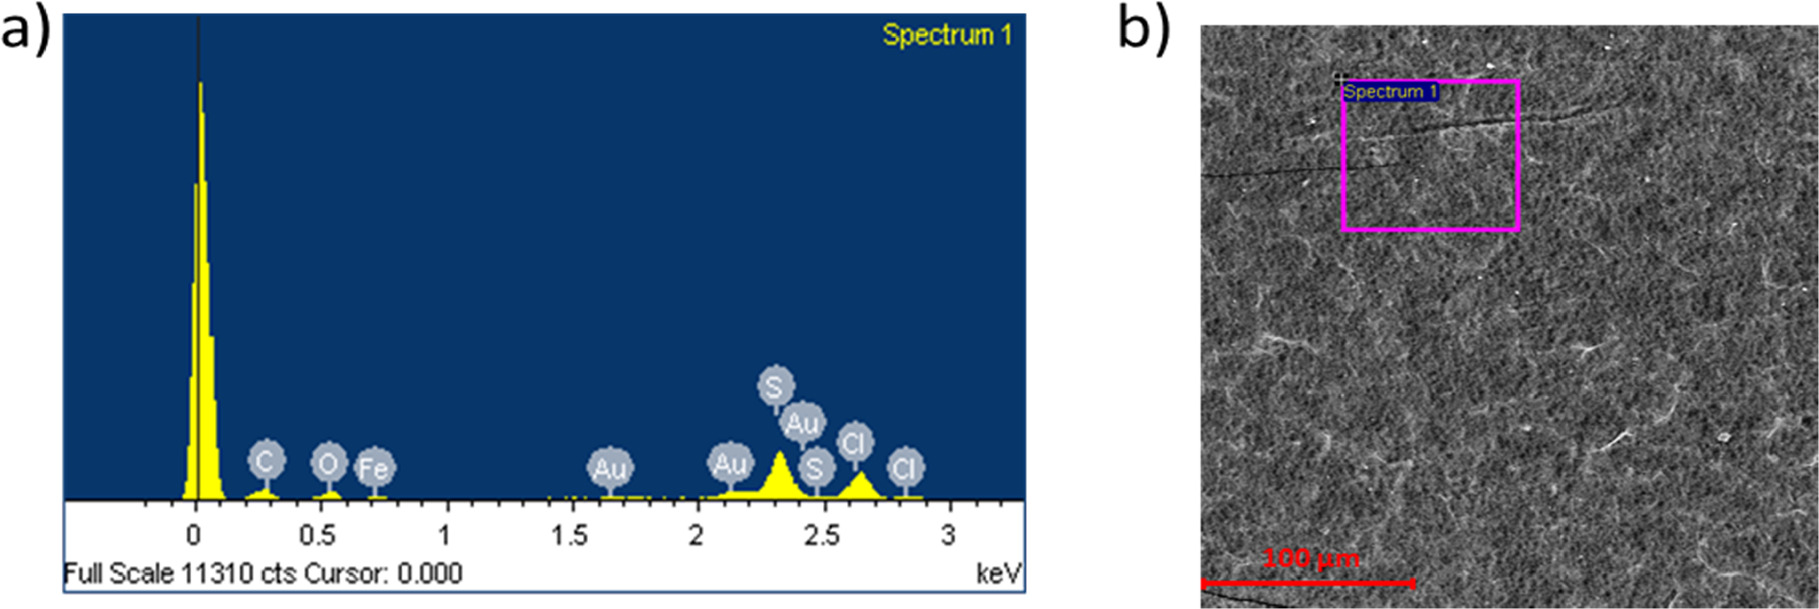
Figure 5 (a) Energy dispersive x-ray spectra (EDS) and (b) SEM micrograph for one membrane sample carried out using backscattered electron contrast. The membrane was prepared by method II: crosslinked in 0.1 M Fe3+ solution followed by reduction and gold coated.
Download figure:
Standard image High-resolution imageFor the membranes that are prepared by the first method, which is a partial GO reduction followed by metal cation crosslinking, the results show an increase in their C/O ratio (2.48 ± 0.05 for 5 min reduction, to 3.35 ± 0.19 for 15 min reduction) compared to the control one of 2.32 ± 0.10 (0 min reduction and 0.1 M+), and as the reduction time increases, the higher the reduction degree is attained as shown in figure 4(a). Moreover, the metal cation crosslinker loading in these membranes decreases as the reduction time increases, due to the lower amount of the O-groups present for crosslinking as shown in figure 4(b). Zn2+ metal cations make 4 and 6 coordination bonds with O-groups in GO while the coordination number for Fe3+ is 6 [53, 54]; and therefore, it is expected that Zn2+ cation loading in GO membranes is higher due to the lower number of O-groups needed for Zn2+–O bonding. Membranes were also characterized by Raman spectroscopy (see supporting Information, figure S1 and associated discussion) and the results are commensurate with an increased level of reduction for both Zn2+ and Fe3+ samples after being thermally treated for 15 min.
Membranes prepared by the second method of crosslinking the GO sheets by Zn2+ and Fe3+ at different concentrations followed by a partial GO reduction, show a C/O ratio ranging between 2.86 ± 0.09 to 3.87 ± 0.27, and 2.54 ± 0.09 to 3.66 ± 0.09, respectively. M+–rGO membranes prepared by the second method have higher C/O ratio than those prepared by the first method, as shown in figure 4(c) (by comparing the membranes of 5 min reduction followed by 0.1 M M+, with 0.1 M M+ followed by 5 min reduction). Since the presence of metal cations in GO improve the order of the laminar structure, in which they increase the thermal conductivity of GO membranes, achieving faster reduction rate than non-crosslinked membranes [55]. Consequently, this also explains the higher reduction rate of membranes crosslinked in higher metal cation concentration solutions.
Additionally, as might be expected, the membranes immersed in higher crosslinker concentration solution achieved higher M+ loadings as illustrated in figure 4(d). In addition, membranes crosslinked with Zn2+ achieved higher loading in the membranes due to the lower number of O-groups needed for bonding as mentioned above.
Contact angle measurements were performed for the treated membranes as well as a control membrane of GO/PES (non-crosslinked and non-reduced), as shown in figure 6(a) (for visual measurements, refer to supplementary information, figure S2). The degree of hydrophilicity decreases as the C/O ratio increases due to the high amount of carbon present that lowered the degree of water droplet adsorption. Additionally, membranes that are crosslinked with Zn2+ cations are more hydrophilic than those crosslinked with Fe3+ cations due to their higher loading on the membrane as shown from the EDS data in figures 4(b) and (d), although Fe3+ cations are more electronegative than Zn2+and can attract water at a higher rate [56, 57], and Zn2+ crosslinked membranes were reduced at a higher rate in the second method.
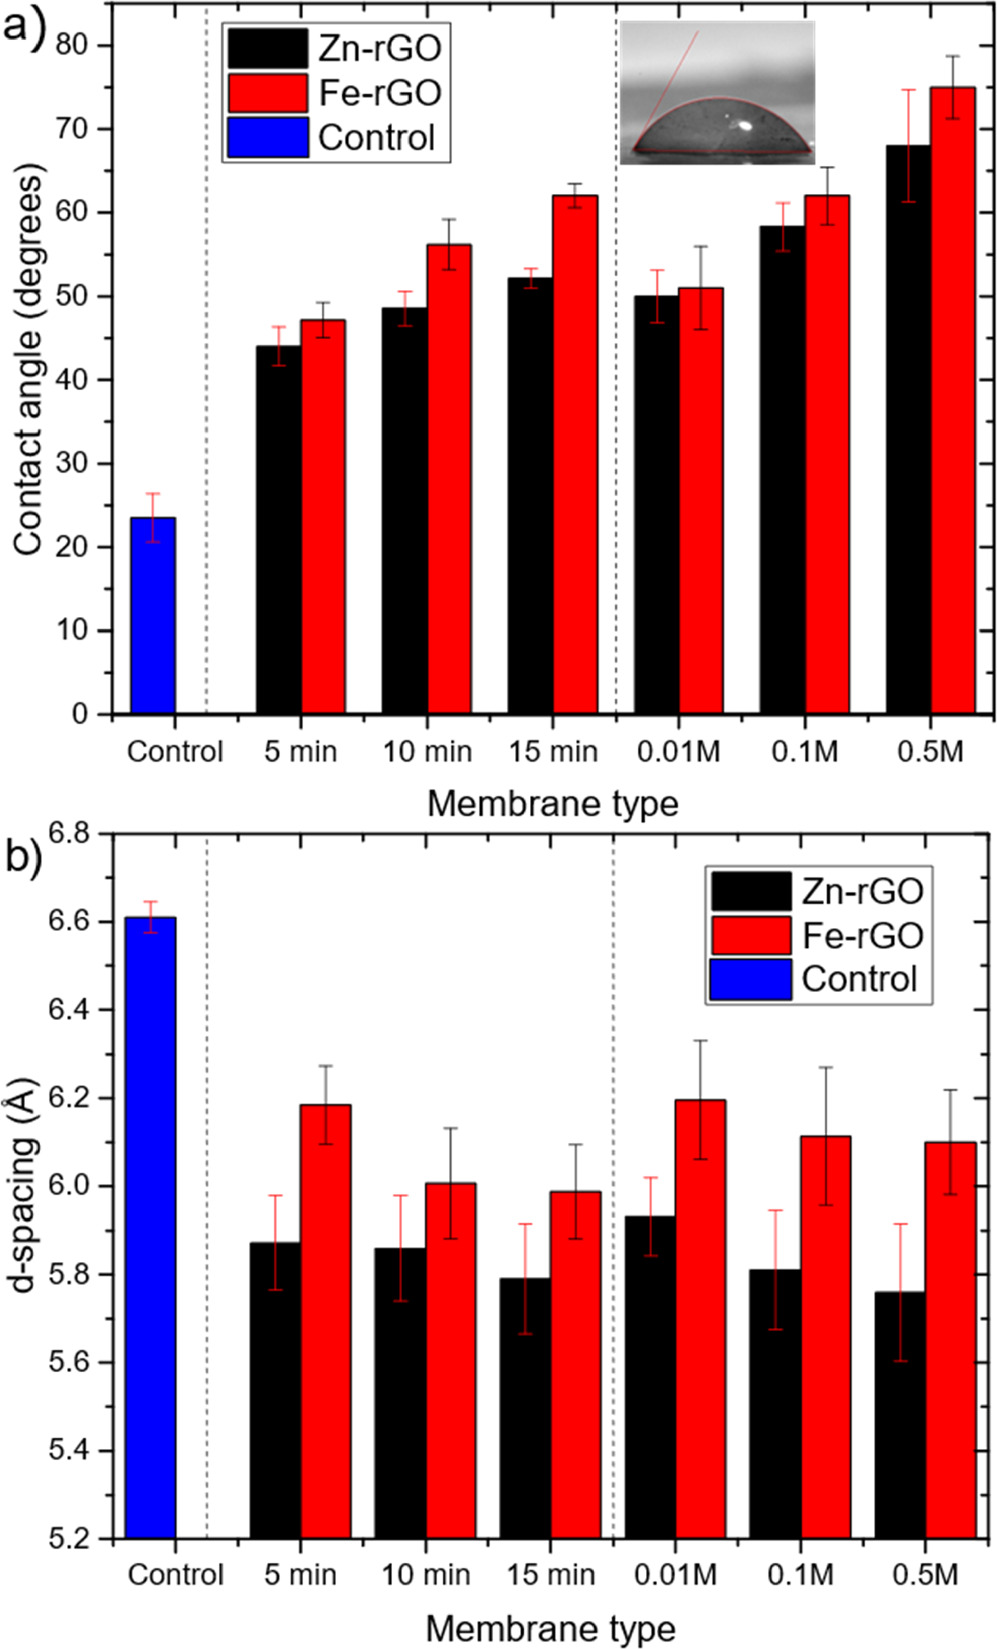
Figure 6. Contact angle measurements for the membranes prepared via two methods, control sample is non-reduced and non-crosslinked GO/polyethersulfone (PES) membrane. The error bars are one standard deviation of three independent measurements. The inset shows an example of a droplet on a 0.1 M Fe-rGO case. (b) d-spacing estimated by XRD analysis.
Download figure:
Standard image High-resolution imageThe interlayer d-spacing of the lamellar stacked GO sheets in the membrane decreases after crosslinking and reduction treatments, as shown by the XRD analyses in figure 6(b) (see supplemental information figure S3 for raw and fitted profiles). The partial loss of oxygen containing groups in GO that causes the repulsion between the sheets, and the presence of M+–π interaction after crosslinking overcomes the low remaining repulsive forces by oxygen containing groups in the GO, leading to narrower interlayer spaces between the GO sheets [43, 58]. By comparing the two controls of M+–rGO membranes (membranes prepared by 5 min reduction followed by 0.1 M M+, and 0.1 M M+ followed by 5 min reduction); it is clear that Zn-rGO membranes show lower d-spacing than Fe-rGO, due to the higher loading of Zn2+ cations, as evidenced by the EDS results, and hence more attractive forces exist resulting in smaller interlayer d-spacings, despite the smaller size of Fe3+ ion (radius = 0.60 Å) compared to Zn2+ ion size (radius = 0.74 Å) [59].
3.2. Membranes performance
The pervaporation performances of the synthesized membranes of different crosslinking concentration, reduction time and preparation order, were evaluated by determining their water flux and salt and organic solutes rate of rejection as shown in figure 7. Generally, the results show that the higher the extent of reduction of the membrane (i.e. the lower the C/O) results in a lower permeation flux of water compared to control membranes in testing saline water and PWM. Since the higher reduction extent of the membrane resulted in lowering of the interlayer d-spacing between the GO sheets, the volume size of pathway channels for water to flow through were reduced and hence the permeation flux decreased [37, 43]. Moreover, reducing the GO membranes will increase the tortuosity for the flowing water, because the membranes' porosity was decreased by losing the oxygen functional groups that form bigger pores at the edges of the GO sheets. On the other hand, reduced regions of GO membrane sheets allow lower flux friction of water molecules with oxygen containing groups by forming H- bonding interaction with GO [42–44].
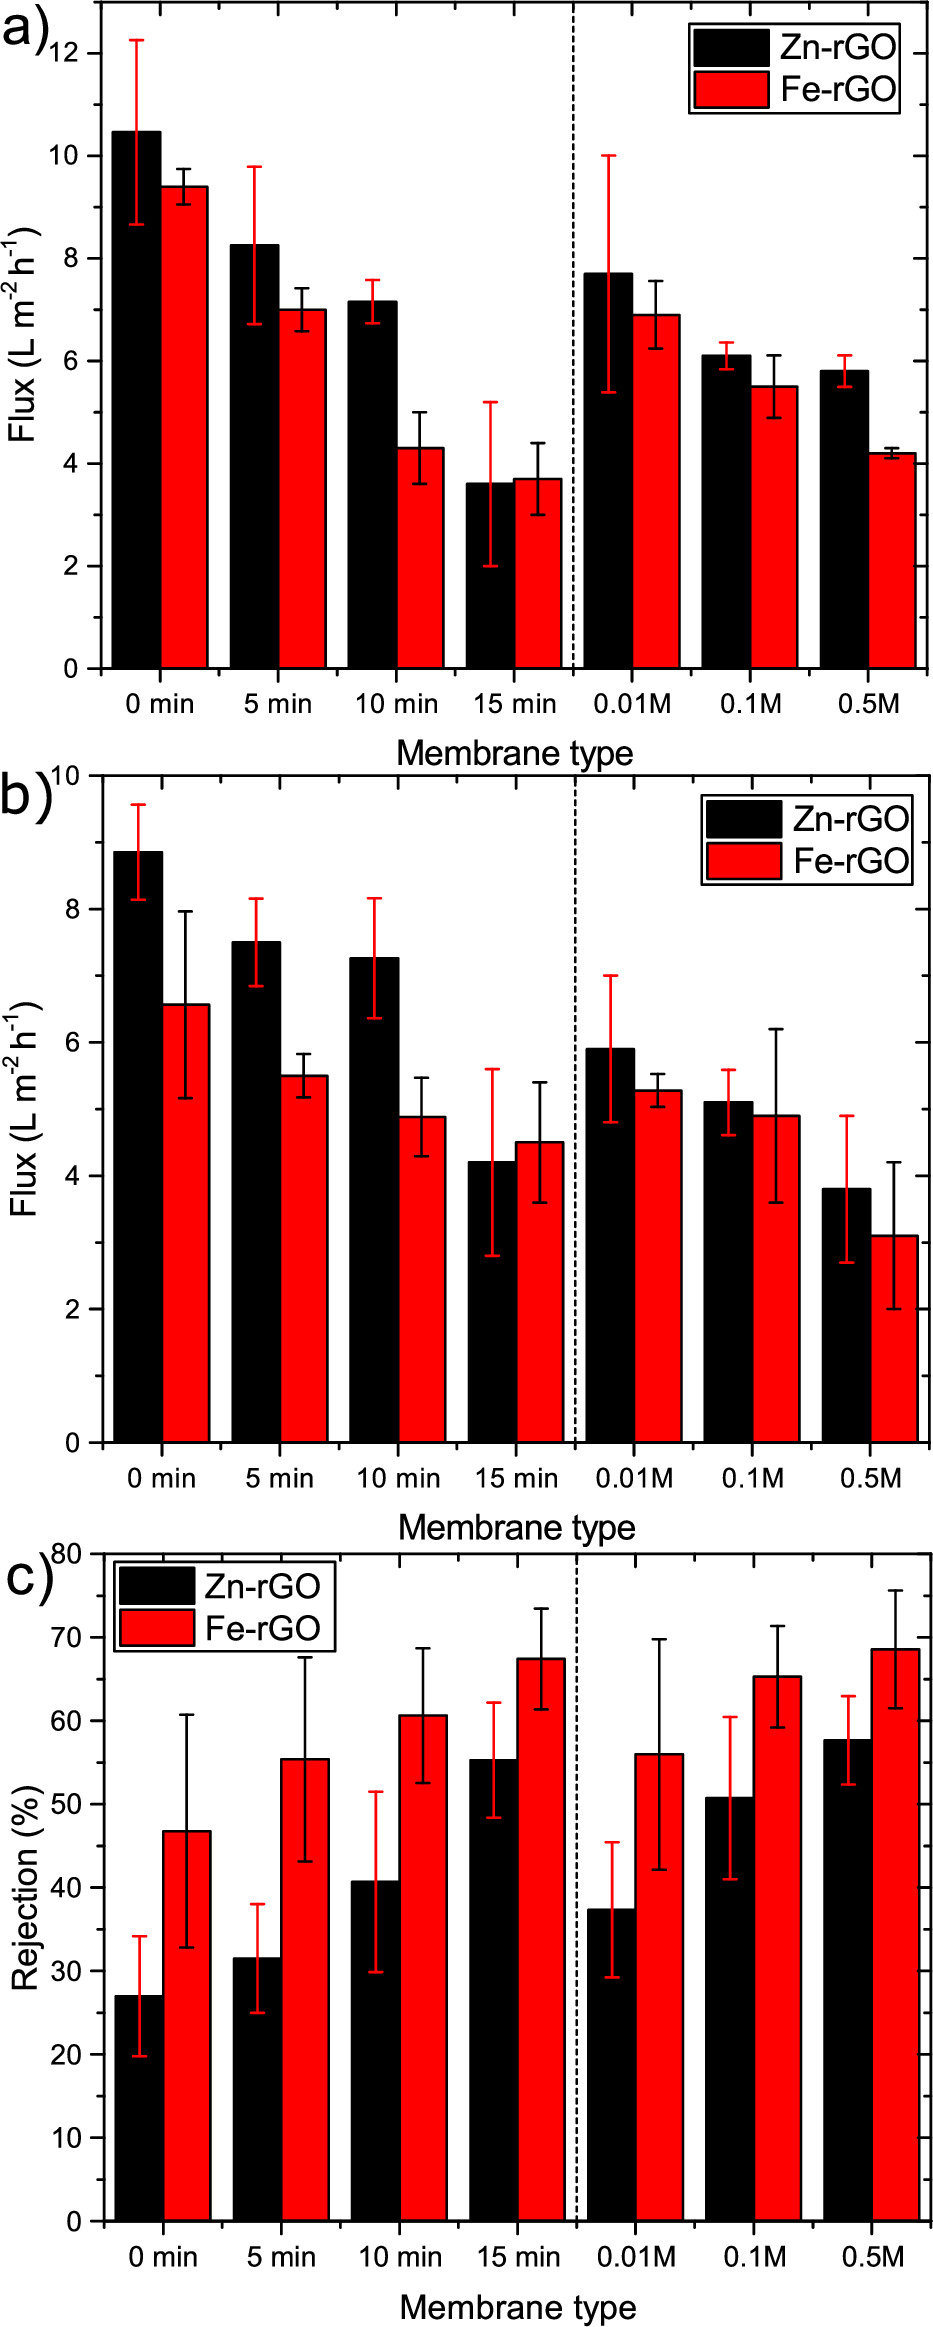
Figure 7. Water permeation flux for different types of membranes prepared by the two methods of crosslinking rGO in different Zn2+ and Fe3+ solution concentrations (0.01 M, 0.1 M, and 0.5 M) or reducing M+–GO used in (a) NaCl solution prepared by dissolving 30 000 ppm of NaCl in DI-water, and (b) PWM prepared by mixing 45 ppm of phenol, 45 ppm of cresol, 10 ppm of naphthenic acid and 30 000 of NaCl in DI-water; the pervaporation was carried at 30 °C and fed at rate of 75 ml min−1. Permeated water was collected in condensers that were cooled to −35 °C (c) rejection rate of organic solutes of PWM by measuring its conductivity. Control sample is 0 min reduction and 0.1 M M+ loading. The error bars represent one standard deviation of three independent measurements.
Download figure:
Standard image High-resolution imageSurprisingly, the water permeation flux of Zn2+–rGO membranes is higher than the Fe3+–rGO, despite the fact that these membranes were reduced to a larger extent and also possess a reduced d-spacing. Since it is known that unoxidized regions or pristine graphene capillaries formed between adjacent sheets can enhance water permeation by providing a low friction pathway, it is possible that this mechanism is enhanced in the Zn2+–rGO samples [42–44]. Furthermore, these samples also exhibited the lowest contact angle, suggesting that water affinity plays a dominant role in the flux and that the Fe3+–rGO samples simply become too hydrophobic as shown in 6b.
The membranes exhibited >99% salt rejection in all cases and a pure water flux ranging from 3.6 ± 1.6 to 8.3 ± 1.5 l m−2 h−1 as shown in figure 7(a). The highest permeation flux of 10.5 ± 1.8 l m−2 h−1 was attained for non-reduced GO membranes since they have the highest interlayer spacing and the lowest contact angle, whereas the flux decreased with the extent of reduction for all samples. Additionally, the repulsive forces between the salt and the crosslinking cations of Zn2+ and Fe3+ prevented the salt from passing through the membrane. Additionally, upon the hydration of the M+–GO membranes, the interlayer d-spacing can precisely be controlled by the cation–π interactions generated from the cations and the aromatic rings, which can selectively induce molecular permeation through the M+–GO membranes [35, 60].
PWM pervaporation separation flux shows a similar trend to the saline water separation with a lower flux of 3.1 ± 1.1 to 7.5 ± 0.7 l m−2 h−1 as shown in figure 7(b). The solute component rejection rate increases by both the decrease of the interlayer d-spacing and metal cation loading on the membrane. Additionally, Fe3+ crosslinked membranes show higher solute rejections rate than Zn2+ in general. The higher electronegative ion of Fe3+ formed higher repulsive interaction forces with the polar solutes in PWM that resulted in a higher rejection rate than Zn2+ crosslinked membranes.
The highest PWM solute rejection rate was around 69% for the membranes that were prepared by crosslinking in 0.5 M Fe3+ solution followed by 5 min reduction, in which the lowest water flux was observed. This shows the trade-off between water flux and solute rejection, as reported in many other membranes fabricated with different materials which has always been the drawback in membrane desalination [16, 61–63].
Furthermore, the membranes rejection towards the PWM solutes is found to be non-selective. The simulated PWM solutes have the same chemical structure and functional groups. This was proven by looking at the full wavelength range of UV–vis spectra as shown in figure 8. The figure shows that the shape of the plotted UV–vis curves is identical for both collected sample curves when normalized as with the initial PWM feed curve.

Figure 8. UV–vis spectra example of one of the collected permeate samples from produced water model (PWM) separation, and its normalized curve that matches its initial feed solution spectra.
Download figure:
Standard image High-resolution image3.3. Long term pervaporation performance
Long-term pervaporation separation was carried out to examine the membrane performance over 12 h of operation using a solution of PWM with foulants. The membrane sample used was a reduced GO after crosslinking in 0.1 M Zn2+ solution and the pervaporation experiment was repeated three times with independent samples. The permeation flux was compared with non-reduced Zn–GO membrane that was treated in 0.1 M ZnCl2 solution for 24 h from our previous work [46]. To show its performance with the experiment progress in a clearer way, the measured flux at each hour was normalized with respect to the initial flux as shown in figure 9(a). The Zn-rGO membrane shows a drop of 6% from the initial flow with a slight increase in solute rejection for PWM with foulants as shown in figure 9(b); whereas, Zn–GO membranes shows a drop in flux of 24% and a large increase in solute rejection over time [46]. The drop in the permeation flux is mostly a result of the concentration polarization and foulants build up near the GO surface which appear to be more severe in the non-reduced GO membranes because of their high functionality. Moreover, the increase in PWM and foulant rejection is due to the adsorption of some of the foulant molecules onto the surface. Additionally, The NaCl rejection for both tested membranes were >99% throughout the experiment. Additionally, water permeation through rGO membranes portrays a more stable and consistent flow throughout the pervaporation experiment than non-reduced GO membranes. This is likely due to fewer interactions between water molecules and the rGO sheets in the membrane compared to the non-reduced GO membranes that has abundant functional groups, and consequently, more uniform flow and less water is being trapped within the rGO membrane at any certain time which makes the flow of water more constant.
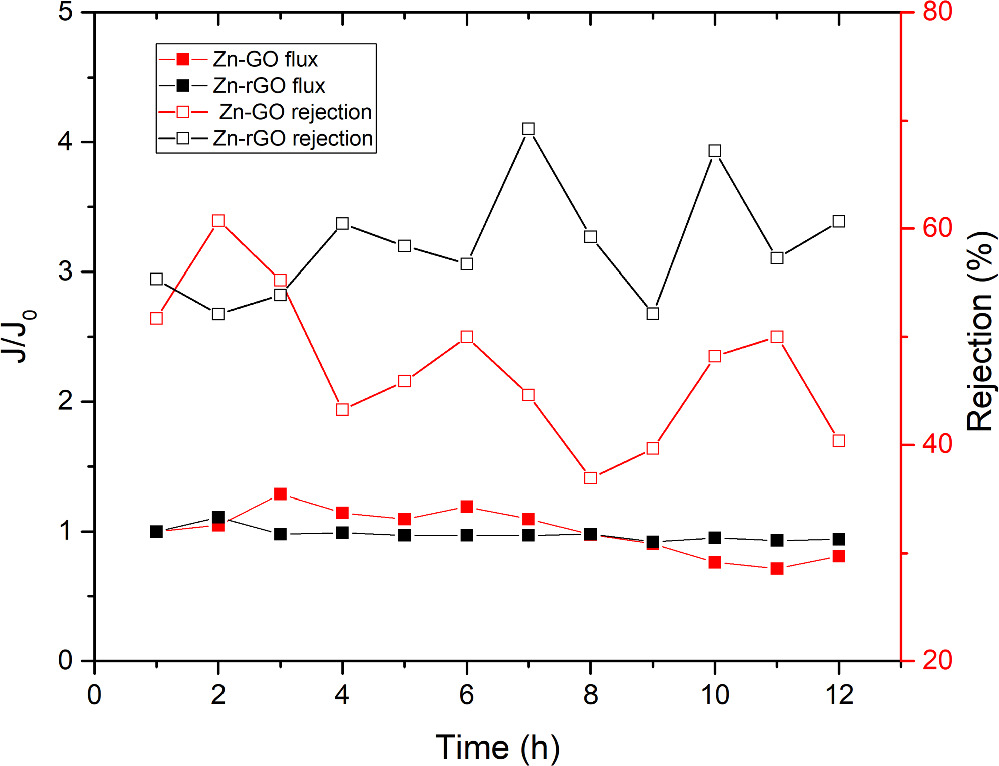
Figure 9. Water flux normalized to initial flux (J/J0), and produced water model (PWM) mixed with oil foulants, organic solutes rejection versus time by Zn–rGO and Zn2+–GO membranes. Zn2+–rGO membrane was prepared by method II of crosslinking GO/PES membrane in 0.1 M Zn2+ solution followed by partial reduction. The pervaporation was carried out at 30 °C for 12 h. Oil foulants solution was prepared by mixing produced water with 50 ppm of sodium dodecyl sulfate (SDS) in 500 ml DI-water using a homogenizer at 1500 rpm for 2 h.
Download figure:
Standard image High-resolution image3.4. Mechanical testing via abrasion testing
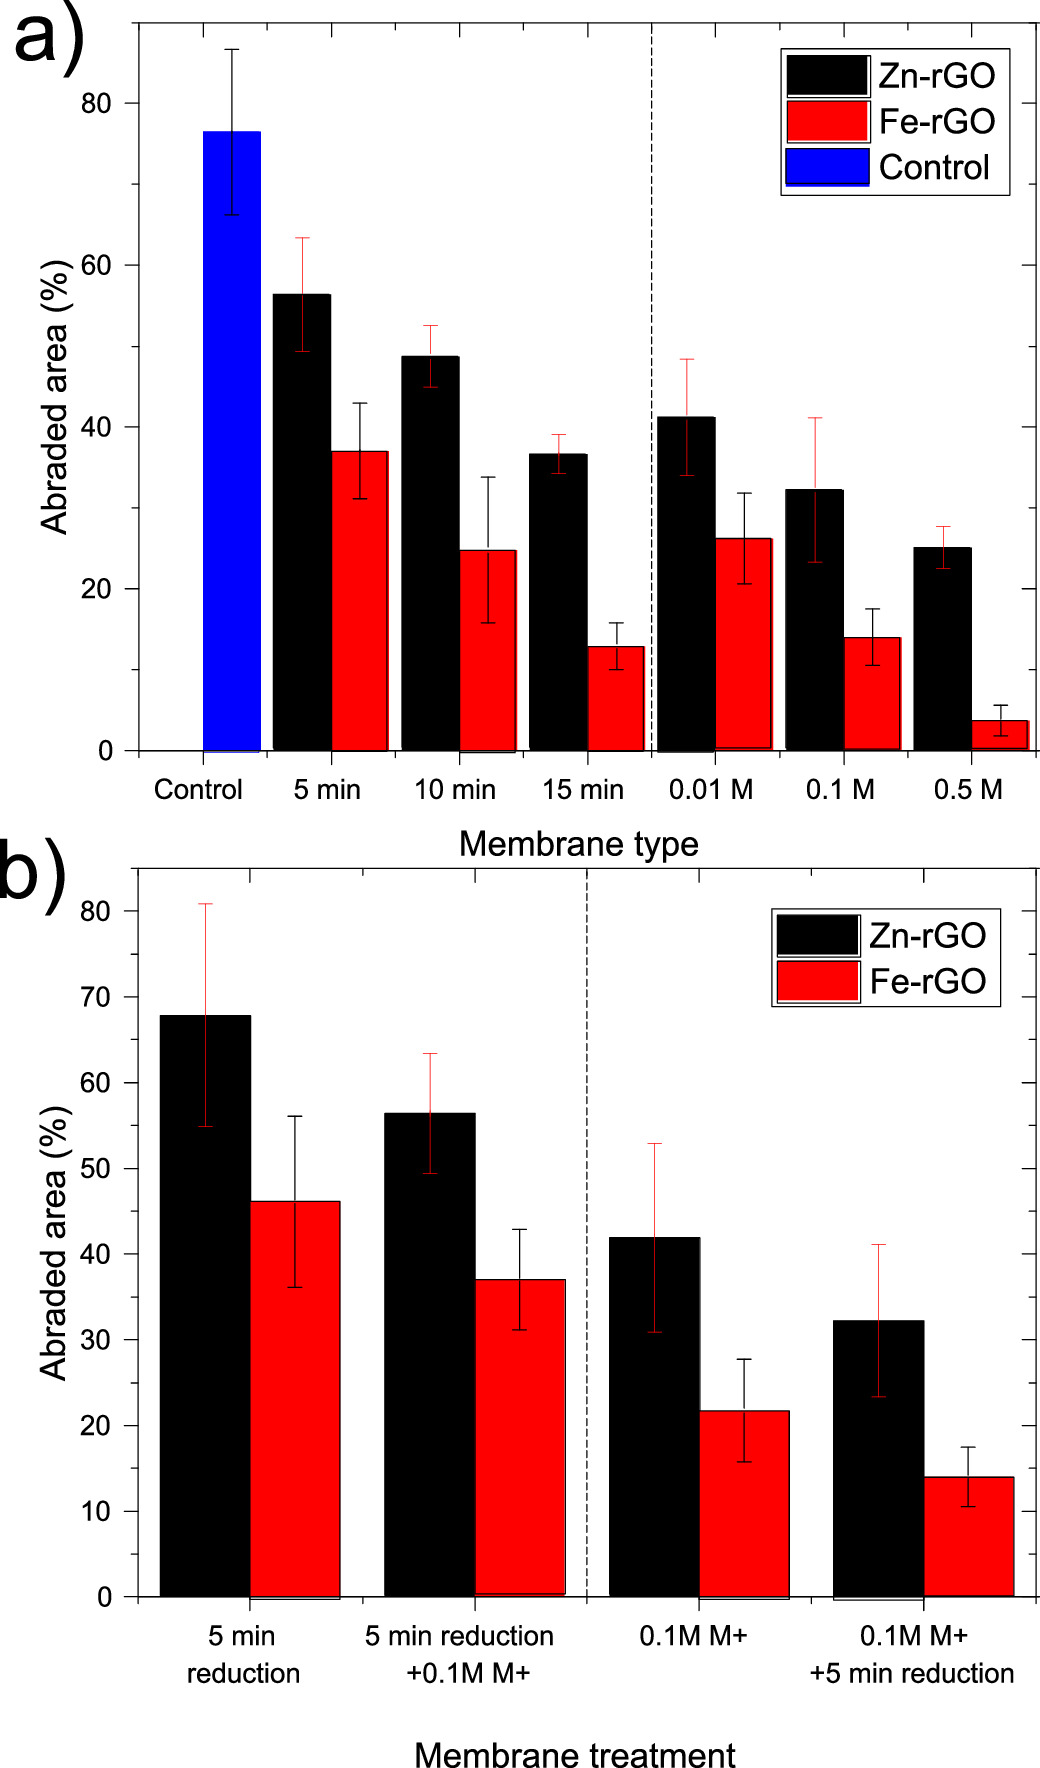
The mechanical integrity of the prepared M+–rGO membranes were examined by an abrasion method. Figure 10(a) demonstrates how resistive the membranes are by showing its abraded area when subjected to abrasion by a rotating wheel abrader. The higher the abraded area percentage, the less mechanically stable the membrane is. Membranes that were prepared by reduction after crosslinking in 0.5 M M+ solution shows the highest abrasion resistance. Fe3+–rGO and Zn2+–rGO show an area abraded of 3.7% and 25.1%, respectively. This indicates an improvement of 95%, and 67% in resistance to abrasion by comparing it to the area abraded of control GO/PES membrane for both Fe3+ and Zn2+ crosslinkers, respectively. In general, membranes' resistivity towards abrasion is higher for the membranes that have a higher C/O ratio. The reason is that GO sheets with low functionality have less interlayer repulsion forces and are more intact together after wetting. In addition, membranes that are cross-linked with Fe3+ cations show higher resistance towards abrasion, this shows that Fe3+ bonding to GO is stronger, probably because Fe3+ has higher electronegativity than Zn2+, and therefore, it forms more stronger bonds with the oxygen in the GO membranes.
Figure 10 (a) Abraded area of the membrane by a wheel abrader for the prepared membranes. (Control membrane is non-reduced and non-crosslinked GO/polyethersulfone (PES) membrane), (b) The abraded area of the membrane before and after the second treatment step. The error bars represent one standard deviation of three independent measurements.
Download figure:
Standard image High-resolution image
Moreover, figure 10(b) shows the effect of the second step of crosslinking rGO or reducing M+-GO, for both methods in strengthening the membrane resistance to abrasion. Membranes that are crosslinked with Zn2+ are more abrasion resistant than in the second step treatment in both methods, because of their higher loading in the membranes.
Furthermore, the stability testing conducted further illustrates the nature tradeoff of graphene-based membranes between their permeation flux, selectivity, and stability in water. It can be realized, as expected, that the highly stable membranes have lower interlayer spacing and higher C/O ratio, and thus, they have higher organic solute rejections and lower water flux. The crosslinking agents not only enhanced the membranes stability in aqueous solutions, but also improved the organic solute rejections from passing through the membrane.
Water permeation through the bulk of GO sheets takes place between edges, wrinkles, and interlamellar spaces that are formed due to the presence of the oxygen-containing functional groups [64, 65]. In general, when the amount of oxygen-containing functional groups is reduced, it leads to a reduction in the nanochannels volume and an increase in the tortuosity; and therefore, the flux was decreased. However, the higher the reduction rate, the more stable the membrane is due to the absence of the repulsive forces between the oxygen-containing groups. On the other hand, pristine regions of GO result in a lower flux friction due to the interactions between water molecules and oxygen-containing groups. Additionally, the Zn2+ crosslinking rate is higher than Fe3+ and these are also reduced at a higher rate, Therefore, this method creates smaller interlamellar distances between the GO sheets. However, the flux was higher due to reduced friction.
While water treatment using graphene-based membranes has been widely studied, their performances remain under the theoretical limit up to date [66]. Nevertheless, produced water separation was not studied broadly by pervaporation technique, and few studies have been conducted. GO modified alumina membranes were used for commercial ceramic microfiltration [67]. Their GO modified membrane was tested in a crossflow membrane module under a pressure of 0.1 MPa and it showed a flux of 667 l h−1 m−2 which is 27.8% higher flux than the unmodified membrane. The oil rejection achieved was 98.7%. However, the system was not tested for salt rejection. In another work, graphene on a polyvinylidene difluoride (PVDF) was prepared by phase inversion and tested for the RO purification of brine coming from coal seam gas produced water using air gap membrane distillation (AGMD) [68]. Their membrane achieved a permeation flux of 20.5 l m−2 h−1 with a salt rejection of 99.99%. However, their system was not tested for organic solute rejection and AGMD was used as a second step after RO, which implies more energy is required for the multi-step process. Furthermore, in a more recent study, amine-GO incorporated on a polysulfone (PSF) substrate was synthesized by interfacial polymerization and utilized for shale gas produced water purification using a nanofiltration method with a pressure of 0.1–0.5 MPa [69]. The highest flux obtained was 49.30 l m−2 h−1, and the salt and organic solute (glucose) rejection of around only 60%–95%, and 47%, respectively. In addition, a recent study showed a produced water purification by nanofiltration using GO/β-cyclodextrin on porous substrates of PSf membrane [70]. The optimal performance membrane showed a flux of 107 l m−2 h−1 and 103.5 l m−2 h−1 for testing salt water and oil solution permeability. In addition, an excellent rejection of hydrocarbons of 100%. However, the rejection of the monovalent and divalent salts was only about 89% and 74%, respectively, for a very low concentrated solutions of 1000 ppm each. Additionally, a high pressure of 0.6 MPa was used to drive the membrane separation.
Furthermore, in a very recent and similar study conducted for produced water separation by GO/PES and titania nanoribbons/PES prepared by phase inversion. In this study, produced water obtained from an oil field, and tested by a nanofiltration at a pressure of 0.3 MPa [71]. The best membrane was the GO/PES membrane that had a flux of 85 l m−2 h−1 and the highest salt rejection rate of 81% only for the chloride ion constituent that was fed to the system at a very low concentration of 10 220 ppm; and oil rejection of 88%.
In addition, similar recent research was carried out to investigate saline water separation utilizing a crosslinked rGO with monovalent metal cation of K+ [66]. The membrane was tested in dead end test cell under 0.6 MPa. In addition, the highest permeation flux obtained was 0.1 l m−2 h−1 with NaCl rejection of 91%. Additionally, contrary to the findings of their study, the M+–rGO membranes prepared in our study by reducing the crosslinked GO membranes (method II) have a stronger stability than crosslinking the rGO. Further, it is noteworthy that the K+ cation crosslinkers used in the study is a weak ion compared to most of other ions present in salts, and therefore, K+ is expected to tend to leak out of the GO lattice, because of the presence of other competing ions which have stronger interactions with GO, which eventually affect the stability and selectivity of the membrane [72]. Whereas the crosslinkers presented in our study (Zn2+ and Fe3+), have a higher interaction rate with the GO, thus, their cation–π interactions keep the GO nanosheets intact for longer time.
4. Conclusions
In conclusion, the performance and stability of GO membranes were improved by the combined strategies of thermal reduction and ionic crosslinking. The synthesized GO membranes were prepared by vacuum filtration on polyethersulfone (PES) substrates. Afterwards, it was further treated by either reducing the GO membranes followed by crosslinking (method I); or, reducing a crosslinked GO membrane (method II). GO reduction was carried out under a vacuum at 20 °C for different periods of time. The GO nanosheets were crosslinked utilizing divalent (Zn2+) and trivalent (Fe3+) metal cations with different concentrations ranging from 0.01 to 0.5 M. The membranes prepared by the two methods were further characterized and tested for their performances. The obtained M+–rGO membranes were used for produced water treatment of simulated water of SAGD process, by a pervaporation separation technique.
M+–rGO membranes were characterized first for their degree of reduction. Membranes that bear a higher C/O ratio showed a lower interlayer d-spacing between the GO nanosheets, and hence, a higher separation sieving for the organic solutes of the produced water. Also, the higher C/O ratio membranes suffered from a lower water permeation flux through its nanochannels as there is a less channel volume available for the water to flow through. The highest permeation flux of M+–rGO membrane obtained was for Zn2+ cation crosslinker of 8.3 ± 1.5 l m−2 h−1 for saline water separation, and 7.5 ± 0.7 l m−2 h−1 for PWM separation. The salt rejection was >99% for all the membranes, and the highest organic solute rejection was 69% for 0.5 M Fe3+ crosslinked GO membrane. On the other side, these membranes exhibited the highest resistivity against the mechanical abrasion due to the increased cation–π interactions between the metal cation and basal rGO structure.
In addition, Zn2+–rGO membranes were tested for long term produced water pervaporation separation. The results were compared with non-reduced Zn2+–GO from our previous study. The Zn2+–rGO membranes showed a more consistent water flow through the membrane, and a smaller drop of 6%, in the permeation flux than the non-reduced Zn2+–GO membrane (drop in flux = 24%), as well as a higher organic solutes rejection. Additionally, Fe3+ modified rGO membranes prepared by the second method showed a higher abrasion resistance of 95% compared to 67% for Zn2+ modified rGO membranes. The flux and salt rejection of our membrane is higher than the recent similar reported study of monovalent crosslinked K+–rGO.
This study was limited by the use of a modeled produced water on a lab scale pervaporation setup using small size lab prepared membranes. We suggest that a future research direction of this study is to focus on enhancing the water permeation flux without compromising the selectivity and mechanical integrity of the graphene-based membrane. Also, it is suggested to test the membranes for an extended period of time. The ultimate goal would be to manufacture larger sheets of GO membranes and test them with real produced water obtained from field.
Acknowledgments
KA acknowledges the funding support of the PhD scholarship from the Abu Dhabi National Oil Company (ADNOC) in UAE. This research was supported by NPRP Grant #NPRP12S-0128190016 from the Qatar National Research Fund (a constituent member of the Qatar Foundation) and the Natural Sciences and Engineering Research Council of Canada Discovery Grant Program (RGPIN-6600-2015).
Data availability statement
All data that support the findings of this study are included within the article (and any supplementary files).
Supporting information available
See Supporting Information file for Raman analysis and discussion (figure S1), example of contact angle comparison (figure S2), and x-ray diffraction data analysis procedure/example (figure S3).
Supplementary data (0.7 MB DOCX)