Electromagnetic fields
Published November 2019
•
Copyright © IOP Publishing Ltd 2020
Pages 1-1 to 1-7
You need an eReader or compatible software to experience the benefits of the ePub3 file format.
Download complete PDF book, the ePub book or the Kindle book
Permissions
Abstract
We will describe the common spectral intervals of the electromagnetic spectrum. To separate these regions, we use the frequency (the number of field oscillations per second, ) and, equivalently the wavelength (the distance traveled by the field during one period, , the speed of light).
1.1. Regions of the electromagnetic spectrum
Biophotonics employs electromagnetic fields to study biological specimens. While numerous biophotonics tools operate with visible light, for example, the light microscope, others use electromagnetic fields outside the visible range. We will study thoroughly in the subsequent volumes electromagnetic field propagation and their interaction with matter. We will see that the frequency (or wavelength) of the electromagnetic field dictates the type of interaction that can occur with a given material: for example, microwaves can be absorbed or emitted by molecules via their rotational modes, while gamma rays (which have much higher frequency or energy) are generated and absorbed through nuclear interactions. In this chapter, we aim to briefly review the most common electromagnetic regions and their applications.
One striking feature of the visible spectrum is that it occupies a very narrow range of
the electromagnetic spectrum (figure 1.1). The lowest frequency detectable by our
retina ( wavelength, dark red color) only differs by a
factor of two from the highest detectable frequency (≃380 nm, violet color). By
comparison, our sensitivity to sound waves spans three orders of magnitude in frequency,
20 Hz–20 kHz. Yet, the visual system is by far the most complex and
valuable of the human senses. We will see in chapter 6 that the visible range of the spectrum matches the peak
of the black body radiation of the Sun. Thus, evolving to develop eye sensitivity in the
visible range provides an evolutionary advantage.
wavelength, dark red color) only differs by a
factor of two from the highest detectable frequency (≃380 nm, violet color). By
comparison, our sensitivity to sound waves spans three orders of magnitude in frequency,
20 Hz–20 kHz. Yet, the visual system is by far the most complex and
valuable of the human senses. We will see in chapter 6 that the visible range of the spectrum matches the peak
of the black body radiation of the Sun. Thus, evolving to develop eye sensitivity in the
visible range provides an evolutionary advantage.
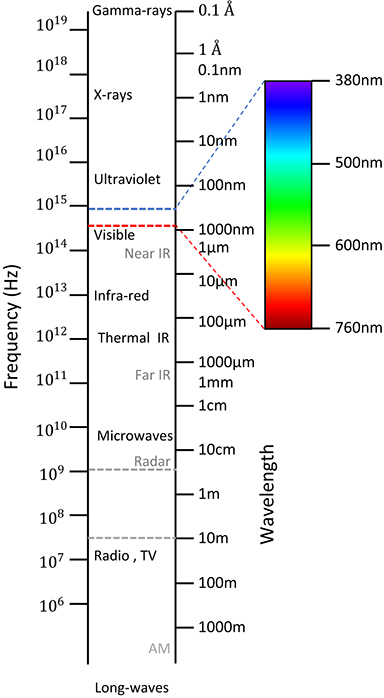
Figure 1.1. The electromagnetic spectrum, as a function of frequency and wavelength, as indicated.
Download figure:
Standard image High-resolution imageNext, we will describe the common frequency intervals of the electromagnetic spectrum.
To separate these regions, we use the frequency (the number of field oscillations per
second,  ) and, equivalently, the wavelength (the
distance traveled by the field during one period,
) and, equivalently, the wavelength (the
distance traveled by the field during one period,
 ,
,
 the speed of light).
1.1.1. Gamma rays
Gamma rays define the highest frequency, highest energy photons known to man
( , with
 Planck's constant). The wavelength is
 and has no lower limit. They are produced,
and thus used to study, high energy phenomena in nuclear physics. Gamma rays are also
used in astronomy as they can report on high-energy interaction deep into the
stars.
and has no lower limit. They are produced,
and thus used to study, high energy phenomena in nuclear physics. Gamma rays are also
used in astronomy as they can report on high-energy interaction deep into the
stars.
In medicine, gamma rays are commonly used for diagnostic imaging, for example, in positron emission tomography. In recent years, gamma radiation has been increasingly used for cancer radiation therapy.
1.1.2. X-rays
X-ray radiation has lower wavelengths, but is still capable of penetrating large objects without significant absorption. Telescopes based on x-ray radiation are broadly used for studying high-energy processes in, for example, black holes, neutron stars, and coronas of stars. Gamma and x-ray telescopes must operate in space due to the high absorption in the atmosphere.
X-rays are routinely used in medicine for radiography and computed tomography. This
radiation is not significantly absorbed in soft tissues (without contrast agents), but
provides excellent contrast of bone. X-ray wavelengths are above
 and overlap with gamma rays at the short
frequency end.
and overlap with gamma rays at the short
frequency end.
1.1.3. Ultraviolet
Ultraviolet (UV) is below x-ray in energy, but still energetic enough that it can ionize atoms, as can x-rays and gamma rays. As a result, UV can be harmful to living tissue. Even at frequencies below the threshold for ionization, UV can damage chemical bonds and turn molecules into reactive compounds, which are also potentially harmful. Such radiation can induce, for example, irreparable damage to the DNA of living cells. Exposure to UV is strongly correlated with skin cancer. Because UV is commonly used as the excitation light in fluorescence microscopy, cell viability is often a concern when studying live specimens.
UV wavelength is roughly within the range
 . Vacuum UV (VUV) defines the spectral range
below
. Vacuum UV (VUV) defines the spectral range
below  , while extreme UV (EUV) covers the end of
the high energy spectrum,
, while extreme UV (EUV) covers the end of
the high energy spectrum,
 . The longer wavelength range is separated
into UVA (315–400 nm), UVB (280–315 nm), and UVC (100–280 nm).
. The longer wavelength range is separated
into UVA (315–400 nm), UVB (280–315 nm), and UVC (100–280 nm).
The atmosphere blocks approximately 75%–80% of UV radiation. The portion that reaches the surface of the Earth consists of >95% UVA, <5% UVB, and no UVC. The sunlight reaching the Earth consists only of approximately 3% UV. Despite its potential harmful effects to living organisms, UVB is involved in metabolizing vitamin D, which is crucial for developing bone strength.
1.1.4. Visible
The visible (VIS) spectrum covers roughly the 380–760 nm range, where the human
retina exhibits its highest sensitivity. The colors of surrounding objects are due to
their absorption and reflection properties. For example, plants look green because
chlorophyll absorbs strongly in blue and red. Thus, they reflect the 'left-over
light', the green. A prism separates the sunlight into colors because the glass has
dispersion, i.e. its refractive index depends on wavelength, and
the refraction angle at the prism surface is different for different colors. As
described later, in chapter 4, the human retina reaches a maximum sensitivity around
 , corresponding to the green color.
1.1.5. Infrared
Infrared (IR) covers a broad range of wavelengths that are larger than that of the
red color, 0.75–1.000 μm. This range is further split into three regions: near
infrared (NIR, 0.75−2.5 μm) mid-infrared (MIR, 2.5–10 μm), and far-infrared (FIR,
10–100 μm). NIR radiation is involved in similar electronic charge interactions as
visible light and can be detected by solid-state sensors (see chapters 12–13). MIR is a spectral
range in which bodies at room temperature can radiate. Because MIR contains fine
spectral structures due to specific molecular vibrations, it is sometimes called the
fingerprint region. The FIR region contains radiation absorbed (and
generated) by the rotational modes of molecules. For example, water molecules in the
atmosphere absorb strongly in this range and render the atmosphere opaque to these
frequencies, except for
 . The NIR spectral region is broadly
employed in biophotonics, particularly due to the tissue penetration, which is
typically deeper that in the VIS range. IR is also used to study tissues with chemical
specificity.
. The NIR spectral region is broadly
employed in biophotonics, particularly due to the tissue penetration, which is
typically deeper that in the VIS range. IR is also used to study tissues with chemical
specificity.
1.1.6. Terahertz
Terahertz (THz) (also submillimeter) radiation covers the wavelength region 0.1–1 mm. Due to the significant absorption by the atmosphere, THz cannot be used for long-range communications. With recent improvements in sources and detectors, THz radiation has received significant attention of late for imaging applications.
1.1.7. Microwaves
Microwaves span the wavelengths
 . They are typically generated by antennas
(e.g. in cell phones). However, microwaves can interact with rotational and
vibrational modes of molecules, eventually converting the energy into heat. Heating
food by microwave ovens is a notorious example, where energy is transferred to the
rotational modes of water and, finally, into heat. The microwave spectrum is broadly
used in satellite communication, radar, and wireless connections. Microwaves have been
used for the thermal treatment of tumors.
. They are typically generated by antennas
(e.g. in cell phones). However, microwaves can interact with rotational and
vibrational modes of molecules, eventually converting the energy into heat. Heating
food by microwave ovens is a notorious example, where energy is transferred to the
rotational modes of water and, finally, into heat. The microwave spectrum is broadly
used in satellite communication, radar, and wireless connections. Microwaves have been
used for the thermal treatment of tumors.
1.1.8. Radiowaves
Radio frequency waves are emitted and detected by antennas of various dimensions,
depending on the wavelength. They cover the broad range of wavelengths
 . Radiowaves are by far the most commonly
used region of the electromagnetic spectrum for long distance communication: radio,
television, global positioning systems, radar, etc. As a result, the frequency bands
are highly regulated.
. Radiowaves are by far the most commonly
used region of the electromagnetic spectrum for long distance communication: radio,
television, global positioning systems, radar, etc. As a result, the frequency bands
are highly regulated.
Biophotonics encompasses the interaction of tissue with the electromagnetic fields, generally, from IR to UV. The type of interaction between the field and specimen determines what information can be extracted from the tissue. The subsequent volumes discuss in detail the principles of various methods that have a particular field–matter interaction as the starting point. The particular frequency range used determines whether the object of interest is:
- dispersive, that is, with a wavelength-dependent refractive index;
- spatially inhomogeneous, that is, with a spatially-dependent refractive index;
- anisotropic, that is, with a polarization-dependent refractive index;
- nonlinear, that is, with an irradiance-dependent refractive index.
For now, we postpone the rigorous discussion of these phenomena. Instead, we briefly describe next the spectral absorption of water and hemoglobin, as they are crucial contributors to the overall light attenuation in tissues.
1.2. Spectral absorption of water
Water is the dominant component of most tissues. Therefore, the absorption coefficient of water at various frequencies plays an important role in the overall attenuation of the field [1]. Figure 1.2 illustrates the water coefficient of absorption versus wavelength. It can be seen that the absorption is very high in UV and most of IR, and low around the visible region. This should not be surprising, as water looks transparent to the eye. Across the visible spectrum, we observe a monotonous increase in absorption from blue to red (figure 1.2(b)). Although we might be tempted to conclude that blue light should always be used for deep tissue imaging, this conclusion would be premature. First, there are other absorptive molecules in the tissue (e.g., hemoglobin, discussed in section 1.3) that have to be considered. Second, and perhaps, most importantly, scattering, which exhibits a strong wavelength dependence, has a significant effect on the overall attenuation.

Figure 1.2. a) Absorption coefficient of water over a broad range of the electromagnetic spectrum (log–log scale). b) Water absorption across the visible spectrum (semi-log y plot).
Download figure:
Standard image High-resolution image1.3. Spectral absorption of hemoglobin
Hemoglobin is the most abundant protein in the red blood cell. As such, its spectral absorption [2] has to be considered when performing experiments on tissue, particularly when aiming for deep imaging. As shown in figure 1.3, there are differences in the absorption spectrum for the oxygenated versus deoxygenated hemoglobin.

Figure 1.3. Molar absorption coefficient for deoxygenated (red) and oxygenated (blue) hemoglobin.
Download figure:
Standard image High-resolution imageHowever, both curves exhibit a strong absorption peak in the blue region of the visible spectrum, followed by a low peak in the green region. This, of course, explains the particular red color of blood. Tuning the wavelength across the visible spectrum, for example at points where the oxy-and deoxy-hemoglobin absorb (1) equally well, and (2) very differently, allows the investigator to infer the ratio of the two species, which can reveal information about the rate of metabolic processes in the tissue.
The strong absorption in the blue region overwhelms the relative transparency of water in the same region. Accounting for the scattering effects, which become less significant at longer wavelengths, yields that the deepest tissue penetration can actually be obtained using NIR radiation. More on this can be found in the subsequent volumes.
1.4. Problems
- 1.Choose a typical frequency corresponding to radiowaves, microwaves, THz, IR, VIS, UV, x-rays, and gamma rays, and convert it into wavelength and then into photon energy (units of eV).
- 2.A field for irradiance
 is incident on a
thick aquarium filled with water. Using
the plots in figure 1.2, estimate the irradiance emerging from the aquarium, if the
electromagnetic field has the following wavelength
is incident on a
thick aquarium filled with water. Using
the plots in figure 1.2, estimate the irradiance emerging from the aquarium, if the
electromagnetic field has the following wavelength- a)
- b)
- c)
- d).
- 3.What is the percentage of irradiance loss due to Hb absorption in a single red blood cell of thickness, if the wavelength is (use figure 1.3)
- a)
- b)
- c)?


References
- [1]Curcio J A and Petty C C 1951 The near infrared absorption spectrum of liquid water J. Opt. Soc. Am. 41 302–4
- [2]Horecker B L 1943 The absorption spectra of hemoglobin and its derivatives in the visible and near infra-red regions J. Biol. Chem. 148 173–83