

Abstract
We discussed the outdoor operation of a fixed flat sub module with an InGaP/GaAs/InGaAs inverted metamorphic triple-junction solar cell (IMM module) for the first time in the world. The global solar spectrum distribution was assessed using the average photon energy (APE) and spectral matching ratio (SMR) indexes in this study. The conversion efficiency of the IMM module was more than 30% and was markedly affected by APE rather than by module temperature under real environmental conditions.  markedly increased in the high APE region. In the case of APE of more than 1.60 eV, the photocurrent of the bottom subcell decreased owing to the blue-rich spectrum, which limited the short-circuit current. The absorption region of the bottom subcell overlapped with the water absorption region in the solar spectrum; therefore, environmental conditions such as water precipitation greatly affected the output of the current-matching inverted triple-junction solar cell.
Export citation and abstract BibTeX RIS
1. Introduction
The market of photovoltaic (PV) systems has been growing rapidly across the world,1–3) and a PV module with high efficiency and low cost is required. A heterojunction interdigitated back contact (HJ-IBC) crystalline silicon solar cell with an efficiency of 26.7%, which is a record conversion efficiency of Si solar cells, was reported by Green et al. and Yoshikawa et al.4,5)
On the other hand, special markets such as space use6,7) and electrical vehicle8–10) require a higher efficiency of more than 30% because of the space limitation. The InGaP/GaAs/InGaAs inverted triple-junction solar cell held the world record for the conversion efficiency of sub module size that reached 31.17% under the standard test condition.11,12)
In concentrator photovoltaic (CPV) systems with multijunction solar cells,13,14) their spectral distribution markedly affected their output because the subcells in multijunction solar cells are connected in series.15–18) In indoor measurements, such as that under the standard test condition, the artificial spectrum is stable and uses the standard spectrum of AM1.5D ASTM G173-03.19) The structures of multijunction solar cells are designed to be optimized when using the standard spectrum of AM1.5D. However, under the outdoor condition, the solar spectrum changes because the air mass changes owing to the moving of the sun. Moreover, the spectral distribution, which is red- or blue-rich, changes with atmosphic conditions.20,21) For example, when the spectral distribution changes from blue-rich to red-rich owing to the changes in atmospheric conditions, the photocurrent of the top subcell decreased and limited the short-circuit current of multijunction solar cells.16) Therefore, the outdoor performance of a CPV module is strongly affected by atmospheric conditions.
In this paper, we discuss the outdoor operation of a fixed flat sub module with an InGaP/GaAs/InGaAs inverted metamorphic triple-junction solar cell (IMM module), which has no concentrator optics, for the first time in the world. The global solar spectral distribution is explained using the average photon energy (APE) index.22–24) A high APE means a solar spectral distribution with more photons in the short wavelength region. This condition is called the blue-rich spectral distribution. On the other hand, a low APE means a solar spectral distribution with more photons in the long wavelength region. This condition is called the red-rich spectral distribution. The global solar spectral distribution was measured to calculate the APE. The relationship between the APE and output of an IMM sub module was discussed. The cell temperature increases under real operating conditions during the operating hours of the cell, and the output of the cell decreases with increasing cell temperature.25,26) Therefore, the operating temperature was also measured and taken into account in the analysis.
2. Data analysis procedure
The IMM module with an aperture area of 986 cm2 was fabricated by SHARP.11,12) Figure 1 shows the photograph of the test site in the University of Miyazaki, Japan. The IMM module facing due south with a tilt angle of 35° was installed together with a Si solar cell module (Si module, Sharp NQ-143AD) as a reference. Global tilted irradiance with a tilt angle of 35° (GTI) was measured using a pyranometer (EKO MS-411). The global solar spectrum was measured using a spectroradiometer (EKO MS-711, MS-712) within the wavelength range of 300 to 1700 nm. Resistance temperature detectors (Pt100) were in direct contact with the module back surface to detect the module temperature (Tmod). The outputs of the modules were measured every 3 min using a current–voltage (I–V) tracer (EKO MP-160). GTI and Tmod were also recorded every 3 min. The measurement period was from November 2016 to October 2017. Throughout this study, the outdoor environmental condition was represented by APE and Tmod indexes. The detailed analysis procedure is described in Ref. 15. The integrated GTI and energy yield maps were constructed as functions of APE and Tmod, and the conversion efficiency of PV modules, which were calculated using the integrated GTI and energy yield maps, was evaluated. APE is determined as

where q is the electronic charge, E is the spectral irradiance, and Φ is the spectral photon flux density. For the limitation of our measurement system, a and b were set to 300 and 1700 nm, respectively. We also calculated spectral matching ratio (SMR), which shows the spectral balance of the solar irradiance.27–29) The commonly obtained photocurrent using the SMR was measured using a component cell sensor. The SMR is determined as

where i is the number of subcells, where the first subcell is the top subcell. In this study, the photocurrent of each subcell was estimated by the multiplication of the integrated measured global solar spectrum and the external quantum efficiency (EQE) of each subcell.

Fig. 1. Photograph of the test site in University of Miyazaki.
Download figure:
Standard image High-resolution image3. Results and discussion
Figure 2 shows the I–V characteristics of the IMM and Si modules under the outdoor conditions. The measurement was carried out in January 2017. The conversion efficiency of the IMM module was more than 30% under the actual outdoor condition. Figure 3 shows the daily energy yields per unit area of the (a) IMM and (b) Si modules. The energy yield of the IMM module was twofold that of the Si module. Figure 4 shows the normalized monthly performance ratio (PR) values of the IMM and Si modules. The output performance of the IMM module had a large seasonal variation. To clarify this seasonal variation, the outdoor environmental condition was represented by APE and Tmod indexes and the effects of environmental conditions on the integrated GTI and energy yield were determined. The measurement period was from November 2016 to October 2017.
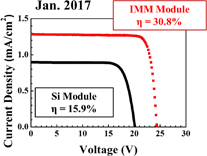
Fig. 2. I–V characteristics of IMM and Si modules under outdoor conditions.
Download figure:
Standard image High-resolution image
Download figure:
Standard image High-resolution image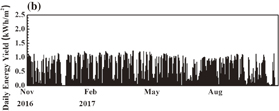
Fig. 3. Daily energy yields per unit area of (a) IMM and (b) Si modules.
Download figure:
Standard image High-resolution image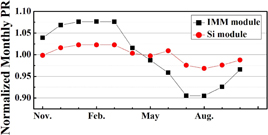
Fig. 4. Normalized monthly PR values of IMM and Si modules.
Download figure:
Standard image High-resolution imageFigure 5 shows the contour maps of integrated GTI in (a) all seasons, (b) winter, and (c) summer. In winter in Miyazaki, Japan, the most frequent condition of irradiance was close to 1.60 eV, as shown in Fig. 5(b), which is the value of the AM1.5G standard spectrum of ASTM G173-03,18) and the high output performance of the IMM module was achieved, as shown in Fig. 4. On the other hand, in summer, the most frequent condition of irradiance was in the high APE region. One reason for the high APE was the increase in water precipitation in summer compared with the standard air. The water has a high absorption coefficient at wavelength of 0.937, 1.12, and 1.395 µm.30) Therefore, the water absorbed the long wavelength region of solar spectrum and the total number of photons in the long wavelength region decreased.
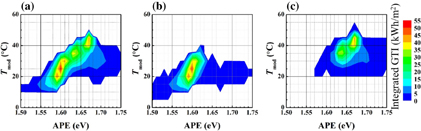
Fig. 5. Contour maps of integrated GTI in (a) all seasons (November 2016–October 2017), (b) winter (November 2016–April 2017), and (c) summer (May 2017–October 2017).
Download figure:
Standard image High-resolution imageFigure 6 shows the contour map of the energy yield per unit area of the IMM module in one year. The mapping pattern is almost same as that in Fig. 5(a) (integrated GTI map). The mapping of the outdoor performance of the IMM module was obtained by dividing the energy yield by the integrated GTI. Also, the Si module was analyzed similarly.

Fig. 6. Contour map of the energy yield per unit area of IMM module in one year.
Download figure:
Standard image High-resolution imageFigure 7 shows the contour maps of conversion efficiency for the (a) IMM and (b) Si modules as functions of APE and Tmod. An APE of 1.60 eV is calculated from the value of the AM1.5G standard spectrum shown by a broken red line. The conversion efficiency of the IMM module was much higher than that of the Si module and was markedly affected by APE rather than by Tmod under real environmental conditions, as shown in Fig. 7(a). The highest conversion efficiency of the module was observed at an APE of 1.60 eV. The conversion efficiency of the module decreased with the change of APE from 1.60 eV. In contrast, the conversion efficiency of the Si module showed almost no change with the change in APE.31)
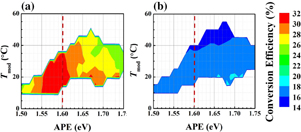
Fig. 7. Contour maps of conversion efficiency for (a) IMM and (b) Si modules as functions of APE and Tmod.
Download figure:
Standard image High-resolution imageWe calculated SMR using Eq. (2). The photocurrent of each subcell was estimated by the multiplication of the integrated global solar spectrum and EQE of each subcell. Figure 8 shows the EQE of the InGaP/GaAs/InGaAs inverted triple-junction solar cell.32) Figure 9 shows the calculated SMR as a function of APE. The red symbol shows  and the black symbol shows
  . SMR increased with the APE. In particular,
  markedly increased in the high APE region. Figure 10 shows the estimated photocurrent of each subcell normalized by irradiance as a function of APE. In the case of 1.60 eV or less, the photocurrent of the top subcell decreased owing to the red-rich spectrum, which limited the short-circuit current. In the case of more than APE of 1.60 eV, the photocurrent of the bottom subcell decreased owing to the blue-rich spectrum, which limited the short-circuit current.
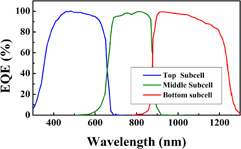
Fig. 8. EQE of the InGaP/GaAs/InGaAs inverted triple-junction solar cell.
Download figure:
Standard image High-resolution image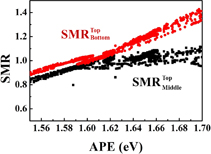
Fig. 9. Calculated SMR as a function of APE.
Download figure:
Standard image High-resolution image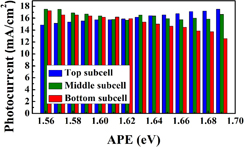
Fig. 10. Estimated photocurrent of each subcell normalized by irradiance as a function of APE.
Download figure:
Standard image High-resolution image
In a commonly used Ge-based triple junction solar cell, the bottom subcell has an excess photocurrent under real environmental conditions, and the photocurrent of the top or middle subcell limits the short-circuit current of the Ge-based triple junction solar cell.27) In an inverted triple-junction solar cell such as a current-matching design, the photocurrent of the top or bottom subcell limits the short-circuit current, as shown in Fig. 9. The absorption region of the bottom subcell overlaps with the water absorption region in the solar spectrum; therefore, environmental conditions such as water precipitation greatly affect the output of the current-matching inverted triple-junction solar cell.
4. Conclusions
We discussed the outdoor operation of an IMM module. The conversion efficiency of the IMM module was more than 30%. However, the output performance of the IMM module had a large seasonal variation. The outdoor environmental condition was represented by APE and Tmod indexes, and the relationships between environmental conditions and the integrated GTI and energy yield could be determined. The conversion efficiency of the IMM module was markedly affected by APE rather than by Tmod under real environmental conditions. We also calculated SMR. In particular,  markedly increased in the high APE region. In the case of APE of more than 1.60 eV, the photocurrent of the bottom subcell decreased owing to the blue-rich spectrum, which limited the short-circuit current. The absorption region of the bottom subcell overlapped with the water absorption region in the solar spectrum; therefore, environmental conditions such as water precipitation greatly affect the output of the current-matching inverted triple-junction solar cell.
Acknowledgments
Part of this work was supported by the New Energy and Industrial Technology Development Organization (NEDO) under the Ministry of Economy, Trade and Industry Japan (METI), and a grant for Scientific Research on Priority Areas from the University of Miyazaki.