

Abstract
We present a review of luminol-based electrochemiluminescence (ECL) biosensors that perform enzymatic reactions and bioanalysis using antioxidant molecules by controlling the spatiotemporal production of a luminescent substrate, catalase activity, and glycated albumin (GA). The ECL intensity depends on the antioxidant capacity because radicals are neutralized by the antioxidants, which suppresses the luminescence. The antioxidant capacities of 22 types beverages were evaluated by comparison with a standard curve of Trolox. The time necessary for the ECL measurement of the antioxidant capacity is only 2 min with screen-printed electrodes and a portable ECL measurement system. Our system was also used to monitor reactive oxygen species released from neutrophils, which play an important role in the immune system, defending against viral and bacterial infections. The quenching of ECL imaging by catalase reaction localized in the multichamber electrode using the electrogenerated substrate was examined as a potential candidate for a sensitive reporting system. The substrate was successfully generated at applied potentials between −1 and −0.4 V in multichamber electrodes and the substrate confinement within the chamber was observed within 60 s of generation. The microchamber electrode system demonstrated a detection limit of 90 fM catalase. We also demonstrated a detection limit of 0.1 µM GA in human serum albumin, which is an improvement of about 70 times over colorimetric methods.
Export citation and abstract BibTeX RIS
1. Introduction
The development of biosensors has focused on developing tools that can directly capture target signal molecules.1) A biosensor typically consists of a biomolecule recognition element for selectively capturing target biomolecules and a transducer that converts the resulting molecular reaction into signals such as electricity and light (Fig. 1). The first biosensor was a glucose sensor with an enzyme immobilized on the electrode.2) Today, this biosensor is a device that can quickly and easily measure blood sugar not only in medical settings but also at home and work. The global market for glucose sensors has grown to be worth 1 trillion yen and so on. Biosensors use not only enzymes but also antibodies, receptors, genes, and so on as molecular recognition elements. We have developed various electrochemical biosensors with printable electrodes and mobile electrochemical devices, which have led to wearable biosensors for Internet of Things (IoT) systems.3–9) In addition to electrode devices, various other transducers, such as light detection and piezoelectric devices, have been used (Fig. 1). This review is focused on the authors' latest results from electrochemiluminescence (ECL) biosensors and their applications. For our ECL devices, we use inexpensive printed electrodes that can be mass-produced similarly to blood sugar sensors. Photon counting is also a possible photodetector technique and ultrahigh-sensitivity detection, such as single-molecule measurement, is expected.
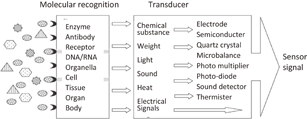
Fig. 1. Principle of biosensor.
Download figure:
Standard image High-resolution image2. Mechanism of ECL
Light emission can result from either a physical or chemical process. The physical process uses devices such as thermal radiation filaments (Joule heat), fluorescent lamps (gas discharge), or light-emitting diodes (semiconductor pn junction), which can utilize either solids or gases. Chemiluminescence (CL) occurs as a result of the cleavage of the bond of a reaction intermediate, as observed in firefly luminescence and chemical light. ECL is based on the luminescent reaction induced by reaction intermediates that are generated and induced by electrochemical reactions occurring on electrodes. Since the initiation of the luminescence reaction can be controlled by changing the potential on the electrode, it is possible to perform accurate measurement as compared with the CL method. ECL has become a powerful analytical tool and has been used for practical applications in environmental monitoring and biomedical diagnosis.
Generally, two dominant pathways are postulated for the generation of ECL:10–12) annihilation and coreactant ECL pathways (Fig. 2). The annihilation ECL pathway is where both the oxidized and reduced forms of a luminophore are electrochemically produced. The interaction of these species yields both the ground state and an electronically excited state, which then relaxes with photon emission. This pathway only requires electrochemiluminescent species, a solvent, and a supporting electrolyte to generate light. The downside is that the potential window of water is not sufficient for a luminophore to be reduced or oxidized, making it necessary to use organic solvents. In the coreactant ECL pathway, ECL is generated in the presence of a coreactant. It involves the oxidation and reduction of a luminophore and subsequent reaction with the coreactant (Fig. 3). This pathway facilitates ECL generation in an aqueous solution, which is advantageous for applications in a wide range of assays of biological relevance. For both pathways, the enthalpy change of the overall reaction for the formed activated species must be larger than the enthalpy of producing excited state species from the ground state for the luminescence reaction to occur. The total enthalpy change is related to the amount of energy emitted and the observed wavelength is dependent on this energy. ECL has been mainly studied using tris(2,2'-bipyridyl)ruthenium(III) [Ru(bpy)3]3+ as the luminophore and tripropylamine (TPA) as the coreactant. Owing to their good stability and ECL efficiency in aqueous media, this combination has broad applications in commercial ECL immunoassays and DNA analyses. Luminol is a classical organic compound used for ECL. The ECL of luminol is often produced in an alkaline solution in the presence of hydrogen peroxide. Since luminol is a pH-dependent substance with pKa of 6.00, the deprotonated ion undergoes subsequent cascade of luminescence reactions. Many biological activities involve the transformation or metabolism of hydrogen peroxide, which can be detected by luminol ECL with high sensitivity. For that reason, luminol-based ECL has applications in various biosensors.

Fig. 2. Proposed pathway for ECL generation.
Download figure:
Standard image High-resolution image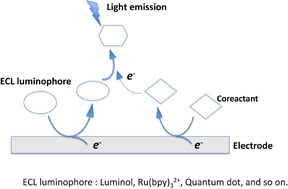
Fig. 3. Coreactant ECL mechanism.
Download figure:
Standard image High-resolution imageLuminol was oxidized on the electrode surface in the range of +0.2 to +0.3 V, as shown in Fig. 4, to become a radical or diazoquinone. After oxidized luminol react with reactive oxygen species (ROSs) such as O2− and H2O2 and moved to the excited state, they emit light when they are return to the ground state. When ROSs are generated on the electrode by applying −1 to −0.5 V, luminescence can be induced without adding ROSs (Figs. 4 and 5).13) In this example, a printed electrode, EP-P (BioDevice Technology), and an ECL-measuring device, BDT-eCLP 100 (BioDevice Technology), were used.
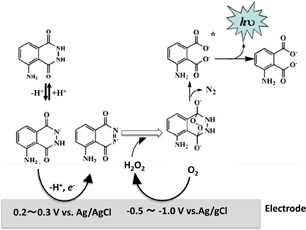
Fig. 4. ECL mechanism of luminol.
Download figure:
Standard image High-resolution image
Fig. 5. (a) ECL and (b) cyclic voltammograms from luminol. Potential ranges of cyclic voltamograms are shown from (1) to (5). Inset ECL profiles in (a) are shown at the starting potentials of −0.5 and −0.6 V. Three printed electrodes were prepared as one chip (c). This figure is reproduced from Fig. 2 in Ref. 13.
Download figure:
Standard image High-resolution image3. ECL sensor for antioxidants in food and beverage products
A simple and rapid method for the measurement of the antioxidant capacity using a portable ECL device with a screen-printed electrode is described. The ECL method is based on the luminous reaction of ROSs, luminol radicals and antioxidants. ROSs are generated by the electrochemical reduction of dissolved oxygen and competitively react with the luminol and antioxidants. An antioxidant standard curve was generated using different concentrations of known amounts of Trolox by ECL measurement and the detection limit for the antioxidant capacity was found to be 0.06 mM Trolox.13)
Figure 6 shows the ECL intensity and the cyclic voltammograms obtained from representative beverages. The peak ECL intensities are observed at potentials where the luminol was oxidized. The peak ECL intensity was expressed as the Trolox equivalent (TE) value calculated from the standard curve. Figure 7 shows the scatter diagrams of the antioxidant capacities measured by the ECL and oxygen radical absorbance capacity (ORAC) methods. ORAC assay14,15) was chosen as a reference assay to evaluate the ECL method and antioxidant capacity. A positive correlation was observed and the correlation coefficient was calculated as R2 = 0.8304. However, the ECL profiles did not correspond well to the ORAC data because of their different mechanisms of detecting the different types of antioxidants that were present in the beverage and food products. Five types of Japanese tea (green tea; Nos. 1–5) were compared. They were arranged in order of large-to-small TE values as No. 5 ≫ No. 1 > No. 2, No. 3 > No. 4, which was the same order as the ORAC TE values. A linear relationship was observed between ECL and ORAC, as shown by the green dotted line in Fig. 7. Japanese green tea includes catechin derivatives as the primary antioxidants. The black and jasmine samples did not share a linear relation with Japanese green tea probably because they did not contain many catechins and contained different antioxidants, which would explain the location of these plotted points. The plotted points of three types of coffee (Nos. 1–3) also exhibited a linear relation, as shown by the brown dotted line in Fig. 7(a). Coffee No. 3 showed the highest ORAC TE value because of a high chlorogenic acid content, which was 270 mg/180 mL in one bottle. To evaluate the difference in TE value between coffee No. 1 and coffee No. 3, the radical scavenging activity of each against O2 and OH was measured using electron spin resonance (ESR). The radical scavenging activity was estimated from a slope obtained from a Stern–Volmer type plot. Coffee No. 3 showed a higher radical scavenging activity than coffee No. 1. The ESR-based radical scavenging activity indicated that coffee No. 3 was 2.03 and 1.75 times more active than coffee No. 1 against O2 and OH, respectively. Coffee No. 3 was 1.66 (for ECL) and 2.45 times (for ORAC) more active than coffee No. 1. The antioxidant capacity of beverages (22 types) was evaluated by comparison with the standard curve of Trolox. The time necessary for the ECL measurement of the antioxidant capacity is only 2 min after combining the sample solution with luminol on a screen-printed electrode.13)
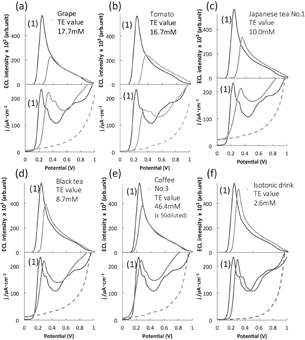
Fig. 6. ECL responses of luminol (upper graph) and cyclic voltammograms (lower graph). (a) grape juice, (b) tomato juice, (c) Japanese tea No. 1, (d) black tea, (e) coffee No. 3, and (f) isotonic drink. 0.5 mM luminol solution was used as control, as were shown in (1). This figure is reproduced from part of Fig. 4 in Ref. 13.
Download figure:
Standard image High-resolution image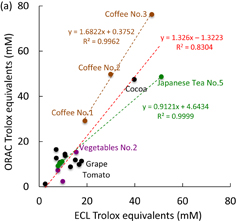
Download figure:
Standard image High-resolution image
Fig. 7. Comparison of ECL and ORAC Trolox equivalent values: (a) all samples and (b) low-TE-value samples.
Download figure:
Standard image High-resolution image4. ECL analysis system for active oxygen species generated by neutrophils
In this study, we aimed to develop a system that can detect active oxygen associated with various diseases at the single cell level. The ECL method using luminol is capable of highly sensitive and reproducible measurement and imaging of active oxygen species. In addition, since the printable electrode can be easily mass-produced, it can be disposed of, making it suitable for biological sample analysis. Our ECL system was applied to monitoring ROSs released from neutrophils, which play an important role in the immune system, defending against viral and bacterial infections. Excessive active oxygen is known to cause vasculitis, and it is therefore useful for the diagnosis of vasculitis to measure the active oxygen production activity of neutrophils.16,17)
A luminol ECL system was used to measure hydrogen peroxide, which is one type of active oxygen species and the potential was controlled with a small potentiostat connected to a BDTeCLP-100. We optimized the conditions for luminescence measurement and the detection limits of hydrogen peroxide. When the potential was scanned between 0 and 700 mV against Ag/AgCl, the maximum light emission was obtained at around 400 mV. Peak light intensity was correlated in the range of 0.1 to 100 µM. This result indicated that ECL provided sensitivity 100 times higher than electrochemical detection methods. The measurement required several seconds; quick measurement is also an advantage.
Neutrophils contain 2,000 to 7500 cells in 1 uL of human peripheral blood. Neutrophils were separated from the human blood and induced the production of active oxygen by Phorbol 12-myristate 13-acetate (PMA). The luminescence intensity increased with increasing neutrophil concentration. When PMA was used at 25 µM, 40 µM hydrogen peroxide was detected as the steady state. In addition, the hydrogen peroxide produced by neutrophils was imaged on a microchamber array electrode using a high-sensitivity CCD camera. It detected single neutrophils that produced active oxygen species after PMA stimulation (Fig. 8).

Fig. 8. ECL detection of ROSs released from neutrophils onto microchamber electrode. Red spheres indicate neutrophils in (3). (1) Detection process, (2) ECL response, and (3) structure of microchamber electrode.
Download figure:
Standard image High-resolution image5. ECL enzyme sensor for glycated hemoglobin with high sensitivity
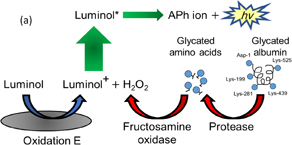
Monitoring of blood glucose content is vital for diabetes patients. The conventional widely used method involves an invasive procedure for blood sampling. In addition, blood glucose measured by this method is affected by immediate food consumption and it cannot accurately show baseline blood glucose levels. Glycated albumin (GA), which reflects the average blood glucose level over the previous 2 weeks, can be used for glycemic control in a shorter span than HbA1c and has less fluctuation than direct blood glucose measurement.18,19) In this method, GA was decomposed with a proteolytic enzyme, and hydrogen peroxide was produced using a glycated amino acid and an oxidizing enzyme,20) and GA was measured by ECL [Fig. 9(a)].21) The initial concentrations of GA tested ranged from 0.3 to 30 µM, which were diluted about 3 times after protease digestion and FAOx reaction, and the resulting GA concentrations are plotted in Fig. 9(b). The ECL response showed the concentration dependence of GA, and indicates the successful digestion of albumin and the subsequent FAOx reaction. The lowest GA concentration detected was 0.1 µM, and the ECL intensity of the tested GA concentration increased up to 2 µM. As for the limit of detection, GA concentrations were measured in the 0 to 10 µM range. The result showed that the lowest measurable GA concentration was 0.1 µM (6.6 µg/mL). This is an improvement in sensitivity of about 10–100 times compared with those in the case of conventional methods.22–25) It is even possible to measure GA in saliva because of the high sensitivity of this method.
Download figure:
Standard image High-resolution image
Fig. 9. (a) ECL assay for GA and (b) calibration. APh indicates 3-aminophtalate. Part (b) of this figure is reproduced from Fig. 5 in Ref. 21.
Download figure:
Standard image High-resolution imageWe also reported other ECL enzyme sensors for glucose26) and urea27) with glucose oxidase and urease, which catalyze the oxidation of glucose and the hydrolysis of urea, respectively. Glucose oxidase produces hydrogen peroxide, which causes ECL amplification. Urea causes a pH shift by producing ammonia and ECL was amplified under alkaline conditions.
6. ECL sensor array for digital counting biomolecules
We have designed a device for digitally counting biomolecules. When a single molecule is present in a very small chamber with a volume of fL–nL scale, the concentration in the chamber is in the range of 1 nM–1 fM. Signal amplification is required for the detection of single molecules. SOD and catalase are known as enzymes with ultrahigh turnover numbers of 10 million molecules/s28) and could be used as catalysts for signal amplification. The DNA amplification enzyme used for PCR could also provide the signal amplification of a million times. If such a molecular amplification reaction system is used in very small chambers, single molecules can be rapidly amplified to a large number of detectable molecules.
The presence or absence of single molecules is expressed as a digital numerical value corresponding to the number of chamber arrays. This can be used as a sensor for digitally counting biomolecules. Furthermore, as shown in Fig. 10, it is possible to measure a more precise and ultrawide dynamic range based on the Poisson distribution according to the concentration range.29,30) In addition, at extremely small volumes, the molecular diffusion time for the object to be measured to reach the sensor is on the order of milliseconds to seconds, and it thus has superiority over other methods as a short and real-time measurement method.

Fig. 10. Digital counting for ultrawide dynamic range based on the Poisson distribution. The figure is reproduced from Fig. 8 in Ref. 30.
Download figure:
Standard image High-resolution imageTherefore, by focusing on ECL using luminol, it was established that the generation of a luminescent substrate can be controlled by changing the electrode potential. Active oxygen species can control the generation of luminol active species at a negative potential, and the luminescent reaction can be controlled by scanning both potentials. To control spatial light emission, many microchambers were formed on the electrodes and luminescence imaging analysis was carried out. The enzyme catalase degrades hydrogen peroxide, which was measured using a microscopic luminescence imaging system (Fig. 11).31) We analyzed the amount of light emission quenched by reacting the catalase with the electrochemically generated ROSs as substrates (Fig. 12). Catalase concentrations of 90 fM and 190 nM were detected with and without immobilizing on magnetic particles, respectively. It indicated high sensitivity of 106 times with magnetic particles. From the enzyme kinetics perspective, the immobilization of the enzyme on magnetic nanoparticles allowed the control of enzyme positioning within the chambers, which is advantageous because the floating free catalase in a chamber reacts with the substrate at a lower frequency than the catalase located near the substrate origin. The reaction velocity relationship with the substrate concentration comes into effect and the enzyme located near the electrode surface is exposed to a higher substrate concentration. In addition to the enzyme being close to the electrode surface, a small volume reaction chamber confines the generated substrate and allows for the concentration to be increased within the picolitre-volume chamber with only a few molecules. This technique is well used for the detection of single molecules. The accumulation of the enzymatically catalyzed fluorogenic substrate at femtolitre volumes is measured. Table I shows the calculated amounts of magnetic nanoparticles in each chamber. The average number of beads in a chamber was calculated by dividing the number of beads dropped on a chip by the number of wells on a chip. One underlying assumption was that all loaded beads settle in a chamber and not on the dielectric material between the chambers. At catalase concentrations of 90 fM to 90 pM, each chamber contained an average of 5 to 5000 beads, whereas at the measured catalase concentration of 9 fM, each chamber, contained less than one bead. At such a microscale, the presence of catalase-immobilized magnetic particles (CAT-MB) in a chamber becomes a matter of probability, where the chance of molecules entering a chamber follows the Poisson distribution.
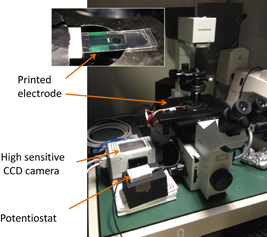
Fig. 11. ECL imaging system with microscope and high-sensitivity CCD camera.
Download figure:
Standard image High-resolution image
Download figure:
Standard image High-resolution image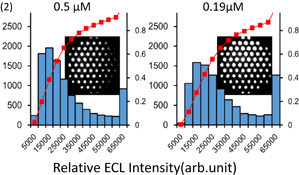
Fig. 12. Quenched ECL images of catalase activity using CAT-MBs. The CAT-MB concentrations between 10 pg/µL and 1 ng/µL were tested on the multi-microchamber electrode shown in (1). Frequency distribution graphs of ECL intensity at different catalase concentrations with the corresponding ECL images are shown in (2). The gray boxes represent frequency with the scale on the left and the square plots represent the cumulative ratio with the scale on the right. This figure is reproduced from part of Fig. 6 in Ref. 31.
Download figure:
Standard image High-resolution image
Table I. Calculated amount of magnetic nanoparticles in chamber (reported from Table I in Ref. 31).
| Concentration of magnetic beads in sample | Number of beads loaded on chip | Number of beads per chamber | Estimated number of CAT molecules in each chamber | Enzyme activity per chamber |
|---|---|---|---|---|
| 1 ng/µL | 3.6 × 10⁵ beads | 4900 | 1.5 × 10⁶ | 3.15 µU |
| 100 pg/µL | 490 | 150000 | ||
| 10 pg/µL | 50 | 15000 | ||
| 1 pg/µL | 3.6 × 10² beads | 5 | 1500 | 3.15 nU |
| 100 fg/µL | 0.5 | 150 | ||
| 10 fg/µL | 0.05 | 15 | ||
| 1 fg/µL | 0.36 beads | 0.005 | 1.5 | 3.15 pU |
7. Conclusions
Focusing on ECL, we propose a platform that performs enzymatic reaction and bioanalysis linked with antioxidant molecules by controlling the spatiotemporal production of a luminescent substrate, catalase activity, and glycated albumin. We also showed a novel measurement system that performs digital biomolecular analysis by linking microfluidic control chip technology and an ECL system.
Acknowledgments
This work was supported in part by a Grant-in-Aid for Scientific Research (Kiban S, No. 15H05769) and JST CREST Grant Number JPMJCR16G2, Japan.