

Abstract
Artificial olfaction, that is, a chemical sensor system that identifies samples by smell, has not been fully achieved because of the complex perceptional mechanism of olfaction. To realize an artificial olfactory system, not only an array of chemical sensors but also a valid feature extraction method is required. In this study, we achieved the identification of spices by smell using nanomechanical membrane-type surface stress sensors (MSS). Features were extracted from the sensing signals obtained from four MSS coated with different types of polymers, focusing on the chemical interactions between polymers and odor molecules. The principal component analysis (PCA) of the dataset consisting of the extracted parameters demonstrated the separation of each spice on the scatter plot. We discuss the strategy for improving odor identification based on the relationship between the results of PCA and the chemical species in the odors.
Export citation and abstract BibTeX RIS
1. Introduction
Olfaction is the only human sense that has not been fully realized as a practical sensor. As olfaction plays an important role in our daily lives, artificial olfaction is expected to be applied to various fields such as food, medicine, environment, cosmetics, and safety.1) One of the reasons for the lack of artificial olfaction is the complex mechanism of the olfactory system. In the case of humans, odor molecules inhaled through the nose are detected by olfactory receptors in the nasal epithelium. The resultant neural signals are then transmitted to the olfactory bulb, in which odors are identified according to the induced pattern on the bulb.2,3) To realize an artificial olfactory system, therefore, both an array of chemical sensors and appropriate data analysis methods are required.
Over the past decades, several types of chemical sensors, such as metal–oxide sensors,4) conducting polymer sensors,5) and optical sensors,6) have emerged. Several groups have reported odor identification using such chemical sensors.1,7) Not only single-component gases but also complex mixtures of gases were identified using an array of chemical sensors.8,9)
For more valid identification of odors, however, several issues should be addressed. One such issue is the effect of solvents. Although humans often recognize odor molecules in the air at the concentration of several parts per million (ppm), the vapor of liquid samples (e.g., juice, wine, and whiskey) contains even higher concentrations (∼1%-level) of solvent vapors (e.g., water and ethanol), making it difficult to distinguish odor molecules by means of chemical sensors. Thus, it is essential for artificial olfactory systems to distinguish odor molecules from solvent vapors.
Here, we report odor identification using nanomechanical sensors and demonstrate the identification of dried spices by smell without being affected by the solvent issue. Nanomechanical sensors have been attracting great attention owing to their potential for highly sensitive detection and intrinsic versatility.10,11) By utilizing a membrane-type surface stress sensor (MSS),12) we successfully distinguish the smells of spices. An appropriate feature extraction protocol as well as the use of dried samples makes it possible to identify the pure smells of spices. A mobile artificial olfactory system would be feasible in conjunction with a compact measurement module that can be realized by using MSS.
2. Experimental methods
In this study, we employed the gas flow system shown in Fig. 1(a) to measure the odors of spices. Spices were placed in the vial connected to mass flow controller (MFC)-1. The "smell" of a spice saturated in the headspace was injected to the sensor chamber with 100 sccm N2. MFC-2 was used for the N2 purge (100 sccm). In this measurement, the headspace vapor was injected for 2 min, followed by 2 min N2 purge. The cycle of injection and purge was repeated 5 times, and the last three cycles were used for analysis. We utilized a third-generation MSS (3G-MSS) chip, which has a two-dimensional (2D) array of MSS on a single chip and consists of four channels (2 × 2). Each channel has the same dimensions as a 2G-MSS with a membrane diameter of 300 µm.13) The following polymers were coated on each channel using a commercial spray coater, as shown in Fig. 1(b): poly(vinyl pyrrolidone) (PVP), poly(allylamine hydrochloride) (PAH), poly(methyl methacrylate) (PMMA), and PVP/PMMA hybrid ( in weight) for channels number 1 (Ch1), 2 (Ch2), 3 (Ch3), and 4 (Ch4), respectively. The chemical structures of these polymers are shown in Fig. 1(c). Signals were measured at a sampling rate of 10 Hz, applying a bias voltage of −0.5 V to the Wheatstone bridge circuit in the MSS. We measured the smells of seven spices: cinnamon, oregano, parsley, garlic, nutmeg, rosemary, and yuzukosho (citrus-flavored pepper). Each spice was well dried and used as flakes or powder.

Fig. 1. (Color) (a) Gas flow system for measurement. (b) Optical microscopy image of MSS chip with polymers coated on each channel. (c) Molecular structures of the polymers.
Download figure:
Standard image High-resolution image3. Results
Figure 2 shows the output signals obtained at each channel. It is clear that each spice leads to different sensing responses in accordance with the chemical composition of the vapor.

Fig. 2. (Color) Obtained sensing signals for measurement. Baseline correction was applied to all the signals to deal with baseline offset and drift.
Download figure:
Standard image High-resolution imageTo identify the spices by smell, appropriate features must be extracted from the sensing signals. We focus on both static and dynamic information for signal analysis, namely, signal intensity ratio and decay time constant. We defined the signal intensity of channel number  , as shown in Fig. 3(a). Odors can be identified using I1–I4 through pattern recognition. However, the pattern recognition using I1–I4 strongly depends on their absolute values: the total concentration of odors. To identify the odors by their chemical characteristics without being affected by their concentration, relative intensity ratios were employed for signal analysis instead of I1–I4. In this study, we used signal intensity ratio of Ch2–Ch4 to Ch1 (I2/I1, I3/I1, and I4/I1). In our experimental setup, the concentration of odors during the measurements can be regarded as constant for each spice without a time-dependent fluctuation.

Download figure:
Standard image High-resolution image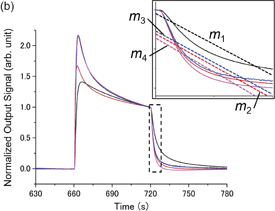
Fig. 3. (Color) Definitions of (a) I1–I4 and (b) m1–m4.
Download figure:
Standard image High-resolution imageAnother important feature of the signal is the transient response, which reflects the dynamic information of gas absorption/desorption. Here, we focus on the purge portion of the measurement: the decay curve. Assuming an exponential decay for the purge portion of the sensing signals, the output signal at time t, Vout(t), can be expressed by

where τ is the decay time constant, t0 is the time at which the decay starts, and V0 = Vout(t0). By fitting all the sensing signals with Eq. (1), τ can be extracted from the four channels (τ1–τ4) for some samples. However, fitting all the sensing signals with Eq. (1) is not applicable because some sensing signals do not show a simple exponential decay (Fig. 2). For example, sensing signals of Ch4 for cinnamon show large undershoots, which cannot be reproduced with Eq. (1). Although it is possible to reproduce such undershoots with the sum of two or more exponential decay functions, it requires a complex fitting algorithm. To extract dynamic information from the decay curve, a linear least-squares fit was applied to the normalized decay curves [Fig. 3(b)]. The linear fit cannot represent the entire feature of the decay curve; nevertheless the slope m reflects the dynamic behavior of the sensing signals to some extent. The linear least-squares fit was applied to every decay portion of the sensing signal, and m values from the four channels (m1–m4) were extracted for every measurement.
On the basis of the discussion above, we extracted the relative intensity ratios  and the slopes of the linear fit
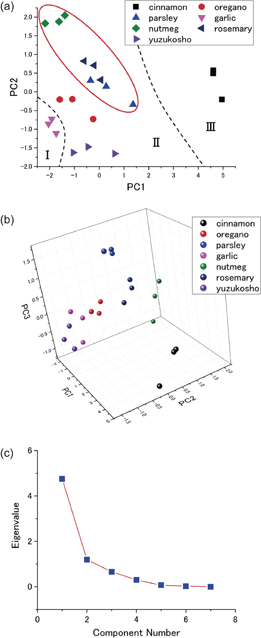
  from each cycle of injection and purge, as summarized in Table I. To identify the odors of the spices, principal component analysis (PCA) was performed on the dataset. Figures 4(a) and 4(b) show the 2D and 3D scatter plots of the component scores. Data points obtained for the same spice appear to form a cluster in the scatter plot, and each spice cluster is well separated from others. The scree plot shows a steep curve from components number 1 to 3 and an almost flat line from 4 to 7 [Fig. 4(c)], indicating that principal components 1 to 3 cover most of the variability (94.39%). The eigenvalues are summarized in Table II.
Table I. Data set (extracted parameters) for PCA.
| Samples | I2/I1 | I3/I1 | I4/I1 | m1 | m2 | m3 | m4 |
|---|---|---|---|---|---|---|---|
| cinnamon1 | 0.461 | 0.036 | 0.254 | −0.0892 | −0.0808 | −0.0840 | −0.0966 |
| cinnamon2 | 0.463 | 0.033 | 0.259 | −0.0876 | −0.0812 | −0.0831 | −0.0960 |
| cinnamon3 | 0.475 | 0.032 | 0.260 | −0.0869 | −0.0821 | −0.0820 | −0.0966 |
| oregano1 | 0.626 | 0.022 | 0.253 | −0.0752 | −0.0916 | −0.0871 | −0.0922 |
| oregano2 | 0.706 | 0.021 | 0.255 | −0.0728 | −0.0928 | −0.0882 | −0.0914 |
| oregano3 | 0.781 | 0.021 | 0.254 | −0.0710 | −0.0927 | −0.0891 | −0.0915 |
| parsley1 | 0.543 | 0.024 | 0.252 | −0.0772 | −0.0849 | −0.0828 | −0.0901 |
| parsley2 | 0.584 | 0.023 | 0.255 | −0.0752 | −0.0871 | −0.0852 | −0.0895 |
| parsley3 | 0.630 | 0.022 | 0.256 | −0.0735 | −0.0887 | −0.0861 | −0.0894 |
| garlic1 | 0.784 | 0.020 | 0.249 | −0.0694 | −0.0928 | −0.0880 | −0.0911 |
| garlic2 | 0.841 | 0.020 | 0.250 | −0.0686 | −0.0917 | −0.0888 | −0.0913 |
| garlic3 | 0.887 | 0.020 | 0.248 | −0.0681 | −0.0910 | −0.0899 | −0.0923 |
| nutmeg1 | 0.858 | 0.021 | 0.264 | −0.0708 | −0.0887 | −0.0891 | −0.0903 |
| nutmeg2 | 0.926 | 0.021 | 0.263 | −0.0698 | −0.0886 | −0.0894 | −0.0909 |
| nutmeg3 | 0.989 | 0.020 | 0.261 | −0.0689 | −0.0881 | −0.0920 | −0.0915 |
| rosemary1 | 0.587 | 0.023 | 0.259 | −0.0766 | −0.0902 | −0.0882 | −0.0921 |
| rosemary2 | 0.624 | 0.023 | 0.260 | −0.0751 | −0.0904 | −0.0874 | −0.0910 |
| rosemary3 | 0.658 | 0.022 | 0.261 | −0.0743 | −0.0912 | −0.0885 | −0.0912 |
| yuzukosho1 | 0.554 | 0.023 | 0.248 | −0.0775 | −0.0899 | −0.0872 | −0.0940 |
| yuzukosho2 | 0.604 | 0.022 | 0.248 | −0.0745 | −0.0910 | −0.0883 | −0.0923 |
| yuzukosho3 | 0.661 | 0.021 | 0.248 | −0.0727 | −0.0938 | −0.0888 | −0.0930 |
Fig. 4. (Color) (a) 2D- and (b) 3D-scatter plots of the component scores. (c) Scree plot of eigenvalues.
Download figure:
Standard image High-resolution image
Table II. Eigenvalues from PCA.
| Component | Eigenvalues | % of variance | Cumulative % |
|---|---|---|---|
| 1 | 4.7552 | 67.93 | 67.93 |
| 2 | 1.19233 | 17.03 | 84.96 |
| 3 | 0.65953 | 9.42 | 94.39 |
| 4 | 0.29893 | 4.27 | 98.66 |
| 5 | 0.06726 | 0.96 | 99.62 |
| 6 | 0.02539 | 0.36 | 99.98 |
| 7 | 0.00135 | 0.02 | 100.00 |
4. Discussion
The present results show the identification of spices by smell. It is important to note that these results are not affected by undesired components such as the vapor of solution. Another important key to this odor identification is the feature extraction method. In this study, both static and dynamic information contribute to the discrimination of each spice. Static information, that is, the combination of relative intensity ratios  , is strongly related to the affinity of the receptor materials to odor molecules. In general, a higher affinity leads to a higher signal intensity. For example, the MSS coated with hydrophilic polymer (PVP) exhibits a higher signal intensity for water vapor than that coated with hydrophobic polymer (PMMA). Thus, odors from different spices cause different signal intensity ratios (
 , or
, or  ) in accordance with the affinities of the receptor materials to the odor molecules. In contrast, the slopes of the linear fit to the decay curve
  reflect the desorption dynamics of odor molecules from the receptor materials. According to the theoretical model for a cantilever coated with viscoelastic materials reported by Wenzel et al.,14) transient responses contain the dynamics of gas sorption/desorption as well as the viscoelastic behaviors of the receptor materials. Since the dynamic behavior of gas desorption from a polymer should be unique to the gas species, m can be utilized to identify the odors.
As the features extracted in this study correlate with the chemical interactions between receptor materials and odor molecules, the scatter plot should reflect the chemical characteristics of the odor molecules. Table III shows the main volatile organic compounds in each spice.15–28) On the basis of the chemical species, spices are roughly categorized into three groups as shown in Fig. 4(a). Among these groups, group II is composed of spices containing mainly terpenes and terpenoids in their vapors. Terpenes are natural organic compounds that can be built up from units of isoprene (C5H8). Terpenoids are regarded as derivatives of terpenes and contain oxygen-containing functional groups such as hydroxyl and carbonyl groups. It is found that spices that contain terpenes and terpenoids appear in close proximity in the scatter plot. In particular, spices marked with a circle in Fig. 4(a) contain pinene (C10H16), a kind of terpene with a bicyclic structure. Although spices in groups I (garlic) and III (cinnamon) also contain a certain amount of terpenes, the major components of their vapors are not terpenes but organosulfur compounds and aromatic aldehydes, respectively.
Table III. Major volatile organic compounds in vapors of spices.
| Spices | Major components |
|---|---|
| Cinnamon15,16) | cinnamaldehyde |
| Oregano17) | carvacrolb), cymenea) |
| Parsley18,19) | 1,3,8-p-menthatrienea), pinenea), phellandrenea) |
| Garlic24) | allicin, 2-propene-1-thiol, diallyl disulphide |
| Nutmeg20,28) | pinenea), sabinenea), myristicin |
| Rosemary | pinenea), camphorb), camphenea), 1,8-cineoleb) |
| Yuzu25,27) (Citrus junos Sieb. ex Tanaka) | limonenea), terpinenea) |
| Peppers21,23) | caryophyllenea), carenea), limonenea) |
a) terpenes, b) terpenoids
Finally, we discuss a strategy for improving smell identification. As most of the spices contain mainly terpenes and terpenoids, using receptor materials with high chemical affinity to such hydrocarbons would improve the sensitivity. It is expected that hydrophobic materials will be more sensitive to such hydrocarbons rather than hydrophilic materials.29–31) In addition to using receptor materials with high affinity to target molecules, the increase in the number of channels can improve the performance of smell identification. Even with a sensor chip having many channels, however, it is important to choose reasonable combinations of receptor materials on the basis of the expected variation in the features with an appropriate extraction protocol.
5. Conclusions
We successfully identified seven spices by smell using polymer-coated MSS. By using both static and dynamic information extracted from the sensing signals, odors were identified through PCA, which reflects the chemical composition of the vapors. We demonstrated the identification of samples by pure smell and showed a feature extraction protocol that can identify odors on the basis of their chemical characteristics. Considering the compact measurement system realized by MSS, this study will be an important step towards realizing a mobile artificial olfactory system.
Acknowledgments
This research was supported by the Grant-in-Aid for Young Scientists (B) 16K21602 MEXT, Japan; the Grant-in-Aid for Scientific Research (B) 15H03588, MEXT, Japan; TEPCO Memorial Foundation; and the World Premier International Research Center Initiative (WPI) on Materials Nanoarchitectonics (MANA).
Biographies

Gaku Imamura received his M.S. and Ph.D. in Science from the University of Tokyo, Japan, in 2010 and 2013, respectively. He was a project assistant professor at the Graduate School of Frontier Sciences, the University of Tokyo, from 2013 to 2014. He was a postdoctoral researcher at the WPI Center for Materials Nanoarchitectonics (WPI-MANA), National Institute for Materials Science (NIMS) from 2015 to 2016. He is now ICYS-MANA researcher at NIMS. His research interests lie in the field of chemical sensors, particularly in nanomechanical sensors. Currently he is developing an analysis method for sensor signals.

Kota Shiba received his M.S. and Ph.D. degree from Waseda University, Japan, in March 2009 and March 2012, respectively. Then, he moved to National Institute for Materials Science (NIMS) in April 2012 as a postdoctoral researcher. He was selected as an ICYS-MANA researcher at NIMS in September 2014. Since August 2016, he is a MANA scientist at NIMS as a member of the newly developed nanomechanical sensor group. His research interests include design and applications of nanomaterials, physical/chemical sensors, etc.

Genki Yoshikawa received his M.S. and Ph.D. in Science from the University of Tokyo, Japan, in 2001 and 2004, respectively. He was Assistant Professor at Institute for Materials Research (IMR), Tohoku University, Japan (2005–2008), Visiting Scientist at Department of Physics, University of Basel, Switzerland (2007–2009), ICYS-MANA Researcher (2009–2011), Independent Scientist (2011–2016), and currently Group Leader (2016–present) at WPI-MANA, NIMS, Japan. Since 2015, he is also Associate Professor of Joint Graduate School in University of Tsukuba. He received the 23rd Tsukuba Encouragement Prize and nano tech 2015 Research Project Award in 2013 and 2015, respectively.