

Abstract
The resolution of resist processes for extreme ultraviolet (EUV) lithography has been steadily improved and has reached the sub-20 nm half-pitch region. Currently, the resist materials capable of resolving 11 nm half-pitch line-and-space patterns are being developed in industrial fields. In this study, the line-and-space resist patterns with sub-20 nm half-pitches were fabricated using a high-numerical-aperture (NA) EUV exposure tool and analyzed by the Monte Carlo simulation. The scanning electron microscopy (SEM) images of resist patterns after their development were compared with the latent images calculated on the basis of the sensitization and reaction mechanisms of chemically amplified EUV resists. The approximate relationship between resist patterns and latent images was clarified for the sub-20 nm half-pitch region. For the realization of 11 nm half-pitch fabrication, the suppression of the stochastic effects in the development process is an important consideration.
Export citation and abstract BibTeX RIS
1. Introduction
Extreme ultraviolet (EUV) lithography is expected to emerge as the next-generation lithography. The development of EUV lithography has steadily progressed since Kinoshita et al. have proved its concept.1) The delay in the development of EUV sources was a significant concern for the realization of EUV lithography.2) However, the EUV source power has been increased to 80 W.3) A stable source operation has also been reported.4) The application of EUV lithography to the high-volume production of semiconductor devices is expected in the near future. Recently, high-numerical-aperture (NA) exposure tools have attracted much attention from the viewpoint of the extendability of EUV lithography.5–7) With the improvement in the resolution of exposure tools, the resolution of resist processes has become an important consideration.
In lithography processes, highly sensitive chemically amplified resists,8) have been used. The typical backbone polymers of chemically amplified resists are poly(4-hydroxystyrene) and acrylic acid polymers, which are soluble in alkaline aqueous solutions. These polymers can become insoluble by protecting their polar hydroxyl groups with nonpolar groups. The chemically amplified resists utilize acid catalytic chain reactions to solubilize a partially protected polymer through the deprotection of the polymer. Although high sensitivity can be achieved owing to the catalytic chain reaction, the accompanying acid diffusion degrades the resolution.9,10) The ultimate resolution of chemically amplified resists has been steadily improved and reached 20 nm half-pitch in 2008.11) The fabrication of 16 nm half-pitch line-and-space patterns was demonstrated in 2011.12) The resolution has been further improved and reached 15 and 13 nm half-pitches in 201413,14) and 2015,15) respectively, owing to the intensive efforts of resist manufacturers. Currently, the improvement of ∼15 nm half-pitch resist technology and the enhancement of resist resolution are the main issues in the development of resist materials. With the improvement of resolution, the feasibility of sub-10 nm half-pitch fabrication has recently attracted much attention.
In previous studies, we developed a technique of parameter extraction from a resist, the material contents of which are unknown.16–21) It has been demonstrated that resist parameters can be extracted from the dose-pitch matrices of the line width and line edge roughness (LER) with an accuracy of 10–20% even without knowledge of the material contents.16–21) Using this technique, we have determined the resist parameters of a high-performance chemically amplified resist, called the first EIDEC standard resist (ESR1).22) The line-and-space patterns with >20 nm half-pitches, which were fabricated using a small-field exposure tool (SFET; NA 0.3),23,24) were analyzed. In 2015, a high-NA EUV exposure tool was developed at EIDEC.25) Its NA is 0.51. It is called HSFET (High NA Small Field Exposure Tool). In this study, line-and-space patterns were fabricated using HSFET to investigate the resist response in sub-20 nm fabrication. The half-pitch was decreased to 11 nm. The fabricated patterns were compared with the latent images calculated using the resist parameters determined in our previous study.22) The resist pattern formation in the sub-20 nm region is discussed in this paper.
2. Experimental procedure
The line-and-space patterns of the EIDEC standard resist26) were fabricated using HSFET. The exposure method used was quadrupole illumination.25) The exposure dose was varied from 8 to 32 mJ cm−2. The half-pitch was varied from 11 to 32 nm. The resist thickness was adjusted to 50 or 30 nm. The exposed samples were subjected to postexposure baking (PEB) on a hot plate at a temperature of 120 °C for 60 s. The exposed samples were developed in 2.38 wt % tetramethylammonium hydroxide (TMAH) aqueous solution for 30 s and rinsed in water. The line width roughness (LWR) of the developed resist patterns was measured by scanning electron microscopy (SEM; Hitachi CG4000). LWR was defined as the 3σLW of line width fluctuation. Here, σLW is the standard deviation of the fluctuation of line width. LER was calculated from the measured LWR using the assumed relationship  .
.
3. Simulation model and method
The exposure dose distribution of incident EUV photons, that is, I(x: perpendicular to the line pattern, y: parallel to the line pattern), was approximated using a cosine function:

Here, A, C, F, and p1/2 represent the exposure dose, the contrast of an optical image, the flare intensity, and the half-pitch of the line-and-space pattern, respectively. The contrast of an optical image has been reported elsewhere.25) The simulation parameters of a PHS-based resist with a triphenylsulfonium triflate (TPS-Tf) acid generator were basically assumed. The molecular weight of the polymer and protection ratio were tentatively assumed to be 4000 and 30%, respectively. The flare intensity was set to be 3%. EUV photons were randomly injected into the target area in accordance with the photon intensity expressed by Eq. (1). The injected photons were randomly absorbed by the resist films in accordance with Lambert's law. The electron trajectories after EUV absorption and the reaction of electrons with acid generators were calculated in accordance with a reported procedure.27)
The preneutralization of acids before PEB28,29) was assumed because the EIDEC standard resist is an annealing-type resist. The PEB process was calculated using two different models, namely, a probability density model and a stochastic model. In the probability density model, the catalytic chain reaction during PEB was calculated by solving the reaction–diffusion equations for acids and quenchers.30) The temporal change in protected unit concentration was calculated using
Here, Cp and Rp represent the concentration of protected units and the effective reaction radius for deprotection, respectively. In the stochastic model, the catalytic chain reaction during PEB was calculated by the Monte Carlo simulation, using the acid distribution after the preneutralization as the initial condition. The proton migration range at room temperature was set to be 2.4 nm.31) An acid molecule was assumed to diffuse in the resist matrix with a paired form of a proton and a counteranion at an elevated temperature. The motion of the acid and quencher molecules at each time step dt is given by  , where D represents the diffusion constant of the acid or quencher molecule. The direction of motion was determined using uniform random variables. The periodic boundary condition was applied in the horizontal direction. The reflective boundary condition was applied in the vertical direction. During the PEB, when an acid molecule reached a quencher molecule within the effective reaction radius for neutralization, the acid molecule was regarded to be lost through neutralization. When the acid molecule reached a protected unit of the polymer within the effective reaction radius for deprotection, the acid molecule was regarded to induce the deprotection of the polymer. Other details of the reaction mechanisms have been reported elsewhere.32,33)
The resist parameters were determined in our previous study22) by analyzing the dependences of line width and LER on half-pitch and exposure dose. The same parameters except for the effective quencher concentration were applied to the analysis of experimental results in this study. The resist parameters used in the simulation are listed in Table I.22,34–38) The dissolution point was defined as the normalized protected unit concentration at the half-depth of the boundary between lines and spaces. β in Table I is a parameter introduced for approximating the decomposition effect of acid generators during exposure and the acid-base equilibrium effect during PEB using the dose correction, A' = [1 − exp(−A × β)]/β.19) The calculated areas were 2p1/2 × 1000 nm2 for the probability density model and 2p1/2 × 500 nm2 for the stochastic model.
Table I. Simulation parameters.
| p1/2 (nm) | 11–32 |
| Resist thickness (nm) | 30, 50 |
| Absorption coefficient (µm−1)34) | 3.8 |
| Resist film density (g cm−3)35) | 1.2 |
| Thermalization distance (nm)36) | 3.2 |
| Acid generator concentration (wt %) | 10 |
| Reaction radius of acid generator (nm)36) | 0.70 |
| Molecular weight of polymer | 4000 |
| Molecular weight of monomer unit | 120 |
| Acid diffusion constant (nm2 s−1)22) | 10.0 |
| Quencher diffusion constant (nm2 s−1)22) | 10.0 |
| Effective reaction radius for neutralization (nm) | 0.5 |
| Effective reaction radius for deprotection (nm)22) | 0.16 |
| Protection ratio (%) | 30 |
| Deprotonation efficiency of proton source37) | 1.0 |
| Deprotonation efficiency of nonproton source38) | 0.3 |
| β22) | 0.11 |
4. Results and discussion
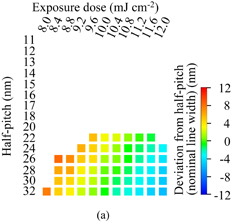
The line-and-space patterns were fabricated using ESR1 and HSFET. The resist thickness was adjusted to 50 nm. The half-pitch was changed from 32 to 11 nm. The exposure dose was changed from 8.0 to 12.0 mJ cm−2 in steps of 0.4 mJ cm−2. Figure 1 shows the dependence of line width and LER on half-pitch and exposure dose (the dose-pitch matrices of line width and LER). Line width was expressed as the deviation from the nominal line width defined by the photomask (half-pitch). The resolution was limited at 22 nm half-pitch. The sizing dose at 22 nm half-pitch was 11.1 mJ cm−2. As described in the previous section, the latent images were calculated using the predetermined resist parameters except for quencher concentration. The acid generator concentration was unknown for the resists, which we analyzed in previous studies. The quantum efficiency of acid generation depends on the acid generator concentration in chemically amplified EUV resists. Therefore, the acid yield cannot be determined by analyzing SEM images. However, the most influential factor among those associated with acid yield is the acid yield immediately after the preneutralization. In our analysis method,16–22) quencher concentration has been used as a fitting parameter for estimating the acid yield immediately after the preneutralization. This means that the effective quencher concentration is affected by flare intensity. Because the flare intensity of HSFET was different from that of SFET, the readjustment of effective quencher concentration was required. The readjusted effective quencher concentration was 0.0175 nm−3. As a reference, the (effective) quencher concentration was 0.023 nm−3 for ESR1 upon exposure to SFET.22) The fitting errors for line width and LER were 14.0 and 18.4%, respectively. In this fitting procedure, the probability density model was used for the calculation of the PEB processes.
Download figure:
Standard image High-resolution image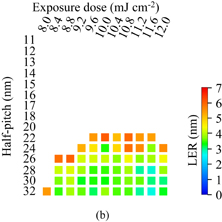
Fig. 1. Dependences of (a) line width and (b) LER on half-pitch and exposure dose. The resist was ESR1. Line width was expressed as the deviation from the nominal line width defined by the photomask (half-pitch).
Download figure:
Standard image High-resolution imageBy increasing the quencher concentration by 4.2-fold, a similar experiment was carried out. The resist thickness was reduced from 50 to 30 nm. The dependences of line width and LER on half-pitch and exposure dose are shown in Fig. 2. The resolution was improved to 15 nm half-pitch. The sizing doses at 15 and 22 nm half-pitches were 29.6 and 30.2 mJ cm−2, respectively. The sizing dose (sensitivity) was increased approximately threefold by increasing the quencher concentration. Note that it was confirmed that ESR1 with a normal quencher concentration cannot resolve sub-20 nm half-pitch even when the resist thickness was reduced to 30 nm. The dependences of line width and LER were analyzed, using the effective quencher concentration as a fitting parameter. The best-fit concentration was 0.0245 nm−3. The fitting errors for line width and LER were 14.0 and 26.5%, respectively.
Download figure:
Standard image High-resolution image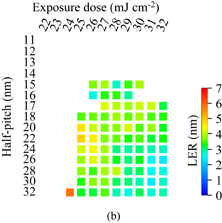
Fig. 2. Dependences of (a) line width and (b) LER on half-pitch and exposure dose. The resist used was ESR1 with 4.2-fold normal quencher concentration. Line width was expressed as the deviation from the nominal line width defined by the photomask (half-pitch).
Download figure:
Standard image High-resolution imageUsing the estimated effective quencher concentration and the resist parameters listed in Table I, the Monte Carlo simulation was carried out on the basis of the stochastic model. Figure 3 shows a latent image (profile of normalized protected unit concentration after PEB) of 22 nm half-pitch line-and-space patterns. The exposure dose was 10.4 mJ cm−2. The corresponding SEM image is also shown in Fig. 3. The average normalized concentration at the half-depth of the resist film is plotted (lines labeled "Ave."). The concentration was normalized by the initial concentration before PEB. The normalized concentrations were averaged in the line direction. The horizontal double-sided arrow labeled by "Exp. SW" represents the measured space width. DP denotes the dissolution point (threshold). The point of intersection in the latent image with the dissolution point indicates the boundary between lines and spaces. The calculated space width agreed well with the measured one. The lines labeled by "σn" are the normalized standard deviation of the number of protected units per polymer molecule after PEB. The standard deviation was normalized with the initial number of protected units per polymer molecule before PEB. The initial standard deviation before PEB was assumed to be 0. The normalized protected unit concentration fluctuated with σn in the line direction. This means that the boundary between lines and spaces fluctuated in the line direction. The horizontal double-sided arrows labeled by "Exp. LER" in Fig. 3 represent the measured LER. The ±0.35σn fluctuation corresponds to the measured LER. The lines labeled by "Ave.±0.35σn" in Fig. 3 represent the normalized protected unit concentration after adding 0.35σn to and subtracting 0.35σn from the average normalized protected unit concentration. This value well agreed with the reported value for ESR1 (±0.37σn).22) The vertical double-sided arrows at x = −p1/2 and 0 represent the difference between the average normalized protected unit concentration and the dissolution point. It has been reported for ESR1 that the difference should be more than 1.63σn at x = ±p1/2 for the elimination of pinching for 6.1 µm line length.39) The calculated difference at x = ±p1/2 was 1.20σn. As predicted by the simulation, the pinching was observed in the SEM image. Similarly, the difference (absolute value) should be more than 1.98σn for the elimination of bridges for 6.8 µm space length.39) The calculated difference at x = 0 was 0.84σn. As predicted by the simulation, the bridges were observed in the SEM image.
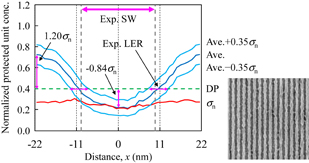
Fig. 3. Latent image (profile of normalized protected unit concentration after PEB) and SEM image of 22 nm half-pitch line-and-space patterns. The resist used was ESR1. The exposure dose was 10.4 mJ cm−2. The vertical double-sided arrows at x = −p1/2 and 0 represent the difference between the normalized protected unit concentration and the dissolution point. The corresponding numerical value at x = −p1/2 is the average value at ±p1/2. The vertical length of the SEM image was 675 nm.
Download figure:
Standard image High-resolution imageThe resist patterns fabricated using ESR1 with a high quencher concentration were investigated. Figure 4(a) shows the latent and SEM images of 16 nm half-pitch line-and-space patterns. The best exposure dose was 28.0 mJ cm−2. The differences (absolute values) between the average protected unit concentration and the dissolution point at x = ±p1/2 and 0 were 0.60 and 0.63σn, respectively. These values were smaller than the required values for the elimination of stochastic defect generation. A significant number of pinching and bridges were observed. The fluctuation estimated from the measured LER was ±0.22σn. The fluctuation of ±0.37σn that was estimated in our previous study39) is shown as a reference. This difference is likely to be an experimental error, considering the scattering of the estimated values (Fig. 4 in Ref. 22). When the half-pitch was reduced to 14 nm, the best exposure dose was 27.0 mJ cm−2. The differences (absolute values) between the average protected unit concentration and the dissolution point at x = ±p1/2 and 0 were decreased to 0.40 and 0.43σn, respectively, as shown in Fig. 4(b). Although quantitative analysis is difficult, the number of both pinching and bridges increased with the decrease in the difference between the average protected unit concentration and the dissolution point. The fluctuation of ±0.37σn is shown as a reference because LER could not be measured. The half-pitch was further decreased to 12 nm, as shown in Fig. 4(c). The best exposure dose was 26.0 mJ cm−2. The differences (absolute values) between the average protected unit concentration and the dissolution point at x = ±p1/2 and 0 were decreased to 0.38 and 0.12σn, respectively. The resist image was significantly degraded.
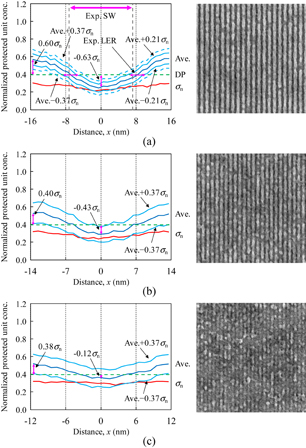
Fig. 4. Latent images and SEM images of (a) 16, (b) 14, and (c) 12 nm half-pitch line-and-space patterns. The exposure doses were (a) 28.0, (b) 27.0, and (c) 26.0 mJ cm−2. The resist used was ESR1 with high quencher concentration. The vertical length of SEM images was 675 nm.
Download figure:
Standard image High-resolution imageFigure 5 shows the latent images and SEM images of 11 nm half-pitch line-and-space patterns. The exposure dose was changed from 22.0 to 25.0 mJ cm−2. At the exposure dose of 22.0 mJ cm−2, the difference between the average normalized protected unit concentration and the dissolution point at x = 0 was 0.45σn. It has been reported for ESR1 that the space starts to open at 0.43σn difference.39) In this study, when the difference was decreased to 0.31σn, the space started to open, as shown in Fig. 5(b). This agreed with the previous result39) of our analysis of >20 nm half-pitch patterns. Many holes were observed after the development and subsequent rinsing. The diameters of some holes were apparently larger than the half-pitch (11 nm). A large area was considered to be dissolved owing to the fluctuation of the number of protected units per polymer. By increasing the exposure dose to 24.0 mJ cm−2, the differences (absolute values) between the average normalized protected unit concentration and the dissolution point at x = ±p1/2 and 0 were decreased to 0.62 and 0.27σn, respectively. While the number of small holes increased along the presumed lines, large openings such as craters were observed. At the bottom of craters, blurred line-and-space patterns were observed. By increasing the exposure dose to 25.0 mJ cm−2, the differences (absolute values) between the average normalized protected unit concentration and the dissolution point at x = ±p1/2 and 0 were decreased to 0.40 and 0.09σn, respectively. From the comparison between Figs. 5(c) and 5(d), the resist surface was considered to be dissolved in the developer at the exposure dose of 25.0 mJ cm−2. The blurred line-and-space patterns remained on the Si wafer. For the realization of 11 nm half-pitch fabrication, the suppression of not only inhomogeneous protected unit distribution but also stochastic dissolution behavior is required.
Fig. 5. Latent images and SEM images of 11 nm half-pitch line-and-space patterns. The exposure doses were (a) 22.0, (b) 23.0, (c) 24.0, (d) 25.0 mJ cm−2. The resist used was ESR1 with high quencher concentration. The vertical length of SEM images was 675 nm.
Download figure:
Standard image High-resolution image
5. Conclusions
The line-and-space resist patterns with sub-20 nm half-pitches were fabricated using HSFET. The SEM images of line-and-space resist patterns were compared with the latent images, calculated by the Monte Carlo method on the basis of the sensitization and reaction mechanisms of chemically amplified EUV resists. The characteristics of fabricated patterns such as space (line) width and defects were well explained by the latent images calculated using the predetermined resist parameters. The approximate relationship between resist patterns and latent images was clarified for the sub-20 nm half-pitch region. For the realization of 11 nm half-pitch fabrication, the suppression of the stochastic effects in the development process is an important issue.
Acknowledgement
This work was partially supported by the New Energy and Industrial Technology Development Organization (NEDO).