
Abstract
We report a tunable mid-infrared frequency comb working at 184 MHz, which is based on difference frequency generation in a periodically poled Mg-doped stoichiometric lithium tantalate (PPMgSLT) crystal pumped by high-power supercontinuum pulses. Supercontinuum pulses from two fibers with different dispersion properties were examined. With a photonic crystal fiber (PCF) having normal dispersion properties, a tunable wavelength range of 2.9–4.7 µm was achieved. With another PCF having zero dispersion at 1040 nm, a maximum power of 1.34 mW was observed at 3.9 µm. The high coherence of the pulses generated with this scheme was verified experimentally, and a fringe visibility of 0.90 was observed.
Export citation and abstract BibTeX RIS

Content from this work may be used under the terms of the Creative Commons Attribution 4.0 license. Any further distribution of this work must maintain attribution to the author(s) and the title of the work, journal citation and DOI.
In the mid-infrared (MIR) region, because of the fundamental vibrational-rotational transition, many molecules have strong absorption characteristics, so-called fingerprint absorption spectra,1) which allow molecular species to be identified and quantified by MIR spectroscopy. This has great importance in the fields of air-quality monitoring,2) pharmacy,3) biology,4) and breath analysis.5) Recently, the extension of the operating range of optical frequency combs from the visible and near-infrared into the MIR region has enabled great strides in the application of precision molecular spectroscopy.6,7) Usually, MIR combs can be generated from a nonlinear crystal with the help of frequency down conversion.8) As a common choice, difference frequency generation (DFG) in a nonlinear crystal is preferred for transferring the pulse energy from the near-infrared into the MIR domain. Additionally, recent developments in compact, stable, and efficient fiber lasers and amplifiers have opened up new avenues for pumping DFG to generate MIR combs with wide wavelength tunability.9)
For DFG, the frequency of the generated signal, ωsignal, is related to the pump frequency ωpump and the idler frequency ωidler by the expression ωsignal = ωpump − ωidler. Thus, by controlling the frequency/wavelength of the pump or signal, the frequency/wavelength of the MIR comb can be tuned. With different kinds of nonlinear crystals, the optical-parametric-oscillator (OPO)-based DFG, which is realized by the single-pass pumping or intracavity oscillation, can cover almost the entire MIR region from 2 to 20 µm with high output power.10–13) However, OPOs suffer from the requirement of high pumping synchronization, especially in the case of femtosecond pumping. Adopting a scheme that uses Raman solitons from a highly nonlinear fiber can relax the synchronization requirement, realizing wavelength tunability in the MIR region.14–16) Previous studies on DFG revealed that the coherence between the pump and signal fields is the most critical factor in achieving phase coherence in MIR.14) Although the generated Raman solitons can be made highly coherent by optimizing the fiber and laser parameters,17) as another choice, a more reliable method to generate an MIR comb with high stability and coherence is the scheme in which the DFG crystal is pumped with supercontinuum (SC) sources.18) Recently, DFG in the near-infrared region pumped by SC pulses has been reported, and based on this scheme, stable optical clocks have been realized.19) In another experiment, an ultra-broadband frequency comb seeded by a 1.0–2.4-µm-wide frequency comb was reported, and the coherence was confirmed in both the visible and MIR regions.20)
Since an SC pulse can have a broad bandwidth, it is possible to fabricate a tunable DFG source in the MIR region using two portions of a SC pulse as the pump and signal, respectively, which has the advantage of being offset-free. In this Letter, we propose a scheme for generating tunable MIR frequency combs seeded by SC pulses centered at 1 µm. Theoretical analysis and experimental results are presented. In experiments, we realized an MIR comb working at 184 MHz with a maximum tunable range from 2.9 to 4.7 µm, and this MIR comb could be continuously tuned by controlling an optical delay line. The generated MIR pulses were experimentally confirmed to have high temporal coherence.
In our proposed scheme, two portions of the high-power SC pulse are used, one as the pump, and the other as the signal for DFG. The SC pulses generated from fibers with different group velocity dispersion (GVD) properties result in different bandwidths and different instantaneous frequency–time relations. The principle is illustrated in Fig. 1, in which SC pulses are generated in two kinds of fibers. First, the SC pulses pumped in the normal GVD regime are discussed. The instantaneous frequency of these pulses is a monotonic function of time, as shown in Fig. 1(a). For simplicity, a linear function is chosen. With a beam splitter, such as a dichroic mirror, the SC pulses are split into two branches. One branch (Branch 2) passes through an optical delay line and overlaps the other branch (Branch 1) again. The generated DFG wavelengths are dependent on the frequency difference Δω of the superposed parts (illustrated by red boxes in the figures). By tuning the optical delay line, the relative time delay for Branch 2 is varied from ΔT1 to ΔT3 (ΔT1 < ΔT2 < ΔT3). From the bottom row in Fig. 1(a), it can be seen that Δω also increases monotonically. One delay time, ΔT, corresponds to one frequency difference, Δω. On the other hand, for the SC pulses generated in a fiber at a wavelength near the zero-dispersion wavelength (ZDW), the instantaneous frequency is not a monotonic function of time,21) as shown in Fig. 1(b). With an increment of delay time ΔT, Δω does not increase monotonically, and one delay time ΔT does not correspond to one frequency difference Δω. This will lead to DFG in a wide wavelength range and the distortion of the spectral shape. However, with the help of high-peak-power Raman solitons generated on the anomalous dispersion side, higher DFG power can be expected.
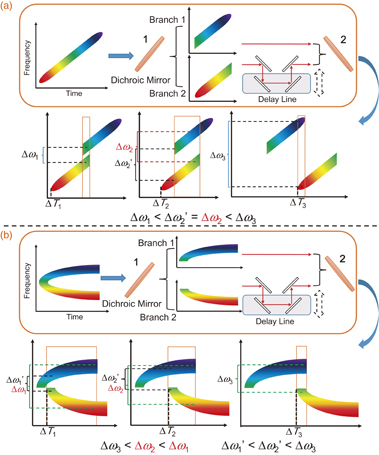
Fig. 1. Schematic illustrations of tunable DFG pumped by SC pulses from fibers pumped (a) in the normal GVD regime and (b) near ZDW.
Download figure:
Standard image High-resolution imageOur proposed scheme was implemented with the experimental setup shown in Fig. 2. The MIR comb was based on an Yb-doped fiber system. An Yb-doped fiber laser mode-locked using the nonlinear polarization rotation scheme worked as a seed pulse source. The highly chirped pulses from the laser had a temporal full width at half maximum (FWHM) of 2.3 ps, centered around 1040 nm, with an average power of 300 mW. The repetition rate was 184 MHz, and the signal-to-noise ratio was 80 dB, recorded by a radio-frequency spectrum analyzer [results are shown in Figs. 3(a) and 3(b)]. Subsequently, the output pulses were amplified in a 2-m-long Yb-doped double-clad fiber (Yb-DCF) with a 10 µm core diameter, and pumped by a high-power laser diode (at 975 nm) that could provide a maximum power of 8 W. Highly chirped, high-power pulses with an average output power of 3 W were generated, and the temporal FWHM was 7.9 ps. By using a pair of transmission gratings (1000 lines/mm), the chirp of the amplified pulses was compressed, and the temporal FWHM was reduced to 200 fs. The spectrum and autocorrelation trace of the compressed pulses are shown in Figs. 3(c) and 3(d), respectively. With the compressed high-power pulses, an SC from 900 to 1200 nm was generated in a photonic crystal fiber (PCF), which could support a wavelength tunability of around 4 µm. By using a short-pass dichroic mirror, the SC pulse was split into two branches, at wavelengths shorter and longer than 1000 nm. By carefully adjusting an optical delay line after the dichroic mirror, the two pulses were made to overlap in space and time and were then focused into a fan-out periodically poled Mg-doped stoichiometric lithium tantalate (PPMgSLT) crystal that was designed for DFG at 4.5 µm. The poling periods are from 24.2 to 26.7 µm, and the wavelength tuning range is estimated to be 2.5 to 5.0 µm from the phase matching condition.22) Finally, a Michelson interferometer with an optical path difference of about 1.63 m, corresponding to a one-pulse delay, was built to test the coherence of the MIR pulses. At the output of the interferometer, a ZrF4 single-mode fiber was used to achieve fine spatial overlapping and guide the generated MIR light into the detection system.
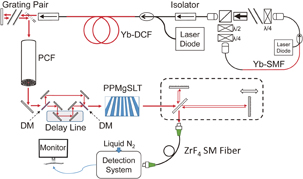
Fig. 2. Experimental setup for MIR comb generation using Yb-doped fiber laser system. λ/2: half-wave plate; λ/4: quarter-wave plate; Yb-SMF: Yb-doped single-mode fiber; Yb-DCF: Yb-doped double-clad fiber; PCF: photonic crystal fiber; DM: dichroic mirror. The shaded box in the delay line is the movable part for controlling the delay time. The dashed box is the Michelson interferometer.
Download figure:
Standard image High-resolution image
Fig. 3. (a) RF spectrum of the seed pulses from Yb-doped fiber laser, 0–1000 MHz with a resolution of 30 kHz. (b) RF spectrum at the fundamental repetition rate with a resolution of 1 kHz. (c) Optical spectrum of the compressed pulses from the Yb-DCF amplifier. (d) Autocorrelation trace of the compressed pulses from the Yb-DCF amplifier.
Download figure:
Standard image High-resolution imageIn our experiments, first, a 16-cm-long PCF (PCF1) with normal GVD at 1040 nm (NKT Photonics NL-1050-NEG-1) was utilized to generate SC pulses. Figure 4(a) shows the spectrum of the SC pulses from the PCF with an average power of 1.3 W. A simulated spectrogram of the SC pulse is shown in Fig. 4(b), where the instantaneous frequency (centered at 1040 nm) is a monotonic function of time. The spectra of generated MIR pulses from the PPMgSLT crystal measured by a monochromator are illustrated in Fig. 4(c) with different colors, which correspond to different relative delay times controlled by tuning the optical path difference in one arm of the optical delay line. With the continuous tuning of the relative delay time, the peak wavelength was shifted from 2.9 to 4.7 µm. The resolution of the monochromator was 5 nm. Figure 4(c) shows that the shapes of some spectra are not Gaussian-like, which originated from the irregularity of the overlapped SC parts. Because of the strong absorption of CO2 in the air, there is a hole at a wavelength of 4.3 µm [the spectrum indicated by the black line in Fig. 4(c)]. This problem can be solved by measuring the spectra in a N2 gas protected circumstance. Figure 4(d) illustrates the relationship between the relative delay time and the wavelength of the spectral peak. The zero point of the relative delay time corresponded to the position of the delayed arm at which the longest wavelength was generated. In Figs. 4(c) and 4(d), the same color corresponds to the same relative delay time of the delay line. From the analysis in Fig. 1(a), it can be found that the wavelength of the spectral peak increased monotonically, almost linearly, as a function of relative delay time. Since the bandwidth covered by the SC could support DFG at even longer wavelengths, the generated MIR wavelength range in this scheme was limited by the PPMgSLT, which was designed for a narrow band (around 4.5 µm) with high efficiency. The average output powers of the MIR pulses measured by a thermal power meter were on the order of hundreds of microwatts. A maximum total output power of 0.64 mW was observed at the wavelength of 3.5 µm.
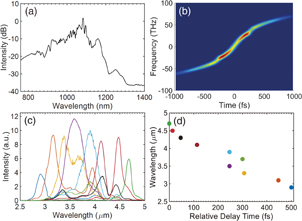
Fig. 4. (a) SC spectrum generated from PCF1. (b) Simulated spectrogram of the SC pulse generated from PCF1. (c) MIR spectra generated from the PPMgSLT as a function of relative delay time. (d) Relationship between the relative delay time and the wavelength of the spectral peak of the MIR comb. In (c) and (d), the same color corresponds to the same relative delay time.
Download figure:
Standard image High-resolution imageNext, another 18-cm-long PCF (PCF2) with a ZDW of 1040 nm (NKT Photonics SC-5.0-1040) was examined. The SC spectrum is shown in Fig. 5(a), with the same output average power of 1.3 W. Figure 5(b) shows the simulated spectrogram. The instantaneous frequency (centered at 1040 nm) was not a monotonic function but parabolic. The spectra of MIR pulses generated with different relative delay times are illustrated in Fig. 5(c). The peak wavelength shifted from 3.9 to 4.5 µm as the relative delay time was changed. The relationship between the relative delay time and the wavelength of the spectral peak is plotted in Fig. 5(d). In Figs. 5(c) and 5(d), the same color corresponds to the same relative delay time of the delay line. The spectral holes around 4.3 µm in Fig. 5(b) are also due to absorption by CO2. Using this PCF, the average power of the generated MIR pulses exceeded 1 mW, which was larger than that in the scheme using PCF1 as discussed in Fig. 1. In the spectrum with a peak wavelength of 3.9 µm, a maximum total power of 1.34 mW was observed. Compared with the scheme using PCF1, MIR generation by using PCF2 had a narrow tunable range. Another problem is that the spectra are not as clean as the Gaussian-like ones in Fig. 4(c) and the shapes are distorted, which agree with the above discussion in relation to Fig. 1.
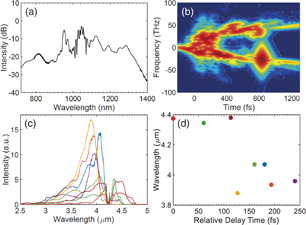
Fig. 5. (a) SC spectrum generated from PCF2. (b) Simulated spectrogram of the SC pulse generated from PCF2. (c) MIR spectra generated from the PPMgSLT as a function of relative delay time. (d) Relationship between the relative delay time and the wavelength of the spectral peak of the MIR comb. In (c) and (d), the same color corresponds to the same relative delay time.
Download figure:
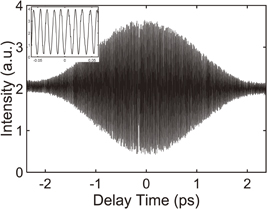
Standard image High-resolution imageFinally, we examined the temporal coherence23) of the generated MIR pulses using the Michelson interferometer shown in the dashed box in Fig. 2. While moving a mirror in one arm of the Michelson interferometer, the one-pulse-delay time coherence properties of the generated MIR pulses were recorded by the detection system. Figure 6 shows the interference fringes of the adjacent pulses, which correspond to the generated MIR at a wavelength of 4.0 µm based on the high-power SC pulses generated from PCF2. Wavelength stability was confirmed by a long-term operation of more than 16 h. The resolution of the inset was improved from 33.3 to 6.7 fs. A fringe visibility of 0.90 was observed. This fringe visibility, which is the highest reported in the MIR region to the best of our knowledge, is direct evidence of the coherence. More information on the signal-to-noise ratio can be measured with a beat-note detection experiment with the help of a quantum cascade laser working in the MIR region.7,24)
Fig. 6. MIR interference fringes at the output of the Michelson interferometer. In the inset, the resolution was improved from 33.3 to 6.7 fs. A fringe visibility of 0.90 was observed.
Download figure:
Standard image High-resolution image
In conclusion, we have proposed a novel scheme for generating a tunable mid-infrared (MIR) comb pumped by high-power supercontinuum (SC) pulses, and discussed the principle of SC pulses working as difference frequency generation (DFG) seeds from fibers with different group velocity dispersion (GVD) properties. With this scheme, an MIR optical frequency comb working at 184 MHz was experimentally realized on the basis of an Yb-doped fiber laser and amplifier system. It was found that the SC pulses from the fiber with normal GVD could continuously and monotonically generate a wavelength-tunable MIR comb. An almost linear tuning range from 2.9 to 4.7 µm at an average power up to 0.63 mW was realized by controlling an optical delay line. By using another PCF with ZDW at 1040 nm in the same experimental setup, a tuning range from 3.9 to 4.4 µm with an average power above 1 mW was realized. A maximum total power of 1.34 mW was observed at 3.9 µm. Since the signal and pump for DFG were generated in the same SC pulse, the generated offset-free MIR pulse had high wavelength stability and high coherence. A fringe visibility of 0.90 was recorded, which is the first measurement in the time domain. This scheme is suited for high-coherence spectroscopy in the molecular fingerprint region.
Acknowledgments
This research is partially supported by the SENTAN program "Development of Systems and Technology for Advanced Measurement and Analysis" of the Japan Science and Technology Agency (JST), and the Japan Agency for Medical Research and Development (AMED).