
Abstract
X-ray fluorescence holography (XFH) can be used to conduct atom-resolved structural characterization of materials around a specific element, and has been applied to various functional materials. Recently, a valence-selective function has been found by this technique by employing incident X-ray energies near an absorption edge of a specified element. In this article, the principle and experimental procedure of a valence-selective XFH and subsequent data analysis procedure using the sparse modeling approach of L1 regression are introduced. Then, the excellent XFH results with valence-selective studies are reviewed, such as Y oxide thin film, YbInCu4 valence transition material, and Fe3O4 mixed valence material.
Export citation and abstract BibTeX RIS
1. Introduction
Recently, the feasibility of X-ray fluorescence holography (XFH)1–3) has become well understood and this technique has been applied to various crystals with novel functions. XFH utilizes a modulation of fluorescent X-rays (hologram) emitting from a constituent element by some 0.1% with varying angles, which is caused by X-ray interference with scattering from neighboring atoms.
The excellent advantages as already given elsewhere3,4) are listed as follows:
- An atomic image is reconstructed around a specific central element emitting fluorescent X-rays to up to more than 15 neighboring atoms.
- A three-dimensional (3D) atomic image is usually reconstructed by a Fourier transformation of holograms using no special models.
- An atomic image around impurities is possible although they have no long-range periodicity of atomic positions.
- Positional fluctuations can be determined for each neighboring atom by comparing with theoretical images.
- No special techniques are necessary for low-dimensional samples such as thin films.
For these advantages, the best example of XFH is to find impurity sites in functional materials. For example, impurity sites were identified in a Mn-doped Bi2Te3 topological insulator.5) Another idea is to estimate local lattice distortions by impurities or alloys; for example, lattice distortions around Ga impurities in typical InSb semiconducting crystal,6) intrinsic lattice distortions around Ge and Mn in Ge0.6Mn0.4Te semi-magnetic semiconductors,7) and reconciling of the Pauling picture and Vegard's law in Zn1−xMnxTe semi-magnetic mixed crystal.8)
For further structural investigations, we have recently found an excellent function of XFH; i.e. valence-selective structural studies. This is accomplished by choosing an incident X-ray energy at a special energy reflecting a valence or spin state in X-ray absorption near-edge structure (XANES), where X-rays excite only atoms having a specific electronic state and emitting fluorescent X-rays.
On the other hand, valence-selective structural information cannot be easily obtained using the usual (traditional) diffraction and X-ray absorption fine structure (XAFS) experiments. X-ray diffraction (XRD) has only a small difference in atomic form factors owing to the difference in the electron numbers by one or two, and neutron diffraction has no difference. XAFS shows an overlap of oscillations with different valencies with a certain energy shift. Therefore, a reliable valence-selective method is urgently required.
In this article, we firstly introduce the principle of the valence-sensitive XFH technique for local atomic structure characterizations in Sect. 2. Secondly we present the procedures of experiments and data analysis in Sects. 3 and 4, respectively. Thirdly, we introduce several recent applications in Sect. 5, and finally we provide the summary and perspective of these investigations in Sect. 6.
2. Principle of valence-sensitive XFH
XFH is a newly developed method for atom-resolved structural characterizations of materials, which enables us to draw 3D atomic images around a specific element emitting fluorescent X-rays.1–3) Figure 1 shows the principle of the XFH technique in inverse mode.9) In (a), a schematic diagram of XFH is exhibited. When the incident X-rays shown as plane waves in the figure have an energy higher than an absorption edge of a constituent element in a crystal, the target atom emits fluorescent X-rays. In parallel, spherical X-ray waves scattered by surrounding atoms also reach the target atom. The direct incident X-ray plane waves (reference waves) and the scattered spherical waves (object waves) interfere with each other, and the intensity of the fluorescent X-rays is proportional to the interfered X-ray intensity generated by the target atom.
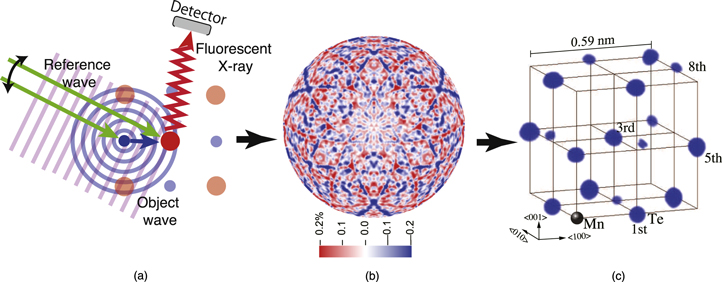
Fig. 1. (Color online) The principle of the XFH technique. a) A schematic diagram of the XFH experiments in inverse mode, b) hologram, and c) an example of the reconstructed 3D atomic image. Taken from Ref. 4.
Download figure:
Standard image High-resolution imageThe fluorescent X-ray intensity causes a modulation of some 0.1% by changing the incident X-ray angles with respect to the crystal lattice directions, as shown in (b), which is referred to as a hologram. In the hologram, the radial and angular directions indicate incident and azimuthal angles, respectively. Then, a 3D atomic image of neighboring atoms can, in principle, be obtained via a simple Fourier transform-like approach with no special atomic models as in (c), which is an experimental result from Ge0.6Mn0.4Te crystal around the Mn atom with a face-centered cubic (fcc) structure. Therefore, it is clear that XFH can observe local structures in short and intermediate ranges.
Our idea that XFH has an excellent potential to be used for valence-selective structural characterizations was taken from this principle of the XFH method. By employing the incident X-ray energy at a position characteristic of an electronic state, such as a valency or a spin state in a XANES spectrum, we can excite only the atoms with this character.
To explain this logic more clearly, an example of the XANES spectra of YbInCu4 valence transition material is shown in Fig. 2 measured at 7 K (full squares) and 300 K (empty squares).10) This material exhibits a valence transition in the fraction of Yb2+ and Yb3+ ions at a transition temperature Tv of about 42 K.11) As clearly seen in the figure, a pre-shoulder is observed at 8.939 keV below Tv of 7 K, while there is no significant structure there beyond Tv of 300 K. Thus, the pre-shoulder is an clear indication of the existence of Yb2+ ions. If the incident X-ray energy is set at 8.939 keV,  electrons in the Yb2+ ions excite to the vacuum level, and then, only the Yb2+ ions emit Yb Lα fluorescent X-rays, which produce a hologram. On the other hand,
  electrons in Yb3+ ions are not excited and do not contribute to the hologram. From the obtained hologram, therefore, atomic images are only composed of neighboring atoms around the Yb2+ ions. When the incident energy is selected at the peak position of the XANES spectra, on the contrary,
  electrons around both the ions are excited and contribute to the hologram.
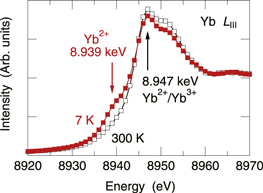
Fig. 2. (Color online) Yb LIII XANES spectra of YbInCu4 valence transition material at 7 K (full squares) and 300 K (empty squares). Taken from Ref. 10.
Download figure:
Standard image High-resolution image3. Experimental procedure
Samples were prepared to have a flat surface with an area larger than 1 × 1 mm2 necessary at present to perform the XFH experiment. The crystallinity of samples was examined by taking a Laue photograph for bulk samples or by measuring low-energy electron diffraction for thin films. The concentration and homogeneity of samples were confirmed by electron-probe micro-analysis (EPMA). The samples were cooled down to 100 K with a cryostream apparatus or down to 7 K with a cryostat.
XFH measurements were carried out at the beamline BL6C of the Photon Factory in the High Energy Accelerator Research Organization (PF-KEK), Tsukuba, Japan, at BL13XU, BL37XU, and BL39XU of the Super Photon Ring 8 GeV (SPring-8), Sayo, Japan, and more recently, at BM02 of the European Synchrotron Radiation Facility (ESRF), Grenoble, France, and at P24 of the PETRA III ring in the Deutsches Elektronen-Synchrotron (DESY), Hamburg, Germany.
Figure 3 shows a schematic diagram of the XFH apparatus. Samples were placed on a two-axis table of a diffractometer. The measurement was usually carried out in inverse mode as explained above by changing the two axes, typically the incident angle of  in steps of 1.00◦ and the azimuthal angle 0° ≤ ϕ ≤ 360° in steps of about 0.35◦. Incident X-rays were focused onto the surface of the samples. The fluorescent X-rays were collected with an avalanche photodiode, an energy-resolved silicon drift detector, or more recently a two-dimensional detector, via a cylindrical or toroidal graphite energy analyzer. The energy resolution of the energy analyzer was 200–300 eV depending on the fluorescent X-ray energy of 3.69 (Ca Kα)12)–11.22 (Se Kα) keV. Thus, this energy analyzer could clearly discriminate the fluorescent X-ray energies of neighboring elements.
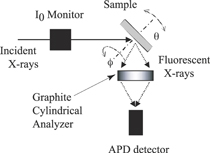
Fig. 3. (Color online) Schematic diagram of the XFH apparatus. Taken from Ref. 10.
Download figure:
Standard image High-resolution imageNote that for XFH measurements, an exact angle of the fluorescent X-rays with respect to the sample is not necessary, unlike in diffraction experiments; only the modulations of their intensities with the crystal angle with respect to the incident X-rays are important. Thus, we used a cylindrical analyzer crystal with a large solid angle for the fluorescent X-rays. Details of the experimental setup are given elsewhere.3)
4. Data analysis
4.1. General analysis
Holographic oscillation data were obtained by correcting a geometric background of the sample from fluorescent X-ray intensities and normalizing them to incident X-ray intensities usually measured using an ion chamber. Extensions of the holographic data to the 4π sphere were usually carried out using crystal symmetry of the sample and measured X-ray standing wave lines.13)
A hologram is an intensity modulation of fluorescent X-rays with varying incident angles, and is expressed as

where  and
and  indicate a hologram pattern and an electron density function, respectively, and the origin of
  is set at the fluorescence emitter atom. In Eq. (1), a polarization effect is not included to avoid a complex formula depending on crystal angles.
Barton's method14) is based on Fourier transforms, and is typically used for the data analysis. It is given by

where  is a reconstructed atomic image. It should be noted that for reconstructing a perfect 3D image, a 3D hologram in the whole
  space is, in principle, necessary by changing k or the incident X-ray energy E (
 with Planck constant h and speed of light c) from 0 to
  , which is experimentally impossible. Thus, Barton's method employs a sum of a limited number of holograms with different k values, i.e., multi-wavelength XFH, in place of the integral by k in Eq. (2).
For valence-sensitive XFH measurements, however, the incident X-ray energy is the only one around an absorption edge, and thus, the required atomic images are reconstructed from much less experimental information. In fact, a number of artifacts including intrinsic twin images always appear in reconstructed images by Fourier transforms as shown in Refs. 3 and 4. Thus, this is a typical example of an equation for an underdetermined system, i.e. too little experimental data is input for the requested unknown parameters.
4.2. SPEA-L1 analysis
To solve this problem of an equation for an underdetermined system, a sophisticated algorithm is urgently required for obtaining reliable 3D atomic images. Matsushita recently developed a new algorithm, named SPEA-L1 (scattering pattern matrix extraction algorithm using L1 regularized linear regression),15) which is based on inverse problem and sparse modeling.16)
When an atomic form factor, f, is introduced, Eq. (1) is expressed as

where  is the position of the ith atom and
  is an angle between
  and
and  . This equation is extended by introducing an atomic distribution function,
  , as follows:

Here, the element of neighboring atoms cannot be identified in advance. A standard f function is thus assumed, which is atomic number Z normalized f function averaged over constituent elements, since spectral forms of f/Z are quite similar to one another. By using small voxels for describing  ,17) Eq. (4) is modified as

Since the  function is very sparse, i.e. atomic numbers are very limited in space, an L1 regularized linear regression16) is applicable. For this, an evaluation function is given by

where  is an experimental hologram and λ is a penalty parameter to decrease
  . To obtain
  , a minimization of E is carried out by an iterative calculation of

where n is an index for iteration. The parameter α is optimized using a gradient method. Note that a non-negative constraint is applied to the voxel value  .
.
The estimation of λ is very important. When λ is increased, the amount of zeros in the voxels is increased, and the system becomes more sparse. When λ = 0, on the other hand, Eq. (9) goes to the usual least squares method with many artifacts in the atomic images. In these studies, λ was determined by using

with

and β is usually set between 0.60 and 0.95, where the fit error comes to the experimental error, and λ typically reaches 2 × 10⁻⁵ at the final conditions of fits.
The voxel size is usually set to be 0.01 × 0.01 × 0.01 nm3 with a distance range of 0.6 nm for each direction from the central emitter atom. The iteration of the L1 regularization is started from  . Examples of excellent improvements in atomic images by using L1 regularized linear regression are given elsewhere.4,18)
5. Applications
We have carried out valence-selective XFH experiments on materials with two valencies of 2+ and 3+, such as in Y,19) Yb,10) and Fe20)-containing crystals, where local structures and positional fluctuations are highly dependent on the valencies. In this section, three recent results are introduced in detail.
5.1. Y oxide thin film19)
Pure yttrium (III) oxide, Y2O3, with a valence state of  , is a well-known transparent and insulating rare-earth oxide. The crystal structure of Y2O3 is a distorted CaF2 structure, having a
  crystal symmetry with lattice constant a = 0.918 68 nm in standardized form,21) where one of the Y sites is displaced by 0.0347 nm from the ideal positions into a different direction.
On the other hand, yttrium monoxide, YO, with a valence state of  , has recently been manufactured by pulsed laser deposition as an epitaxial thin film,22) which is dark-brown colored and a narrow gap semiconductor. In thin films, YO forms a tetragonal structure, a very slightly distorted rock salt structure, with lattice constants of a = 0.493 6 and c = 0.497 7 nm.22) The surface of YO films is easily oxidized to Y2O3.
Our first attempt at valence-selective XFH measurement was focused on separating the structural information of Y2O3 and YO in the same thin film. Although Y atoms with different vacancies are macroscopically located at different positions from each other, this sample is suitable to examine the potential of XFH as a method of valence-selective characterization of atomic structures. The obtained result can be compared with results using other techniques, such as surface XRD, reflection high-energy electron diffraction, or transmission electron microscopy (TEM).
The YO sample was deposited on a CaF2 substrate to grow as an epitaxial layer with a thickness of about 180 nm. The top 30 nm was oxidized to become Y2O3, and the sample film was capped with a 10 nm AlOx layer. Two different structures of YO and Y2O3 were observed by TEM, and the interface layer between YO and Y2O3 was as small as 2 nm.
To select appropriate energies for valence-selective XFH measurements, Y K XANES spectra were measured on the mixed Y2O3/YO sample and pure Y2O3 reference film at room temperature in fluorescence mode at BL13XU of the SPring-8, Sayo, Japan, and the results are shown in Fig. 4

Fig. 4. (Color online) Y K XANES spectra measured on the mixed Y2O3/YO sample and pure Y2O3 reference film at room temperature. Inset: the ratio of two curves on Y2O3/YO and Y2O3. Taken from Ref. 19.
Download figure:
Standard image High-resolution imageAs seen in the figure, a slight shift is observed toward higher energies in the absorption edge when increasing the valence value from  /Y2+ to
  . The inset shows the ratio of two curves on mixed Y2O3/YO and Y2O3. The ratio shows a peak at 17.041 keV with a height of about 1.30. Thus,
  contributions are enhanced when the incident X-rays are chosen at this energy.
XFH measurements were carried out at BL13XU of the SPring-8 at incident X-ray energies of 17.041 and 17.054 keV as shown by the arrows in Fig. 4. The former was chosen to excite a sufficiently large portion of  , and the latter was selected to excite both
  and
and  .
.
The obtained holograms of the mixed Y2O3/YO sample are shown in Fig. 5 measured at (a) 17.041 and (b) 17.054 keV as orthographic projections. They are centered at θ = 0°, and the radial and angular directions indicate θ and ϕ, respectively. At a glance, they look very different from each other, although the difference in the incident X-ray energy is only 13 eV.

Fig. 5. (Color online) The holograms of the mixed Y2O3/YO sample measured at (a) 17.041 and (b) 17.054 keV as orthographic projections. Taken from Ref. 19.
Download figure:
Standard image High-resolution imageThese holograms can be decomposed into contributions of pure Y2O3 and YO. The ratio is calculated from the X-ray intensities absorbed by two layers, which depend on θ and the layer thicknesses, and which are assumed to be proportional to the fluorescent X-ray intensities. Owing to the high absorption at 17.054 keV, most of the incident X-rays are absorbed at this energy in the top Y2O3 layer. At 17.041 keV, however, a significant part of the incident X-rays are transmitted through the top layer due to the lower absorption. The ratio of Y2O3/YO is about 1:3 at 17.041 keV and about 3:1 at 17.054 keV at θ = 0, and the contributions of the top Y2O3 layer increase with increasing θ.
Using the estimated fractions for the holograms at two different incident X-ray energies, the pure holograms of Y2O3 and YO were evaluated as shown in Figs. 5(a) and 5(b) of Ref. 19, and the atomic images were obtained using the SPEA-L1 algorithm as shown in Fig. 6 for Y2O3 on the (a) (001) and (b) (004) planes and for YO on the (c) (001) and (d) (002) planes.

Fig. 6. (Color online) Atomic images for Y2O3 on the (a) (001) and (b) (004) planes and for YO on the (c) (001) and (d) (002) planes. Taken from Ref. 19.
Download figure:
Standard image High-resolution imageIn Figs. 6(a) and 6(b) for Y2O3, the dashed lines indicate an ideal CaF2 lattice and the atomic positions of Y2O3 are largely shifted to ovals expected for  atoms by XRD on bulk Y2O3,21) where two different
  sites in the unit cell are superimposed. Since the incident X-ray energy is only one, many artifacts are found outside of the expected ovals. Nevertheless, the crystal structure of Y2O3 can be recognized. The prominent images for near-neighboring atoms do not separate into two sites in the radial direction, and it is still an open question whether the sites are composed of two sites or not.
In Figs. 6(c) and 6(d) for YO, the dashed lines indicate an ideal lattice, which is mostly a rock salt-type fcc structure. In contrast to the images of Y2O3,  atoms are clearly observed near the ideal positions. Moreover, even the first and third
  atoms are reconstructed in the figures.
In summary, the crystal structures of YO and Y2O3 in the mixed sample could be distinguished by a valence-selective XFH measurement. For this sample, the two structures are macroscopically separated. This XFH method employing the incident X-ray energy in the XANES region can, in principle, be applied to microscopically valence-mixed crystals.
5.2. YbInCu4 valence transition material10)
YbInCu4 is well known as a valence transition material. An abrupt change was reported by Felner and Nowik23) in 1986 in the T dependence of the magnetic susceptibility of YbxIn1−xCu2 (x ∼ 0.3 − 0.6). A simple valence fluctuation model was proposed, by which a first-order Yb3+ to Yb2+ phase transition was predicted with simply increasing T. These compounds exhibit the sharpest T-dependent valence phase transition in any metallic systems. When decreasing T through the transition temperature, Tv, at about 42 K, the lattice constant of a cubic C15b structure with the space group of  shows a sudden increase by about 0.15%. In addition, 170Yb Mössbauer spectroscopy,23) electrical resistivity,23,24) specific heat,23) and 115In Knight shift24) measurements revealed magnetic, electronic, and thermal anomalies at Tv.
Concerning the  electron occupancy across Tv, the XANES analysis gave a change of
  .25) A bulk-sensitive hard X-ray photoelectron spectroscopy showed a slightly larger change of
  .26) The valency change was also observed by a resonant X-ray scattering spectroscopy at the Yb LIII edge, and a change of approximately
  was reported.27)
The atomic radius of Yb2+ ions is much larger than that of Yb3+ ions by about 17%, even depending on the coordination number around the Yb ions.28) So, an increase in the averaged atomic radii of Yb ions can be estimated to be 2.2–2.7% on the valence transition, which is much larger than the actual increase of the lattice constant by 0.15% at Tv. Thus, the Yb2+ ions with large atomic size should squeeze into a rigid crystal lattice below Tv, and large lattice distortions are expected around the Yb2+ ions.
The features in the Yb LIII XANES spectra of YbInCu4 were already shown in Fig. 2 at 7 and 300 K. At 7 K, a shoulder is observed at 8.939 keV, which is characterized by the Yb2+ ions. When the incident X-rays are employed at this energy, only Yb  electrons in Yb2+ ions can excite and emit fluorescent X-rays, while those in Yb3+ do not. Therefore, the obtained hologram measured at 8.939 keV composes valence-selective structural information around mainly Yb2+ ions.
Single-crystal YbInCu4 was grown by a flux growth method. Constituent elements with stoichiometric ratios in a InCu flux were put in an alumina crucible, and sealed in an evacuated quartz ampoule. The sample was then heated to 1100 °C and cooled slowly down to 800 °C. After remaining at 800 °C for 20 h, the flux was removed. The crystal sample was cleaved so as to have a flat (001) surface with an area larger than 1 × 1 mm2. The crystallinity of the sample was examined by taking a Laue photograph, and the concentration and homogeneity over the sample were confirmed to be within the experimental errors by EPMA.
Yb Lα (7.414 keV) XFH measurements were carried out at 7 and 300 K by using a cryostat designed solely for XFH experiments (Pretech Co. Ltd., type XFME-RR4K) at BL39XU of the SPring-8. The XFH signals were recorded at incident X-ray energies of 8.939 and 8.947 keV as indicated by the arrows in Fig. 2. The former excites the Yb2+ ions and the latter both the Yb2+ and Yb3+ ions.
Figure 7(a) shows the obtained 3D atomic images around Yb atoms in YbInCu4 on the (001) plane measured at 8.947 keV at 300 K, where only Yb3+ ions are distributed. The dashed lines indicate an ideal lattice of the C15b structure obtained by XRD measurement.24) As clearly seen in the figure, the prominent atomic images are located at the ideal fcc positions, although weak artifacts are observed.
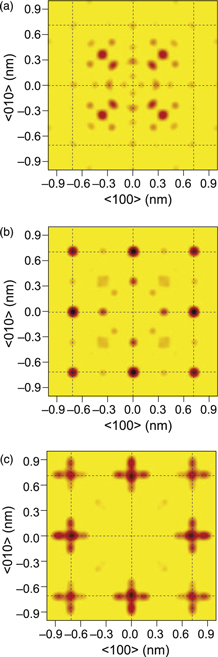
Fig. 7. (Color online) 3D atomic images around Yb atoms in YbInCu4 on the (001) plane measured at 8.947 keV at (a) 300 and (b) 7 K, and (c) those at 8.939 keV at 7 K. Dashed lines indicate an ideal lattice of the C15b structure. Taken from Ref. 10.
Download figure:
Standard image High-resolution imageFigure 7(b) shows the result at 7 K measured at the same incident energy. Owing to decreases of positional fluctuations at low T, the image becomes much clearer compared with (a). However, only the images at the first fcc positions in the  directions get weaker, which may be due to the mixture of local structures around the Yb3+ and Yb2+ ions.
Figure 7(c) shows the result measured at the incident X-ray energy of 8.939 keV at 7 K, by which only the Yb2+ ions emit fluorescent X-rays. Although the energy difference is only 8 eV, the atomic images are very different. Firstly, the first neighboring Yb ions in the (001) plane are again very weak, indicating that the positional fluctuations of these atoms are very large. Secondly, the atomic images beyond the second neighboring Yb ions in the (001) plane are always of cross (+) form, and the more distant parts in the crosses are stronger than the closer parts in the crosses.
To explain the obtained atomic images, it is hard to imagine that every neighboring atom shifts toward the  and
and  directions. Instead, it is likely that the central Yb2+ ion shifts from the lattice point toward the
  and
and  directions as shown in Fig. 8. The directions of the shifts are determined to avoid the first neighboring atoms in the
  directions. Owing to the positional shifts, all of the atomic images have the form of crosses. Due to the much larger atomic radii, the central Yb2+ atom pushes the first and second neighboring atoms, and thus, the distant sides of these images become prominent.
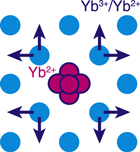
Fig. 8. (Color online) A plausible structural model of the central Yb2+ ion. Taken from Ref. 10.
Download figure:
Standard image High-resolution imageIn summary, we have carried out valence-selective XFH measurements on an YbInCu4 valence transition material, from which it is clearly revealed that the local structures around Yb2+ and Yb3+ are very different from each other, and that there are large positional shifts of Yb2+ ions from the lattice points.
5.3. Fe3O4 mixed valence material20)
Fe3O4 is well known as a mixed valence material, which has plural valencies of Fe2+ (fraction: 1/3) and Fe3+ (2/3) in a crystal. Figure 9 shows the crystal structure of Fe3O4 magnetite.29) It is believed that half of Fe3+ ions occupy A-sites to form tetrahedral local structures with four O atoms, and the remaining half of Fe3+ ions and all Fe2+ ions enter B-sites to build octahedral local atomic arrangements with six O atoms. The fractions of the A- and B-sites in the crystal are 1/3 and 2/3, respectively. Note that the Fe–O bond length in the A- and B-sites are 0.1887 and 0.2042 nm, respectively.29)
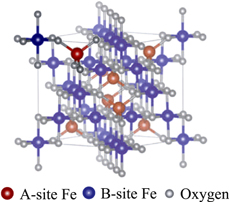
Fig. 9. (Color online) The cubic structure of magnetite, Fe3O4, where Fe atoms occupy both tetrahedral (A-site) and octahedral (B-site) sites. Taken from Ref. 30.
Download figure:
Standard image High-resolution imageFigure 10 shows Fe K XANES spectra of Fe3O4, FeO, and Fe2O3 indicated by the solid, dotted, and dashed curves, respectively.30) An energy shift in the absorption edges is observed between the divalent FeO and trivalent Fe2O3 of about 3 eV. In addition, a prepeak or pre-shoulder is observed at about 7.114 keV for Fe2O3 and Fe3O4, which originates from Fe3+.

Fig. 10. (Color online) Fe K XANES spectra of Fe3O4, FeO, and Fe2O3 indicated by solid, dotted, and dashed curves, respectively. The valence-selective XFH experiments were carried out at 7.114 and 7.120 keV as shown by dashed lines. Taken from Ref. 30.
Download figure:
Standard image High-resolution imageFor the valence-selective XFH experiments, incident X-ray energies were chosen at 7.114 and 7.120 keV, as shown by the dashed lines in the figure, with which the trivalent Fe3+ and divalent Fe2+ contributions were highly enhanced for the central atom, respectively. The XFH experiments were carried out at BL39XU of the SPring-8 and BL6C of the PF-KEK.
Figure 11 shows the Fe Kα holograms obtained at incident X-ray energies of (a) 7.114 and (b) 7.120 keV.20) Although the energy difference is only 6 eV, the holographic features are quite different from each other. In particular, the holographic oscillations are more distinct at 7.114 keV, indicating that the local structures around the Fe3+ ions are simple, and small positional fluctuations are expected.

Fig. 11. (Color online) Fe Kα holograms of Fe3O4 obtained at incident X-ray energies of (a) 7.114 and (b) 7.120 keV.
Download figure:
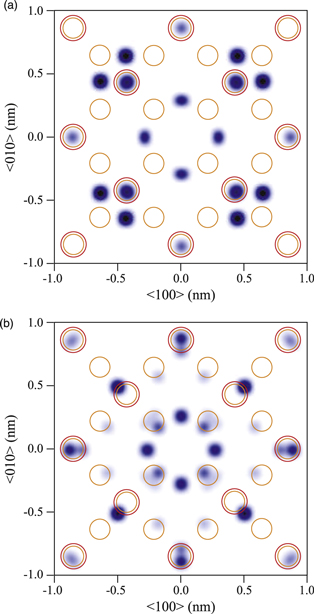
Standard image High-resolution imageFigure 12 represents the 3D atomic images around Fe atoms in Fe3O4 on the (001) plane obtained at incident X-ray energies of (a) 7.114 and (b) 7.120 keV.20) The large and small circles in the figures indicate the ideal positions of Fe ions around the A- and B-sites for the central Fe atoms, respectively. The most prominent atomic images in (a) are observed at the ideal positions of the A-site, where only the Fe3+ ions are located.
Fig. 12. (Color online) 3D atomic images around Fe atoms in Fe3O4 on the (001) plane obtained at incident X-ray energies of (a) 7.114 and (b) 7.120 keV. Large and small circles indicate ideal positions of Fe atoms in the A- and B-sites, respectively.
Download figure:
Standard image High-resolution image
This result looks rather inconsistent with the local structures obtained from XRD mentioned above. The local structures around the Fe3+ atoms are a mixture of tetrahedral A-sites and octahedral B-sites, which is much more complicated than those around the Fe2+ atoms. However, the present experimental results gave the opposite conclusion.
To solve this inconsistency, the spin-state natures of the atomic radii may be important. According to Shannon,28) atomic radii, d, are highly dependent on the spin states of high and low spin (HS and LS) and coordination numbers, N, around the Fe ions. In fact, the d values of HS Fe3+ ions in the A-site (N = 4) and B-site (N = 6) are obtained to be 0.049 and 0.0645 nm, respectively, and those of LS Fe3+ are larger by 0.01 nm. As mentioned above, the space for Fe atoms in the A-sites is much smaller than that in the B-sites, and thus, the HS Fe3+ ions are likely to enter the A-sites and the LS ones may prefer the B-sites.
If the prepeak in the Fe K XANES spectrum of Fe3O4 is concerning the HS states of the Fe3+ ions, the obtained holographic data measured at the incident X-ray energy of 7.114 keV selectively show the local structures of the A-site, which is consistent with the experimental result. On the other hand, the atomic images measured at 7.120 keV show weak indication of the B-site position with shifted positions. The images are composed of complex atomic arrangements, i.e., a mixture of central Fe ions with different atomic radii depending on the spin states and valencies.
In summary, valence-selective XFH experiments were carried out on mixed valence Fe3O4. Very different atomic images were obtained with a small difference in the incident X-ray energy by 6 eV near the Fe K absorption edge. For the further investigations, however, the obtained atomic images had many artifacts, and most of the prominent images were outside the ideal positions, owing to the small amplitudes of the experimental holograms of about 0.04%. Detailed experiments with better statistics are now in progress.
6. Summary and perspective
In this article, valence-selective structural characterizations by XFH were reviewed in detail, for which usual diffraction and XAFS techniques are hardly applied at present. A small change of only about 10 eV in the incident X-ray energy can select specific characters around the central atom with a specific valence. In the case of insufficient holographic data with a single incident X-ray energy, the sparse modeling approach of L1 regression was used to reconstruct 3D atomic images. Three examples of the XFH experiments on Y oxide thin film, YbInCu4 valence transition material, and Fe3O4 mixed valence material, were introduced to show the excellent potential of this technique.
Since XANES spectra contain electronic information, such as orbital angular momentum and spin states, besides valence states, it is possible to conduct electronic state-selective XFH experiments, in principle, for such electronic states concerning functional crystals. In fact, HS and LS states of Fe atoms in the present Fe3O4 mixed valence material and an Fe65Ni35 Invar alloy could be distinguishable for the local structure characterizations, which was carried out subsequently to our element-selective XFH work.31) These novel capacities of XFH experiments may help us to understand the structure–property relationship in functional materials.
Acknowledgments
The valence-selective XFH experiments on the functional materials introduced in this article were performed in collaboration with the coauthors Stellhorn et al.,19) Hosokawa et al.,10) and Hosokawa et al.20) The authors thank Professor Ichiro Akai and Professor Masato Okada for the useful information on sparse modeling. The XFH experiments were performed at BL6C of the PF-KEK (Nos. 2009G551, 2013G583, and 2019G635), BL12B2 (No. 2018B4132), BL13XU (Nos. 2015A0116 and 2017A0116), and BL39XU (Nos. 2015B1005, 2018A1214, and 2019A1591) of the SPring-8. These works were supported by JSPS Grant-in-Aid for Scientific Research (B) (No. 17H02814) and Challenging Research (Exploratory) (No. 18K18738), Innovative Areas of 3D Active-Site Science (Nos. 26105006 and 26105013) and Sparse Modeling (No. 16H01553), and JST CREST (No. JPMJCR1861). JRS gratefully acknowledges financial support as Overseas Researcher under a JSPS fellowship (No. P16796).