

Abstract
A new superconducting sample, Ba1−xCsxTi2Sb2O, was prepared and characterized in a wide pressure range. The maximum value of superconducting transition temperature, Tc, of Ba1−xCsxTi2Sb2O was 4.4 K for x = 0.25 at ambient pressure. The crystal structure was determined to be tetragonal [space group of P4/mmm (No. 123)]. The charge density wave/spin density wave transition was observed at 44 K for Ba1−xCsxTi2Sb2O (nominal x = 0.25) at ambient pressure, but the transition was suppressed by applying pressure. The pressure dependent X-ray diffraction showed no structural phase transition up to 23.4 GPa, but very interesting Tc–pressure (p) behavior was observed, i.e. the Tc decreases with an increase in pressure up to 4.0 GPa, but it increased above 4.0 GPa, suggestive of non-BCS type behavior. Thus, the systematic study on new pnictide superconductor, Ba1−xCsxTi2Sb2O, was achieved, and the fascinating behavior of superconductivity against pressure was discovered.
Export citation and abstract BibTeX RIS
1. Introduction
A new superconducting material, Ba1−xNaxTi2Sb2O, which shows a layered titanium-based pnictide oxide structure [tetragonal structure (space group: P4/mmm, No. 123)], was prepared and characterized by Doan et al.1) The superconductivity was reported to be observed at x = 0–0.33 in Ba1−xNaxTi2Sb2O.1) Subsequently, the superconductivity and physical features of Ba1−xNaxTi2Sb2O were extensively studied from theoretical and experimental points of view.2–7) The maximum superconducting transition temperature, Tc, reached 5.5 K at x ∼ 0.15.1) This superconductivity is observed with the Na doping of BaTi2Sb2O in which the magnetic/charge ordering such as a charge density wave (CDW)/spin density wave (SDW) transition is suppressed; non-doped BaTi2Sb2O is also a superconductor with Tc of 1.2 K.8,9) Admittedly, the hole is accumulated for Ti2Sb2O layers with Na doping, which lowers the CDW/SDW transition temperature, Ts, from 54 K at x = 0 to 30 K at x = 0.25.1) The superconductivity is observed together with CDW/SDW state at x = 0–0.33. Such a coexistence of superconducting state and magnetic/charge order state is found in unconventional superconductors such as heavy Fermions10) and two-dimensional layered chalcogenides.11,12)
Furthermore, Ba1−xKxTi2Sb2O was prepared by Pachmayr and Johrendt.13) Its crystal structure was the same as that of Ba1−xNaxTi2Sb2O.1) The Tc value reached 6.1 K at x = 0.12 and no superconductivity was observed at x > 0.20.13) Moreover, the superconductivity with Tc of 5.4 K was observed in Ba1−xRbxTi2Sb2O (x = 0.2).14) It is reported that the phase diagrams of Tc–x are similar each other among Ba1−xNaxTi2Sb2O, Ba1−xKxTi2Sb2O, and Ba1−xRbxTi2Sb2O.1,13,14) The pressure dependence of superconductivity in Ba1−xNaxTi2Sb2O (x = 0, 0.1 and 0.15) was reported in a pressure range from 0 to 1.6 GPa (=16 kbar).15) The behavior of Tc in the pressure range is different depending on x, i.e. the Tc for x = 0.15 decreases straightforwardly from 5.2 K (0 GPa) to 4.2 K (1.6 GPa), while the Tc value increases monotonically from 2.1 K (0 GPa) to 2.9 K (1.6 GPa) at x = 0. Moreover, the Tc value for x = 0.1 increases from 3.8 K (0 GPa) to 4.2 K (0.5 GPa) and saturates at pressure of 0.5 to 1.6 GPa. Such a drastic variation of pressure dependence against x is a very interesting and exciting feature in Ba1−xNaxTi2Sb2O.
Here, we report a new discovery of superconductivity in Ba1−xCsxTi2Sb2O, and a characterization of its superconducting behavior at ambient and high pressures. The Tc was 4.4 K for Ba0.75Cs0.25Ti2Sb2O at ambient pressure. The stoichiometry of this sample was Ba0.59(3)Cs0.41(3)Ti1.8(4)Sb1.7(3)Oy, which was determined by energy dispersive X-ray (EDX) spectroscopy; the y value cannot be determined by EDX. The Tc gradually decreased with an increase in x from x = 0.25. The X-ray diffraction (XRD) pattern of Ba0.75Cs0.25Ti2Sb2O was well analyzed under the tetragonal structure [space group of P4/mmm (No. 123)]. Pressure-dependent XRD patterns were recorded in a pressure range of 4.08–23.4 GPa, all of which were analyzed in the space group of P4/mmm. The temperature dependence of resistance (R) were measured in a four terminal measurement mode at 0.88–12.3 GPa to draw the Tc–p phase diagram in a wider pressure range than that of Ba1−xNaxTi2Sb2O (0–1.6 GPa) reported previously.15)
2. Experimental
The Ba1−xCsxTi2Sb2O sample was prepared according to the reaction process shown in Fig. 1(a). The nominal x value in Ba1−xCsxTi2Sb2O was selected in an x range of 0.1–0.6. The compounds of BaO (99.99%, Sigma-Aldrich), BaO2 (99%, High Purity Chemicals), Cs2CO3 (99.995%, Sigma-Aldrich), Ti (99.98%, Nilaco), Sb (99.999%, Nilaco) were employed for the generation of Ba1−xCsxTi2Sb2O. The compounds mixed at the selected stoichiometry were introduced into a Nb tube. The Nb tube was welded under Ar atmosphere, and it was sealed in a quartz tube under vacuum. The tube was heated according to the reaction process shown schematically in Fig. 1(a). The obtained Ba1−xCsxTi2Sb2O sample was treated without an exposure to air, because it is very air-sensitive.
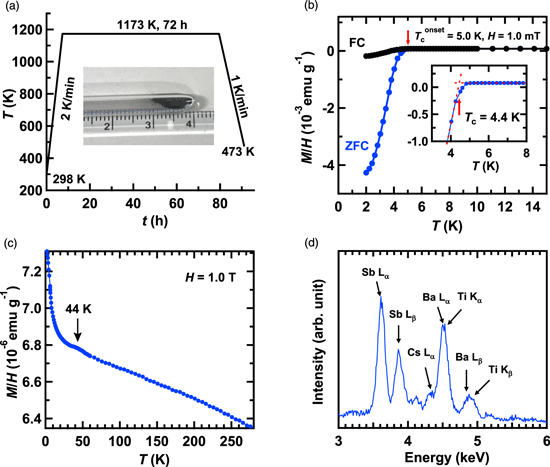
Fig. 1. (Color online) (a) Reaction process of Ba1−xCsxTi2Sb2O. In inset of (a) the photo of sample is shown. (b) M/H–T plot of Ba1−xCsxTi2Sb2O (nominal x = 0.25) recorded in ZFC and FC modes; H was 10 Oe. Inset of (b), how to determine the Tc is shown. (c) M/H–T plot of Ba1−xCsxTi2Sb2O (nominal x = 0.25) recorded at H of 1.0 T; the superconductivity is destroyed. (d) EDX spectrum of Ba1−xCsxTi2Sb2O (nominal x = 0.25).
Download figure:
Standard image High-resolution imageThe XRD, EDX and magnetic susceptibility (M/H) were recorded for the confirmation of generation of Ba1−xCsxTi2Sb2O; M and H refer to magnetization and applied magnetic field, respectively. The XRD measurements at ambient and high pressures were performed using synchrotron radiation at BL12B2 of SPring-8, and the wavelength, λ, of X-ray beam was 0.688 80 Å. A diamond anvil cell (DAC) was used for the high-pressure XRD measurement, with the sample being set into the hole of a stainless steel (SUS) plate. Daphne 7373 was employed as the pressure medium for the XRD measurement under high pressure. The pressure was monitored by ruby fluorescence. The M/H measurement was performed using SQUID magnetometer (Quantum Design MPMS2). The EDX spectrum was recorded with an EDX spectrometer equipped with a scanning electron microscope (KEYENCE VE-9800-EDAX Genesis XM2). The EDX spectra were measured for 5–10 different positions of the each sample at room temperature.
For the measurement of temperature dependence of R, the Ba1−xCsxTi2Sb2O sample (nominal x = 0.25) was introduced into the DAC in Ar-filled glove box because this sample is very air-sensitive. The polycrystalline sample was loaded directly on a Kapton sheet/epoxy resin/rhenium in the DAC; six Cu electrodes were attached to the Kapton sheet. NaCl was used as the pressure medium to obtain the static pressure. The applied pressure was determined by monitoring ruby fluorescence.
The value of R was recorded at 290–1.5 K in a standard four-terminal measurement mode using an Oxford superconducting magnet system. The temperature was controlled using an Oxford Instruments MercuryiTC. The H was controlled using Oxford Instruments MercuryiPS. Electrical current (I) was supplied by a Keithley 220 programmable current source, and the exact value of I was monitored by an Advantest R-8240 digital electrometer. The voltage (V) was measured by an Agilent 34420 digital nanovoltmeter.
The M/H–T plot under pressure was measured using the above SQUID machine; the Ba1−xCsxTi2Sb2O sample (nominal x = 0.25) was introduced in a piston cylinder cell in Ar-filled glove box, and the daphne 7373 was used as a pressure medium.
3. Results and discussion
Figure 1(b) shows temperature (T) dependence of M/H of Ba1−xCsxTi2Sb2O (nominal x = 0.25) in zero field cooling (ZFC) and field cooling (FC) modes at 0 GPa. The rapid drop of M/H was recorded below 5 K in M/H–T plot in ZFC mode, showing the onset superconducting transition temperature, Tconset, as high as 5.0 K. The Tc was 4.4 K which was determined from the crossing point of the M/H–T plot at normal state and the rapid drop [Inset of Fig. 1(b)]. The H was 10 Oe (= 1.0 mT). The shielding fraction, SF, evaluated at 2.0 K was 32.2%. The M/H–T plot in FC mode showed the drop of M/H–T plot, but the Meissner fraction was low (several %). The Tconset of 5.0 K and Tc of 4.4 K were a little lower than the maximum Tc values [Tc = 5.5 K for Ba1−xNaxTi2Sb2O (x = 0.15),1) Tc = 6.1 K for Ba1−xKxTi2Sb2O (x = 0.12)13) and Tc = 5.4 K for Ba1−xRbxTi2Sb2O (x = 0.2)14)] reported previously. As seen from Fig. 1(c), the small peak is observed at around 44 K in M/H–T plot recorded at 1.0 T, which may be assigned to the CDW/SDW transition reported for Ba1−xNaxTi2Sb2O, Ba1−xKxTi2Sb2O and Ba1−xRbxTi2Sb2O.1,13,14)
The EDX spectrum [Fig. 1(d)] showed that the stoichiometry of the above sample [Ba1−xCsxTi2Sb2O (nominal x = 0.25)] was Ba0.59(3)Cs0.41(3)Ti1.8(4)Sb1.7(3)Oy. The EDX spectrum provided only peaks ascribable to Ba, Cs, Ti, Sb and O atoms, but the exact y value (O amount) was not determined owing to the contamination from atmosphere. Through this study, the sample of Ba0.59(3)Cs0.41(3)Ti1.8(4)Sb1.7(3)Oy was employed for measurements of XRD and R–T under pressure.
The XRD pattern of the Ba1−xCsxTi2Sb2O (nominal x = 0.25), which corresponds to the stoichiometry (Ba0.59(3)Cs0.41(3)Ti1.8(4)Sb1.7(3)Oy), recorded at ambient pressure is shown in Fig. 2(a), with being consistent with the XRD pattern reported previously.1) The XRD pattern was analyzed by Le Bail fitting to determine the lattice constants. The analysis was performed under the space group of P4/mmm (tetragonal structure, No. 123), which is the same as Ba1−xNaxTi2Sb2O.1) As seen from Fig. 2(a), the XRD pattern was well fitted by the calculated pattern. The lattice constants, a and c, were determined to be 4.121 04(5) and 8.1394(2) Å, respectively.

Fig. 2. (Color online) XRD patterns of Ba1−xCsxTi2Sb2O (nominal x = 0.25) together with the patterns calculated by (a) Le Bail analysis and (b) Rietveld refinement. The pattern R (Rp) and weighted pattern R (wRp) were 7.27% and 13.10%, respectively, in (a) and 7.24% and 12.10%, respectively, in (b). The Rietveld analysis was performed at the x value of 0.41 determined from EDX. The red ticks refer to Bragg reflection positions predicted for Ba1−xCsxTi2Sb2O. The blue solid line corresponds to the difference between the experimental XRD pattern and the calculated one. (c) Schematic representation of crystal structure prepared by Rietveld refinement.
Download figure:
Standard image High-resolution imageMoreover, the XRD pattern was analyzed by Rietveld refinement under the above space group, showing a good fit between the experimental XRD and calculated patterns [Fig. 2(b)]. Table I lists the crystallographic data of Ba1−xCsxTi2Sb2O at the x value determined from EDX (x = 0.41) determined by the Rietveld refinement. The values of a and c were determined to be 4.120 73(5) and 8.1388(2) Å, respectively, in consistent with those determined by Le Bail fitting.
Table I. Atomic coordinates of Ba0.75Cs0.25Ti2Sb2O. The actual stoichiometry is Ba0.59(3)Cs0.41(3)Ti1.8(4)Sb1.7(3)Oy.
| Atom | Site | Occupancy | x | y | z | Uiso (Å2) |
|---|---|---|---|---|---|---|
| Ba | 1d | 0.59 | 0 | 0 | 0 | 0.012(1) |
| Cs | 1d | 0.41 | 0 | 0 | 0 | 0.012(1) |
| Ti | 2f | 1 | 0 | 0.5 | 0.5 | 0.023(3) |
| Sb | 2g | 1 | 0.5 | 0.5 | 0.2538(3) | 0.0059(8) |
| O | 1c | 1 | 0 | 0 | 0.5 | 0.10(2) |
Figure 2(c) shows the schematic representation of crystal structure of Ba1−xCsxTi2Sb2O prepared using the atomic coordinates listed in Table I. The crystal is called "CeCr2Si2C type structure." First, we must comment that the crystal structure of Ba1−xCsxTi2Sb2O is the same as those of Ba1−xMxTi2Sb2O (M: Na, Rb and K).1,13,14) Namely, the crystal structure of Ba1−xNaxTi2Sb2O is still remained even by an intercalation of Cs atom with the largest ionic radius among alkali metal atoms. If the crystal structure is viewed in more detail, it can be noted that the crystal is formed by the OTi4 antiperovskite layers, which is similar to CuO2 layers in the high-Tc cuprate superconductor.16–23) The layers are capped by Sb at both top and bottom of empty center site surrounded by four Ti atoms, and the Ba/Cs atoms are located at the top and bottom of a part of O site surrounded by four Ti sites. This crystal structure is recognized as a stacking structure of Ti2Sb2O layers along c-axis, indicating that two dimensional (2D) Ti2Sb2O layer is the conduction layer. This crystal structure is not only interesting from similarity to the structure of cuprate described above, but also fascinating as the target material in the investigation of local structure by fluorescence holography, because of the unique 2D layer-by-layer structure.
We have investigated the local structure around doped element in various types of 2D layered materials, graphite24) and topological insulator,25) by use of X-ray photoelectron and fluorescence holograms thus far, which provided the precise location of doped element; the X-ray photoelectron and fluorescence holography can determine the surface and bulk structures, respectively. Namely, the local structure determined using holography technique has a very high reliability and precision, since the three dimensional real image can be directly constructed from hologram pattern containing phase information. The study on local structure in the bulk crystals of Ba1−xMxTi2Sb2O and Ba1−xCsxTi2Sb2O using X-ray fluorescence holography technique is the future task.
Figure 3(a) shows the Tc–x plot of Ba1−xCsxTi2Sb2O, in which x is the nominal value. The maximum Tc of 4.4 K is found at x = 0.25, and it slowly decreases with an increase in x. The x dependence of SF determined from M/H value at 2 K is shown in Fig. 3(b). The bulk superconductivity was not observed below x = 0.25. Actually, the SF at 2 K was ∼1% for x = 0.2. Thus, the bulk superconductivity in Ba1−xCsxTi2Sb2O was found only at x = 0.25–0.6. The SF (=55.2%) for Ba1−xCsxTi2Sb2O (nominal x = 0.5) is the highest value realized in Ba1−xCsxTi2Sb2O. This is a little different from that of Ba1−xNaxTi2Sb2O and Ba1−xKxTi2Sb2O which showed the bulk superconductivity even below x = 0.2.1,13)
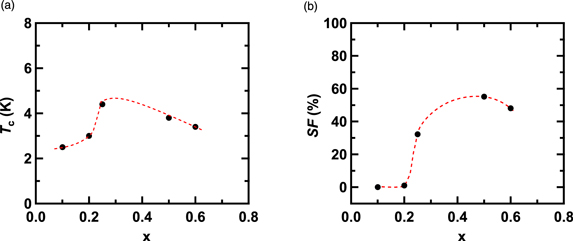
Fig. 3. (Color online) (a) Tc–x plot and (b) SF–x plot of Ba1−xCsxTi2Sb2O; x is the nominal value. The SF was determined from M/H at 2.0 K.
Download figure:
Standard image High-resolution imageFigure 4(a) shows the XRD patterns of Ba1−xCsxTi2Sb2O (nominal x = 0.25) recorded at 4.08–23.4 GPa. All XRD patterns were well analyzed in the space group of P4/mmm which is the same as that at 0 GPa. The values of a and c were determined by Le Bail analysis for whole XRD patterns at 4.08–23.4 GPa. The pressure dependence of a and c are shown in Figs. 4(b) and 4(c), respectively, which provides a smooth decrease in both values against pressure. Significant structural phase transitions were not found at 0–23.4 GPa. In addition, any decomposition of the sample was not found in a whole pressure range.

Fig. 4. (Color online) (a) XRD patterns of Ba1−xCsxTi2Sb2O (nominal x = 0.25) at 4.08–23.4 GPa. (b) a–p and (c) c–p plots of Ba1−xCsxTi2Sb2O (nominal x = 0.25).
Download figure:
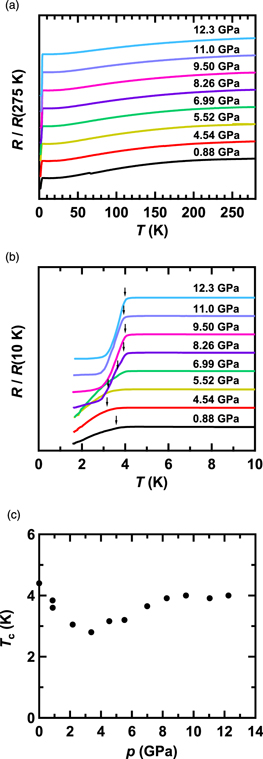
Standard image High-resolution imageFinally, we recorded temperature dependence of R of Ba1−xCsxTi2Sb2O (nominal x = 0.25) at different pressures. The plots of R/R(275 K)–T and R/R(10 K)–T at different pressures are shown in Figs. 5(a) and 5(b), respectively. The metallic behavior at 0.88–12.3 GPa is suggested from the R/R(275 K)–T plots [Fig. 5(a)]. A clear CDW/SDW transition was not observed in R/R (275 K)–T plots at 0.88–12.3 GPa, although the small peak at around 44 K was observed in M/H–T plot recorded at 1.0 T under ambient pressure [Fig. 1(c)]. Moreover, the M/H–T plots were recorded at 10 Oe and 1.0 T under pressure of 0.24 GPa. The M/H–T plot at 10 Oe showed a clear superconducting transition at Tc = 3.8 K, while that at 1.0 T never showed any peak which is different from that shown in Fig. 1(c), indicating no CDW/SDW transition at 0.24 GPa. Also, any peak was not observed at 1.0 T under pressure of 0.59 GPa [see Fig. S1 in the online supplementary data, which is available online at stacks.iop.org/JJAP/58/110603/mmedia], and the superconducting transition (Tc = 3.75 K) was also recorded at 10 Oe under pressure of 0.59 GPa. Namely, the CDW/SDW transition disappeared by the application of pressure for Ba1−xCsxTi2Sb2O.
Fig. 5. (Color online) (a) R/R(275 K)–T and (b) R/R(10 K)–T plots of Ba1−xCsxTi2Sb2O (nominal x = 0.25) recorded at 0.88–12.3 GPa. Each plot includes offset. (c) Tc–p plot of Ba1−xCsxTi2Sb2O (nominal x = 0.25).
Download figure:
Standard image High-resolution image
The superconducting transition was observed for all R–T plots measured at 0.88–12.3 GPa, as seen from Fig. 5(b). The value of Tc is plotted against pressure [Fig. 5(c)]. The Tc monotonically decreases with an increase in pressure up to ∼4 GPa; the minimum Tc is 2.8 K at 3.37 GPa. The Tc value increases with further increasing pressure. The Tc became 4.0 K at 9.50 GPa. Such a variation of Tc cannot be explained by the simple BCS theorem which suggests the decrease in Tc owing to the reduction of density of states (DOS). However, we have never seen the structural phase transitions at around 4.0 GPa, suggestive of the presence of electronic transition causing the increase in Tc. One possibility is the Lifshitz transition accompanying the variation of the Fermi surface topology. If this is the case, a drastic change of DOS causing the observed enhancement of Tc may be expected. Such a drastic variation of topology of the Fermi surface caused by doping of carrier26–31) and/or by applying pressure32,33) is suggested in various superconductors from theoretical and experimental points of view. For the confirmation of Lifshitz transition under pressure, the Hall effect measurement may be indispensable in a wide pressure range.
4. Conclusion
The systematic study on the new superconductor, Ba1−xCsxTi2Sb2O, was achieved in a wide pressure range. The maximum Tc was 4.4 K for x = 0.25, and the Tc–x plot was drawn. The crystal structure was tetragonal [space group of P4/mmm (No. 123)] up to 23.4 GPa. Very interesting non-BCS type Tc–p phase diagram was observed, indicating that this superconductor is very attractive as the research target in superconductor physics. Ba1−xCsxTi2Sb2O may be very fascinating as the target material for the study on local structure by fluorescence holography, owing to the interesting layer-by-layer stacking structure of Ti2Sb2O and a partial substitution of Cs for Ba.
Acknowledgments
This study was partly supported by Grants-in-Aid (26105004, 17K05500, 18K04940, 18K18736 and 19H02676) from MEXT. The XRD measurements at SPring-8 were carried out under the proposals of 2018A4140 and 2019A4131.
Biographies

Ms. Yanan Wang received her M.S. degree from School of Physics and Information Technology, Shaanxi Normal University, Xi'an, China, in 2017. She is now working on design and characterization of new superconducting materials. Her current research interest is to realize the high-Tc superconductors.

Mr. Xiaofan Yang received his M.S. degree from School of Materials Science and Engineering, Shaanxi Normal University, Xi'an, China, in 2016. He is now working on chemical and physical properties of various types of superconductors under pressure.

Mr. Tomoya Taguchi received his B.S. degree from Department of Chemistry, Okayama University, Okayama, Japan, in 2019. He is now working on design and characterization of new superconducting materials. His current research interest is to realize the new superconducting materials and to pursue the physical behavior of superconducting materials under pressure.

Ms. Huan Li received her M.S. degree from School of Materials Science and Engineering, Shaanxi Normal University, Xi'an, China, in 2018. She is now working on preparing new superconducting materials and investigating their superconductivity under pressure. Her current research focuses on the superconductivity of metal doped two-dimensional layered materials under pressure.

Dr. Tong He received her Ph.D. degree from Okayama University, Okayama, Japan, in 2019. She is now an Assistant Professor of Research Institute for Interdisciplinary Science, Okayama University, Okayama, Japan. Her main research subjects are to study a pressure induced superconductivity of topological insulators, as well as to synthesize and characterize new topological insulators.

Dr. Hidenori Goto was born in Hyogo, Japan in 1968. He received Dr. Sci. degree from Graduate School of Science of the University of Tokyo in 2002. After working at RIKEN and University of Tsukuba, he moved Okayama University in 2011. He is presently affiliated with Research Institute for Interdisciplinary Science, Okayama University as Associate Professor. His current research interests are elucidation of novel electronic phenomena in two-dimensional materials and development of functional devices with microfabrication techniques.

Dr. Ritsuko Eguchi received her Ph.D. degree from Department of Applied Physics, Graduate School of Engineering, the University of Tokyo, Tokyo, Japan, in 2004. She is now an Assistant Professor of Research Institute for Interdisciplinary Science, Okayama University, Okayama, Japan. Her research interests are physical properties in two-dimensional materials and interface superconductivity in oxide heterostructures, as well as to study electronic structures of solids using photoemission spectroscopy.

Dr. Takafumi Miyazaki received his Ph.D. degree from Graduate School of Natural Science and Technology, Kumamoto University, Kumamoto, Japan in 1993. He is now a Professor of Environment Health & Safety Intelligence, Okayama University, Okayama, Japan. He is currently working on characterization of superconducting materials under high pressure. His research interests are in physics and chemistry of intercalation/layer structure/low-dimensional compounds with various organic/inorganic materials. He has published 80 original papers in the above research field.

Dr. Yen-Fa Liao received his Ph.D. degree from Department of Engineering and System Science, Tsing-Hua University, Taiwan in 2009. He is now a beamline scientist in Taiwan beamline - SP8 12B2 at SPring8. He is currently working and development on synchrotron technique such as operando PXRD, XAS, EXAFS and HAXPES experiment. His research interests are in physics and chemistry of advance materials, as well as device physics of field control magnetic property with carbon and transition metal oxide materials. He also has some research of the in-situ experiment on energy material by synchrotron technique at SP8 12B2 beamline.

Dr. Hirofumi Ishii received his Ph.D. degree from Department of Applied Physics, The University of Tokyo, Japan in 2002. He joined National Synchrotron Radiation Research Center(NSRRC), Taiwan, in 2002. He is beamline scientist at Taiwan Beamlines at SPring-8 BL12B2. He is currently interested in X-ray spectroscopy under extreme conditions.

Dr. Yoshihiro Kubozono received his Ph.D. degree from Department of Chemistry, Kyushu University, Fukuoka, Japan, in 1991. He is now a Professor of Research Institute for Interdisciplinary Science, Okayama University, Okayama, Japan. He is currently working on design and characterization of superconducting materials and electronic devices. His research interests are in physics and chemistry of superconducting/quantum materials, as well as device physics of field-effect transistors with various organic/inorganic materials. He has published more than 220 original papers.