
Abstract
The influence of aluminum mole fraction of AlxGa1-xN/AlyGa1-yN multiple quantum wells (MQWs) on the optical polarization, light extraction efficiency (LEE) and external quantum efficiency (EQE) of deep ultra violet light emitting diodes in the wavelength range between 264 and 220 nm is investigated. The on-wafer EQE decreases from 0.6% to 0.00013% in this wavelength range. Polarization resolved photoluminescence and electroluminescence measurements show a change from dominant transverse-electric to dominant transverse-magnetic polarized light emission with increasing aluminum mole fraction in the MQW. The quantitative agreement with k·p calculations allow to ascribe this shift to a change of the characteristic of the Γ7+ valance band. Ray tracing simulations predict a reduction of the on-wafer LEE from 4% to 1.5%. Therefore the dramatic drop of the EQE in this wavelength range cannot be attributed to a drop in LEE and is most likely dominated by charge carrier injection and radiative recombination efficiency.
Export citation and abstract BibTeX RIS

Content from this work may be used under the terms of the Creative Commons Attribution 4.0 license. Any further distribution of this work must maintain attribution to the author(s) and the title of the work, journal citation and DOI.
1. Introduction
Deep ultra violet (UV) light emitting diodes (LEDs) with emission wavelengths below λ = 240 nm enable applications in the area of medical diagnostics and gas sensing. For example, gases such as NO (λ = 226 nm) or NH3 (λ = 217 nm) can be detected by UV irradiation at their specific absorption lines.1,2) However, the fabrication of such short wavelength LEDs in the deep UV spectral range is quite challenging which is reflected in the drastically dropping external quantum efficiency (EQE) with decreasing emission wavelength.3) By shifting the emission from 239 to 217 nm, a decrease of the EQE by more than three orders of magnitude is observed.4) This coincides with an increase of transverse-magnetic (TM) polarized light emission,5) which results in a change of the radiation pattern and thus in a reduction of the light extraction efficiency (LEE) and EQE.6) The change of the optical polarization is caused by a negative crystal field splitting energy in AlxGa1-xN (x > 0.05) leading to a change of the valence band (VB) order and oscillator strength.7,8) However, the exact transition from dominant transverse-electric (TE) to dominant TM polarized light emission depends on the strain, the quantum well (QW) width, and QW and barrier composition.5,9–13) To estimate the influence of the optical polarization on the LEE, ray-tracing simulations are necessary, as especially the substrate and the structuring of the respective interfaces is very important.6)
In this paper the effect of aluminum composition of AlGaN multiple quantum wells (MQWs) on the optical polarization of light emission is investigated by two techniques, photoluminescence (PL) and electroluminescence (EL) measurements. Additionally, one-dimensional 6-band k·p-method-based calculations are performed and compared to the experimental results. Furthermore, we analyze the dependence of the optical polarization on the emission wavelength and its effect on the LEE of deep UV LEDs by ray-tracing simulations.
2. Experimental methods
Two different sample series have been grown by metalorganic vapor phase epitaxy on (0001) oriented epitaxially laterally overgrown (ELO) AlN/sapphire templates with threading dislocation densities of ∼109 cm−2.14) For PL measurements, three-fold AlxGa1-xN/AlyGa1-yN MQW active regions with 0.48 < x < 0.9 and 0.61 < y < 1.0 were deposited on a 400 nm thick AlN buffer layer and sandwiched between 40 nm thick AlyGa1-yN thick barriers. The QW and barrier thicknesses were kept constant at 1 nm and 5 nm, respectively. Note that x and y were simultaneously varied while keeping the bandgap difference between QWs and barriers constant at 325 meV for all samples. For EL measurements, the aluminum content in the AlxGa1-xN/AlyGa1-yN MQWs was varied for 0.47 < x < 0.86 and 0.6 < y < 0.97 keeping the same bandgap difference. The MQWs were embedded into a LED heterostructure with a transparent 1.2 μm thick Al0.90Ga0.10N:Si or Al0.95Ga0.05N:Si current spreading layer, and a 6 nm thick AlN electron blocking layer, an AlGaN:Mg hole injection short period superlattice, an AlGaN:Mg superlattice, and a GaN:Mg contact layer.4,15)
For PL measurements, the in-plane emission from cleaved facets was analyzed by a polarization-resolving PL setup using an argon fluoride excimer laser with a wavelength of 193 nm, a Horiba spectrometer with a Syncerity CCD camera and a Rochon prism polarizer.16) The measurements were performed at room temperature. The excitation power density was adjusted between 100 and 4800 kW cm−2. For EL measurements, the samples were processed with standard micro fabrication techniques into UV LEDs with a mesa size of 0.04 mm2. The emission power was measured on-wafer through the substrate with a calibrated UV enhanced Si-photodiode. The in-plane emission from facets obtained by cleaving through the mesa was analyzed by a polarization-resolving EL setup using a Glan-Taylor-prism and a compact fiber spectrometer under continuous wave (cw) operation at 10 mA (25 A cm−2) and room temperature without active cooling.17)
In order to get a deeper understanding of the VB structure, the energetic position of the eigenstates, and the degree of polarization, one-dimensional 6-band k·p-method-based calculations have been performed for single AlxGa1-xN QWs, embedded into AlyGa1-yN barriers under consideration of the strain state for growth on ELO AlN/sapphire (a = 3.1057 Å).5,18) Material parameters such as, lattice constants,19) stiffness parameters,20,21) effective mass parameters,22–24) deformation potentials,25,26) as well as band gap, crystal-field and spin–orbit splitting energies,26–28) for GaN and AlN were taken from Refs. 19–28. Monte–Carlo ray-tracing simulations have been performed in order to investigate the influence of the emission wavelength and the optical polarization on the LEE. The simulation considers the dispersion of refractive indices,29) the absorption within the MQW (103 cm−1),6) the n-AlGaN (50 cm−1) and p-(Al)GaN (1.7·105 cm−1) heterostructure layers, the radiation pattern of the active region as determined by the degree of polarization,3) light scattering at the ELO AlN/sapphire interface, as well as the limited size of the photodiode with an area of 1 cm2 positioned 3.5 mm below the wafer.
3. Results and discussion
The theoretical and experimental results are separated in three sections. In the first section the results of the k·p calculations are discussed. In the second section EL and PL polarization dependent spectra are analyzed, and the calculated and measured degree of in-plane light polarization (DoP) is discussed. Finally, in the last section, these results were used in the ray-tracing simulation to discuss the influence of the emission wavelength and DoP on the LEE.
3.1. Schrödinger-Poisson calculations
The VB structure of GaN and AlN is split into three sub-valence bands due to crystal field and spin–orbit splitting.30) In the GaN case, the topmost VB is Γ9, followed by Γ7+ and Γ7− while in the AlN case, the topmost VB is Γ7+, followed by Γ9 and Γ7−.30) Due to their symmetry transition from the conduction band (CB) to these valence bands have different optical polarizations.31) In the ternary AlGaN alloy the energetic position and oscillator strength of these sub-bands depend significantly on the crystal field splitting energy, strain and quantization.5,9–13) The band structure and first eigenstates of a 1 nm thin AlxGa1-xN/AlyGa1-yN single QW was calculated for 0.45 < x < 0.85 and 0.56 < y < 0.96. Figure 1 shows the calculated position of hole ground states E0(Γ7+) and E0(Γ7−) relative to the E0(Γ9) ground state as a function of the aluminum mole fraction in the AlGaN QW. The optical polarization for transitions from the CB ground state to VB ground states E0(Γ9), E0(Γ7+), and E0(Γ7−) is color coded from red (TE) to blue (TM).

Fig. 1. (Color online) Calculated energetic position of the ground states E0(Γ7+) and E0(Γ7−) relative to the E0(Γ9) ground state in the three sub-valence bands and color coded optical polarization from +1 = TE (red) to −1 = TM (blue) for a transition from the conduction band ground state to the specified valence band ground states as a function of the aluminum mole fraction in the AlGaN QW and barriers.
Download figure:
Standard image High-resolution imageFor an aluminum mole fraction of x < 0.62, the two topmost states are E0(Γ9) and E0(Γ7+) (i.e. both TE) while E0(Γ7−) (TM) is more than 40 meV below E0(Γ9) and E0(Γ7+). Consequently, optical transitions for these QWs are dominant TE polarized due to major population and recombination from CB to Γ9 and Γ7+. For 0.62 < x < 0.69, E0(Γ7+) changes its oscillator characteristic from TE to TM. As the energetic distance of E0(Γ7+) and E0(Γ9) is nearly unchanged this leads to an increase in the TM polarized emission (i.e. transitions from CB to Γ7+). At x = 0.69, E0(Γ7+) crosses E0(Γ9), while E0(Γ7−) changes its oscillator characteristic from TM to TE but stays the lowest sub-valence band ground state over the entire composition range. This results in unpolarized emission near the crossing point. For x > 0.69, the topmost state is E0(Γ7+) with a TM characteristic, while the distance to E0(Γ9) and E0(Γ7−) increases with increasing aluminum mole fraction in the QW. Therefore, a major portion of optical transitions is from CB to Γ7+ which leads to dominant TM polarized light emission.
3.2. Polarization resolved measurements
In order to determine the change of the optical polarization of AlxGa1-xN/AlyGa1-yN MQWs, polarization-resolved PL and EL measurements have been performed. Figure 2 shows the in-plane polarization-resolved PL spectra of MQWs with aluminum mole fractions of 0.48 < x < 0.9 and 0.61 < y < 1.0. The spectra are separated into TE and TM polarized emission and normalized to the total peak intensity. By increasing the QW and barrier aluminum mole fraction, the peak emission shifts from 261 nm to 213 nm. The full width at half maximum (FWHM) of the total emission is between 8 and 13 nm. The spectra for x ≥ 0.73 are dominantly TM polarized, and the spectra for x ≤ 0.65 are dominantly TE polarized. The transition between TE and TM polarized emission evaluated from PL measurements takes place between x = 0.65 and x = 0.73.

Fig. 2. (Color online) In-plane polarization-resolved photoluminescence spectra of MQWs with varied aluminum composition (fractional numbers in the top right corner) in the QW and barriers (QB) separated into TE (solid red) and TM (dash-dotted blue) polarized emission and normalized to the total peak intensity (dashed gray).
Download figure:
Standard image High-resolution imageFigure 3 shows the in-plane polarization-resolved EL spectra of LEDs with aluminum mole fractions of 0.47 < x < 0.86 and 0.6 < y < 0.97 within the AlxGa1-xN/AlyGa1-yN MQWs. As for PL, the spectra are separated into TE and TM polarized emission and normalized to the total peak intensity. By increasing the QW and barrier aluminum mole fraction, the peak emission shifts from 264 to 220 nm with a FWHM between 8 and 12 nm. The spectra for x ≥ 0.74 are dominantly TM polarized, the spectra for x ≤ 0.59 are dominantly TE polarized, and the spectrum for x = 0.68 is unpolarized. Additionally, the spectrum for x = 0.68 shows a separation of 4 nm between the maxima of TE and TM polarized emission which we attribute to local fluctuations of the QW composition. Near the crossing point of E0(Γ9) and E0(Γ7+) small changes in the QW composition can influence the optical polarization significantly. Regions with slightly lower aluminum mole fraction would exhibit a longer emission wavelength and a more dominant TE polarized light emission, regions with slightly higher aluminum mole fraction would exhibit a shorter emission wavelength and a more dominant TM polarized light emission. This results in an apparent separation of the TE and TM spectrum. In both measurement techniques (PL and EL) the spectra with x < 0.68 show a slight separation between the maxima of TE and TM polarized emission of 1−2 nm (about 18−36 meV). Also the calculations suggest a longer emission wavelength of the dominant polarization due to the energetic separation of E0(Γ7−) (TM) to E0(Γ9) and E0(Γ7+) (both TE), e.g. 55 meV (x = 0.59) and 110 meV (x = 0.47). However, the exact separation of the peaks is determined by the transition matrix elements and by localization effects.32) Such separation is not observed for the dominant TM polarized spectra. This might be explained by compositional fluctuation in the QW as described before. Regions with slightly lower aluminum mole fraction would exhibit a longer emission wavelength and a more TE polarized light emission. This leads to an increased TE emission on the long wavelength side of the emission peak, which counteracts the energetic separation between Γ7+ and Γ9.

Fig. 3. (Color online) In-plane polarization-resolved electroluminescence spectra of LEDs with varied aluminum composition (fractional numbers in the top right corner) in the QW and barriers (QB) separated into TE (solid red) and TM (dash-dotted blue) polarized emission and normalized to the total peak intensity (dashed gray).
Download figure:
Standard image High-resolution imageTo evaluate the degree of polarization DoP = (ITE – ITM)/(ITE + ITM) from the measurements, the TE (ITE) and TM (ITM) polarized light emission were integrated from the PL and EL spectra, respectively. The theoretical DoP is calculated from the overlap integrals of electron and hole wave functions, the interband momentum-matrix elements, and a population of the different valence bands determined by the Boltzmann distribution. Figure 4 summarizes the measured DoP as well as the theoretical DoP as a function of QW aluminum mole fraction. The theoretical DoP decreases continuously from +0.94 at x = 0.47 to −0.95 at x = 0.86 with the crossing point from TE to TM polarized light emission at x = 0.66. The DoP measured by PL decreases from +0.41 at x = 0.56 to −0.63 at x = 0.90 with the crossing point from TE to TM polarized emission at around x = 0.68. The relatively low DoP of +0.3 for x = 0.48 is most likely related to partial relaxation of the active region. The DoP measured by EL decreases continuously from +0.74 at x = 0.47 to −0.70 at x = 0.86 with the crossing point from TE to TM polarized emission at x = 0.68. This matches the results from PL measurements very well. In comparison to the k·p calculation the transition from dominant TE to dominant TM polarized light emission evaluated from EL and PL is at slightly higher aluminum mole fraction in the QW. The discrepancy is most likely attributed to localization effects in Ga rich regions which influence the optical polarization, as it was observed for non-polar and semi-polar InGaN/GaN QWs.32) Additionally, the absolute value of the measured DoP is smaller in comparison to the simulations for strongly TE (x < 0.56) and strongly TM (x > 0.80) polarized emission. We attribute this discrepancy of the DoP to light scattering at the cleaved facets of the samples, the voids in the ELO AlN/sapphire template, and scattering at the substrate backside. Scattering reduces the DoP and limits the maximum absolute measureable value of the DoP.

Fig. 4. (Color online) Degree of polarization (DoP) as a function of the aluminum mole fraction in the QW evaluated by electroluminescence (violet circles), photoluminescence (orange squares) and k·p calculations (dashed green). The error bars represent the standard deviation of the measured value and the underestimation of this value by 20% due to light scattering processes.
Download figure:
Standard image High-resolution image3.3. Light extraction efficiency
As reported by Ref. 4 the maximum on-wafer EQE of AlxGa1-xN/AlyGa1-yN MQW LEDs decreases by three orders of magnitude with decreasing emission wavelength from λ = 239 nm to λ = 217 nm. The same trend is observed in this study. The on-wafer EQE (same wafer as used for polarization-resolved EL measurements) measured through the bottom of the substrate of the LEDs at 20 mA drops from 0.6% for λ = 264 nm (x = 0.47) to 0.00013% for λ = 220 nm (x = 0.86). In order to determine the influence of the LEE on the observed EQE drop, Monte–Carlo ray-tracing simulations have been performed. Therefore, the measured DoP values were used, but corrected with a factor of 1.25 in order to consider the underestimation of the DoP as described in the previous section. The choice of this correction factor is based on ray-tracing simulations showing the absolute value of the DoP, as measured from the cleaved mesa, is reduced by 20%.
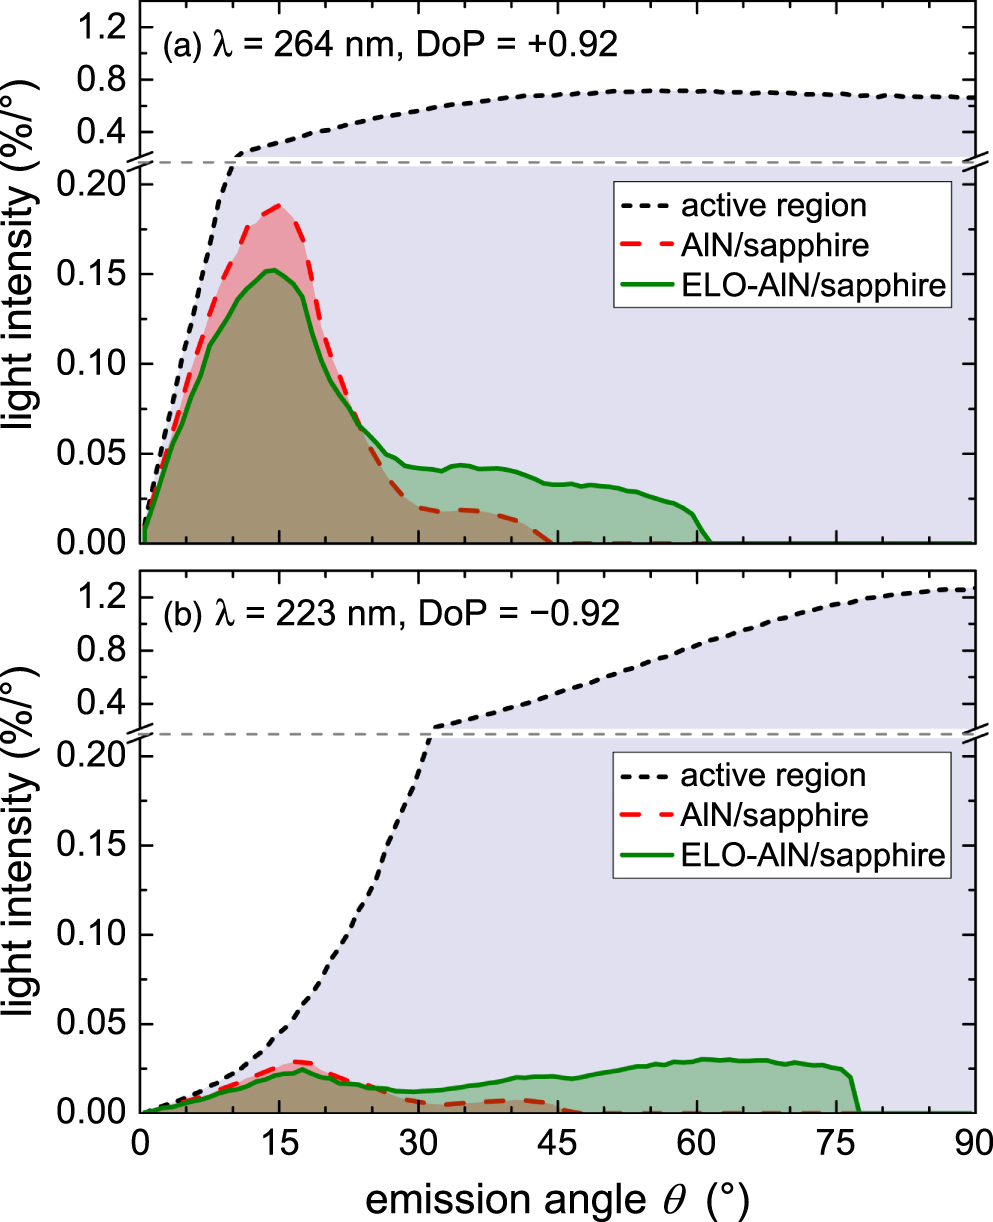
Figure 5(a) shows the simulated extracted light intensity distribution of a 264 nm LED with DoP = +0.92 as a function of emission angle θ (0° is perpendicular to the c-plane) and Fig. 5(b) the same for a 223 nm LED with DoP = −0.92. Light extraction from LEDs with a planar AlN/sapphire interface (red dashed line) and a patterned ELO AlN/sapphire interface (green line) are considered and compared to the total light intensity distribution emitted from the active region (black dotted line). Note, that all shown distributions include the sin(θ) term for spherical coordinates. This term results in a singularity at θ = 0° but allows an interpretation of the integrated area under the curve as the LEE. For a 264 nm LED with dominant TE polarized emission as shown in Fig. 5(a), the radiation is mainly directed parallel to the c-axis. The emission distribution in the active region increases strongly with increasing emission angle and reaches a nearly constant value of 0.7%/° for θ > 40°. For a smooth interface the light escape cone from sapphire to air would be limited to θ = 33° due to the refractive index differences. However, because of the multiple refractive index changes within the heterostructure (e.g., active region/n-AlGaN/AlN/sapphire), the light escape cone is reduced to θ = 23°. In reality, due to a rough sapphire/air interface, the escape cone is smeared out which leads to a decreased light extraction for θ < 23° and to an increased light extraction for 23° < θ < 43° with a LEE of 3.5%. In case of the ELO AlN/sapphire interface, additional light scattering occurs at the ELO voids within the heterostructure. This reduces the light extraction for θ < 23° in comparison to planar AlN/sapphire but increases the light extraction for 23° < θ < 62° with a LEE of 4%. As can be seen from the simulated LEE values, the influence of the ELO pattern is not very strong for dominant TE polarized light since a major portion of the light is emitted parallel to the c-axis. For a dominant TM polarized 223 nm LED [Fig. 5(b)] with a doughnut shaped emission pattern, the emission distribution in the active region is relatively low for small emission angles, increases continuously with increasing emission angle and reaches a maximum of 1.3%/° at θ = 90°. In case of planar AlN/sapphire interface, the emission angle distribution is similar to the TE polarized LED but with significantly lower total light intensity due to changes in the radiation pattern of the active region. The LEE is then strongly reduced to 0.4%. Again, in case of ELO AlN/sapphire interface, additional light scattering occurs at the ELO voids which reduces the light extraction for θ < 23° in comparison to planar AlN/sapphire but increases the light extraction for 23° < θ < 77° with a LEE of 1.5%. The effect of increased light extraction at larger angles is strongly increased in comparison to LEDs with a dominant TE polarized emission. This originates from the TM polarized radiation pattern of the active region which is mainly perpendicular to the c-axis and increases the probability of light scattering at the ELO voids. The result of a comparably small reduction of the LEE from 4.0% (dominant TE) to 1.5% (dominant TM) is also comparable to finite-difference time-domain simulations reported by Ref. 6, where the LEE changes from 6% (TE) to 2.5% (TM) for patterned AlGaN templates.

Fig. 5. (Color online) Simulated extracted light intensity distribution as a function of the emission angle (0° = perpendicular to the c-plane) in case of planar AlN/sapphire interface (red dashed) and ELO AlN/sapphire interface (green) for the 264 nm LED with dominant TE polarized emission (a) and the 223 nm LED with dominant TM polarized emission (b). In addition, the light intensity distribution emitted in the active region is shown (black dotted).
Download figure:
Standard image High-resolution imageFigure 6 shows the measured on-wafer EQE at 20 mA as well as the simulated on-wafer LEE of LEDs with an emission wavelength of 264 nm > λ > 220 nm considering the ELO AlN/sapphire interface, the corrected DoP and the emission wavelengths of the individual LEDs. Based on this information the product of radiative recombination efficiency (RRE) and the charge carrier injection efficiency (CIE) was then calculated from the quotient of EQE and LEE and plotted in the same graph. For the LEDs with an emission wavelength between 264 and 239 nm, the LEE decreases from 4.0% (λ = 264 nm) to 2.9% (λ = 239 nm) due to the change from dominant TE to unpolarized emission. In this wavelength range, the EQE decreases from 0.6% (λ = 264 nm) to 0.3% (λ = 239 nm), which can be therefore partially attributed to the decreasing LEE. For LEDs with an emission wavelength shorter than 239 nm, the LEE decreases from 2.9% (λ = 239 nm) to 1.5% (λ = 220 nm) due to the change from unpolarized to dominant TM polarized emission but relatively large due to the scattering mechanisms at the ELO voids. However, the EQE for this short emission wavelength range decreases dramatically from 0.3% (λ = 239 nm) to 0.00013% (λ = 220 nm). Therefore, we conclude that the decrease of the EQE over several orders of magnitude from λ = 239 nm to λ = 220 nm cannot be attributed only to a decreasing LEE but also to a significant reduction in CIE and RRE.

Fig. 6. (Color online) Measured on-wafer EQE (orange diamonds), simulated on-wafer LEE (green circles) detected by a virtual 1 cm2 photo detector located 3.5 mm below the wafer, and corresponding product of radiative recombination efficiency (RRE) and CIE (magenta triangles) as a function of the measured emission wavelength.
Download figure:
Standard image High-resolution image
4. Conclusions
In conclusion, the influence of the aluminum mole fraction of AlxGa1-xN/AlyGa1-yN MQWs on the optical polarization, LEE and EQE of LEDs in the wavelength range between λ = 264 nm (x = 0.47) and 220 nm (x = 0.86) was investigated by k·p calculations, polarization-resolved PL and EL measurements as well as ray-tracing simulations. The DoP was measured and calculated for 1 nm thin AlGaN QWs stained to ELO AlN/sapphire and a constant bandgap difference between the QWs and barriers of 325 meV. The DoP decreases with increasing the aluminum mole fraction in the MQW and decreasing emission wavelength showing good agreement between calculation and both measurement methods. While the calculation shows a TE/TM crossing (DoP = 0.0) at x = 0.66, PL and EL show a crossing at x = 0.68 (λ = 239 nm)—the small difference was attributed to localization effects. The on-wafer EQE decreases from 0.6% (λ = 264 nm) to 0.00013% (λ = 220 nm), while the ray-tracing simulations show a reduction of the on-wafer LEE from 4% (λ = 264 nm) to 1.5% (λ = 220 nm). Therefore we attribute the dramatic drop of the EQE in this wavelength range to be dominated by a reduced CIE and RRE rather than the LEE. Further investigations to study the effects on CIE and RRE are in progress.
Acknowledgments
The authors would like to thank Sylvia Hagedorn (Ferdinand-Braun-Institut, Leibniz-Institut für Höchstfrequenztechnik, Berlin, Germany) for providing the ELO AlN/sapphire templates. This work was partially supported by the German Federal Ministry of Education and Research (BMBF) within the "Advanced UV for life" project and by the Deutsche Forschungsgemeinschaft (DFG) within the Collaborative Research Centre "Semiconductor Nanophotonics" (SFB 787).