


Abstract
H2O2 is part of Europa's water-ice radiolytic cycle and a potential source of oxidants to Europa's subsurface ocean. However, factors controlling the concentration of this critical surface species remain unclear. Though laboratory experiments suggest that Europa's H2O2 should be concentrated in the coldest, most ice-rich regions toward the poles, Keck adaptive optics observations have shown the strongest H2O2 signatures in comparatively warm, salt-bearing terrain at low latitudes. As a result, it was suggested that the local non-ice composition of these terrains—particularly hypothesized enrichments of CO2—may be a more dominant control on H2O2 than temperature or water-ice abundance. Here we use observations of Europa from the NASA Infrared Telescope Facility, Keck Observatory, and JWST to disentangle the potential effects of temperature and composition. In order to isolate the effect of temperature on Europa's H2O2, we use the ground-based observations to assess its response to temperature changes over timescales associated with Europa's daily eclipse and diurnal cycle. We use JWST Cycle 1 data to look for any geographic correlation between Europa's H2O2 and CO2. Changes in Europa's 3.5 μm H2O2 absorption band both from pre- to post-eclipse and across a local day suggest minimal effects of the local temperature on these timescales. In contrast, the JWST observations show a strong positive correlation between Europa's H2O2 and CO2 bands, supporting the previously suggested possibility that the presence of CO2 in the ice may enhance H2O2 concentrations via electron scavenging.

Original content from this work may be used under the terms of the Creative Commons Attribution 4.0 licence. Any further distribution of this work must maintain attribution to the author(s) and the title of the work, journal citation and DOI.
1. Introduction
Hydrogen peroxide (H2O2) is a product of the important water-ice radiolytic cycle on Europa and was first detected by the Galileo Near-Infrared Mapping Spectrometer (NIMS) via a prominent absorption band at 3.5 μm (R. W. Carlson et al. 1999). The continuous bombardment of Europa's surface by electrons, protons, and ions from the Jovian magnetosphere leads to the dissociation of water molecules and the recombination of the fragments to form H2O2, molecular oxygen (O2), and thus an oxidized surface environment (O. Bain & P. A. Giguère 1955; R. E. Johnson & T. I. Quickenden 1997; R. W. Carlson et al. 1999; P. D. Cooper et al. 2003; R. E. Johnson et al. 2003; M. Loeffler et al. 2006; R. W. Carlson et al. 2009). Surface oxidants such as H2O2, if transported through Europa's ice shell, could interact with ocean water that is potentially reduced by hydrothermal processes at the seafloor. Such mixing could create a redox potential, providing a viable chemical energy source for Europa's interior ocean (C. F. Chyba 2000; K. P. Hand et al. 2006; K. P. Hand et al. 2009; M. A. Pasek & R. Greenberg 2012). Understanding what controls H2O2 can affect our understanding of its stability and how likely it is to get recycled into the interior. It also has implications for the production and stability of related radiolysis products, such as O2 (P. D. Cooper et al. 2003), that are produced by the same or similar processes but are harder to observe. H2O2, O2, and H2 formation from ion- and electron-irradiated water ice is expected to be a common radiation chemistry pathway throughout the outer solar system.
Laboratory spectral measurements and irradiation experiments have been used to understand the radiolysis and photolysis of water ice, including the production and destruction of H2O2 (e.g., R. E. Johnson & T. I. Quickenden 1997; M. Moore & R. Hudson 2000; M. Loeffler et al. 2006; T. Cassidy et al. 2010; K. P. Hand & R. W. Carlson 2011). In addition to water ice and sufficient irradiation being essential precursors for H2O2 formation, irradiation experiments have also shown an inverse relationship between the equilibrium abundances of H2O2 and the ice temperature (M. Moore & R. Hudson 2000; M. Loeffler et al. 2006; W. Zheng et al. 2006; K. P. Hand & R. W. Carlson 2011). Thus, it was expected that Europa should have an enrichment of H2O2 in colder, more ice-rich regions, compared to a more minimal presence in warmer, less ice-rich regions (K. P. Hand & R. W. Carlson 2011).
However, contrary to the laboratory predictions, recent Keck adaptive optics (AO) observations of Europa's 3.5 μm H2O2 absorption feature across its leading hemisphere showed enhanced H2O2 in geologically young, low-latitude chaos terrains characterized by lower water-ice abundance (M. E. Brown & K. P. Hand 2013; P. D. Fischer et al. 2015, 2016), warmer temperatures (J. A. Rathbun et al. 2010; S. K. Trumbo et al. 2018), and a notable enrichment of sodium chloride (NaCl; S. K. Trumbo et al. 2019b, 2022). This observation finds contradictory results on the effects of both water-ice availability and temperature. While the findings indicate that temperature is not the dominant factor, it remains uncertain whether temperature plays a role at all in governing Europa's H2O2.
In fact, the distribution suggests that the underlying composition of the chaos terrain exerts a stronger control on H2O2 abundance. Thus, the authors hypothesized that carbon dioxide (CO2) may be enhanced in these same terrains (S. K. Trumbo et al. 2019a), where it may act to enhance H2O2 concentrations by inhibiting the breakdown of newly formed H2O2 by consuming the destructive electrons produced as the ice continues to be irradiated (M. Moore & R. Hudson 2000)—an effect supported at the time by only limited laboratory data (M. Moore & R. Hudson 2000; G. Strazzulla et al. 2005) and unpublished Galileo NIMS spectra (R. W. Carlson 2001). However, this hypothesis remains untested owing to the lack of reliable CO2 mapping on Europa and the inability to observe it from the ground, leaving the effects of temperature and composition on Europa's H2O2 largely unresolved.
To further investigate the effects of temperature and CO2 on Europa's H2O2 concentrations, we analyze a combination of ground- and space-based observations of Europa's H2O2 from the the NASA Infrared Telescope Facility (IRTF), Keck Observatory, and JWST. Using IRTF/SpeX, we take disk-integrated observations of Europa's 3.5 μm H2O2 absorption before and after eclipse, which preserves approximately the same geometry across a large temperature change, enabling a largely controlled test of possible temperature effects. To examine the reaction of H2O2 to temperature fluctuations across longer, diurnal timescales, we present spatiotemporally resolved observations across Europa's day acquired using the Keck II telescope's Near InfraRed Spectrograph (NIRSPEC) and AO system. Finally, we use spatially resolved JWST Cycle 1 NIRSpec observations of Europa, which simultaneously span wavelengths sensitive to both H2O2 and CO2, to search for the previously hypothesized correlation between these two species.
2. Observations and Data Reduction
2.1. Disk-integrated Pre- and Post-eclipse IRTF/SpeX Observations
To disentangle the effect of temperature on Europa's H2O2 from that of composition, we designed a controlled temperature experiment using disk-integrated spectra obtained in 1 hr windows across 2 hr pre-eclipse and 6 hr post-eclipse with IRTF/SpeX (J. T. Rayner et al. 2003) across several dates with similar eclipse windows in 2018. The SpeX data obtained span a wavelength range of 1.68–4.23 μm with R ∼ 2000. Dates, time, and geometries are given in Table 1.
Table 1. Table of Observations
| Date | Telescope | Hemisphere | Slit Orientation | Air Mass Range | Integration | Central Longitude | Central Latitude | Star Calibrator |
|---|---|---|---|---|---|---|---|---|
| (UT) | (minutes) | |||||||
| 2018 Mar 29 | IRTF/Spex | Sub-Jovian a | Disk-integrated | 1.3 | 32 | 345 W | 4 S | HD 140990 |
| 2018 Mar 29 | IRTF/Spex | Sub-Jovian b | Disk-integrated | 1.3–1.4 | 48 | 348 W | 4 S | HD 140990 |
| 2018 May 11 | IRTF/Spex | Sub-Jovian c | Disk-integrated | 1.2–1.3 | 32 | 11 W | 4 S | HD 128596 |
| 2018 May 11 | IRTF/Spex | Sub-Jovian d | Disk-integrated | 1.2 | 40 | 14 W | 4 S | HD 128596 |
| 2018 Jun 30 | IRTF/Spex | Sub-Jovian e | Disk-integrated | 1.2 | 8 | 29 W | 4 S | HD 128597 |
| 2018 Jun 30 | IRTF/Spex | Sub-Jovian f | Disk-integrated | 1.2 | 43 | 31 W | 4 S | HD 128597 |
| 2018 Jun 30 | IRTF/Spex | Sub-Jovian g | Disk-integrated | 1.2–1.3 | 33 | 36 W | 4 S | HD 128597 |
| 2018 Jun 30 | IRTF/Spex | Sub-Jovian h | Disk-integrated | 1.3–1.5 | 38 | 39 W | 4 S | HD 128597 |
| 2013 Dec 29 | Keck AO | Anti-Jovian | E/W | 1.0–1.2 | 40 | 195 W | 3 N | HD 54371 |
| 2013 Dec 29 | Keck AO | Anti-Jovian | E/W | 1.1 | 20 | 195 W | 25 S | HD 54372 |
| 2016 Feb 24 | Keck AO | Trailing/sub-Jovian | E/W | 1.5–1.7 | 40 | 334 W | 2 S | HD 98947 |
| 2016 Feb 24 | Keck AO | Trailing/sub-Jovian | E/W | 1.2–1.3 | 40 | 338 W | 0 N | HD 98947 |
| 2016 Feb 24 | Keck AO | Trailing/sub-Jovian | E/W | 1.0–1.1 | 40 | 342 W | 1 S | HD 98947 |
| 2016 Feb 24 | Keck AO | Sub-Jovian | N/S | 1 | 40 | 350 W | 2 S | HD 98947 |
| 2016 Feb 24 | Keck AO | Sub-Jovian | N/S | 1 | 40 | 348 W | 2 S | HD 98947 |
| 2016 Feb 25 | Keck AO | Leading | E/W | 1.2–1.4 | 40 | 79 W | 0 S | HD 98947 |
| 2016 Feb 25 | Keck AO | Leading | E/W | 1.1–1.2 | 40 | 82 W | 12 S | HD 98947 |
| 2016 Feb 25 | Keck AO | Leading | N/S | 1.0–1.1 | 40 | 88 W | 2 S | HD 98947 |
| 2016 Feb 25 | Keck AO | Leading | E/W | 1.1 | 40 | 95 W | 0 N | HD 98947 |
| 2018 Jun 06 | Keck AO | Leading | E/W | 1.5 | 20 | 115 W | 7 S | HD 128596 |
| 2018 Jun 06 | Keck AO | Leading | N/S | 1.4 | 10 | 120 W | 5 S | HD 128596 |
| 2018 Jun 06 | Keck AO | Leading | N/S | 1.4 | 10 | 126 W | 5 S | HD 128596 |
| 2018 Jun 06 | Keck AO | Leading/anti-Jovian | N/S | 1.2–1.3 | 20 | 171 W | 2 S | HD 128596 |
| 2018 Jun 06 | Keck AO | Leading/anti-Jovian | N/S | 1.2–1.3 | 20 | 150 W | 2 S | HD 128596 |
| 2018 Jun 06 | Keck AO | Leading/anti-Jovian | N/S | 1.3 | 10 | 166 W | 1 S | HD 128596 |
| 2018 Jun 06 | Keck AO | Leading | N/S | 1.2 | 15 | 113 W | 4 S | HD 128596 |
| 2018 Jun 06 | Keck AO | Leading | N/S | 1.2–1.3 | 20 | 100 W | 6 S | HD 128596 |
| 2018 Jun 06 | Keck AO | Leading | N/S | 1.3 | 20 | 82 W | 3 S | HD 128596 |
| 2018 Jun 06 | Keck AO | Leading | E/W | 1.3–1.4 | 20 | 131 W | 1 S | HD 128596 |
| 2018 Jun 07 | Keck AO | Trailing | E/W | 1.2–1.3 | 40 | 222 W | 4 S | HD 128596 |
| 2021 Sep 24 | Keck AO | Trailing | E/W | 1.2–1.4 | 60 | 275 W | 20 N | HD 203311 |
| 2021 Sep 25 | Keck AO | Trailing | N/S | 1.3–1.4 | 40 | 318 W | 8 N | HD 203311 |
| 2021 Sep 25 | Keck AO | Sub-Jovian/Leading | N/S | 1.3 | 40 | 41 W | 2 N | HD 203311 |
| 2022 Nov 23 | JWST | Leading | ⋯ | ⋯ | 21 | 93 W | 3 N | GSPC P330-E |
Notes.
a 2 hr pre-eclipse. b 1 hr pre-eclipse. c 1 hr post-eclipse. d 2 hr post-eclipse. e 3 hr post-eclipse. f 4 hr post-eclipse. g 5 hr post-eclipse. h 6 hr post-eclipse.Download table as: ASCIITypeset image
Depending on the exact thermal inertia of the surface materials, an eclipse leads to a sudden temperature drop of tens of degrees kelvin, while the satellite maintains approximately the same geometry as viewed from Earth (Figure 1(a)). As simple extrapolation from laboratory studies suggests that a ∼20 K temperature drop may increase the equilibrium band area of the H2O2 absorption by a factor of ∼4 (K. P. Hand & R. W. Carlson 2011), we assessed changes in Europa's H2O2 absorption band immediately before and after eclipse and throughout this recovery period to look for such a response. As Europa is tidally locked to Jupiter and experiences an eclipse of its sub-Jovian hemisphere every orbit, pre- and post-eclipse spectra taken on different dates are still sampling the same temperature drop and recovery (Table 1). Our data cover the wavelength range of ∼1.68–4.2 μm. For pre-eclipse observations, we observed HD 140990, a V = 7.85 G2V star with a 7 08 separation from Europa, as the telluric calibrator. For post-eclipse observations, we observed HD 128596, a V = 7.48 G2V star with a 245 separation from Europa, as the telluric calibrator.
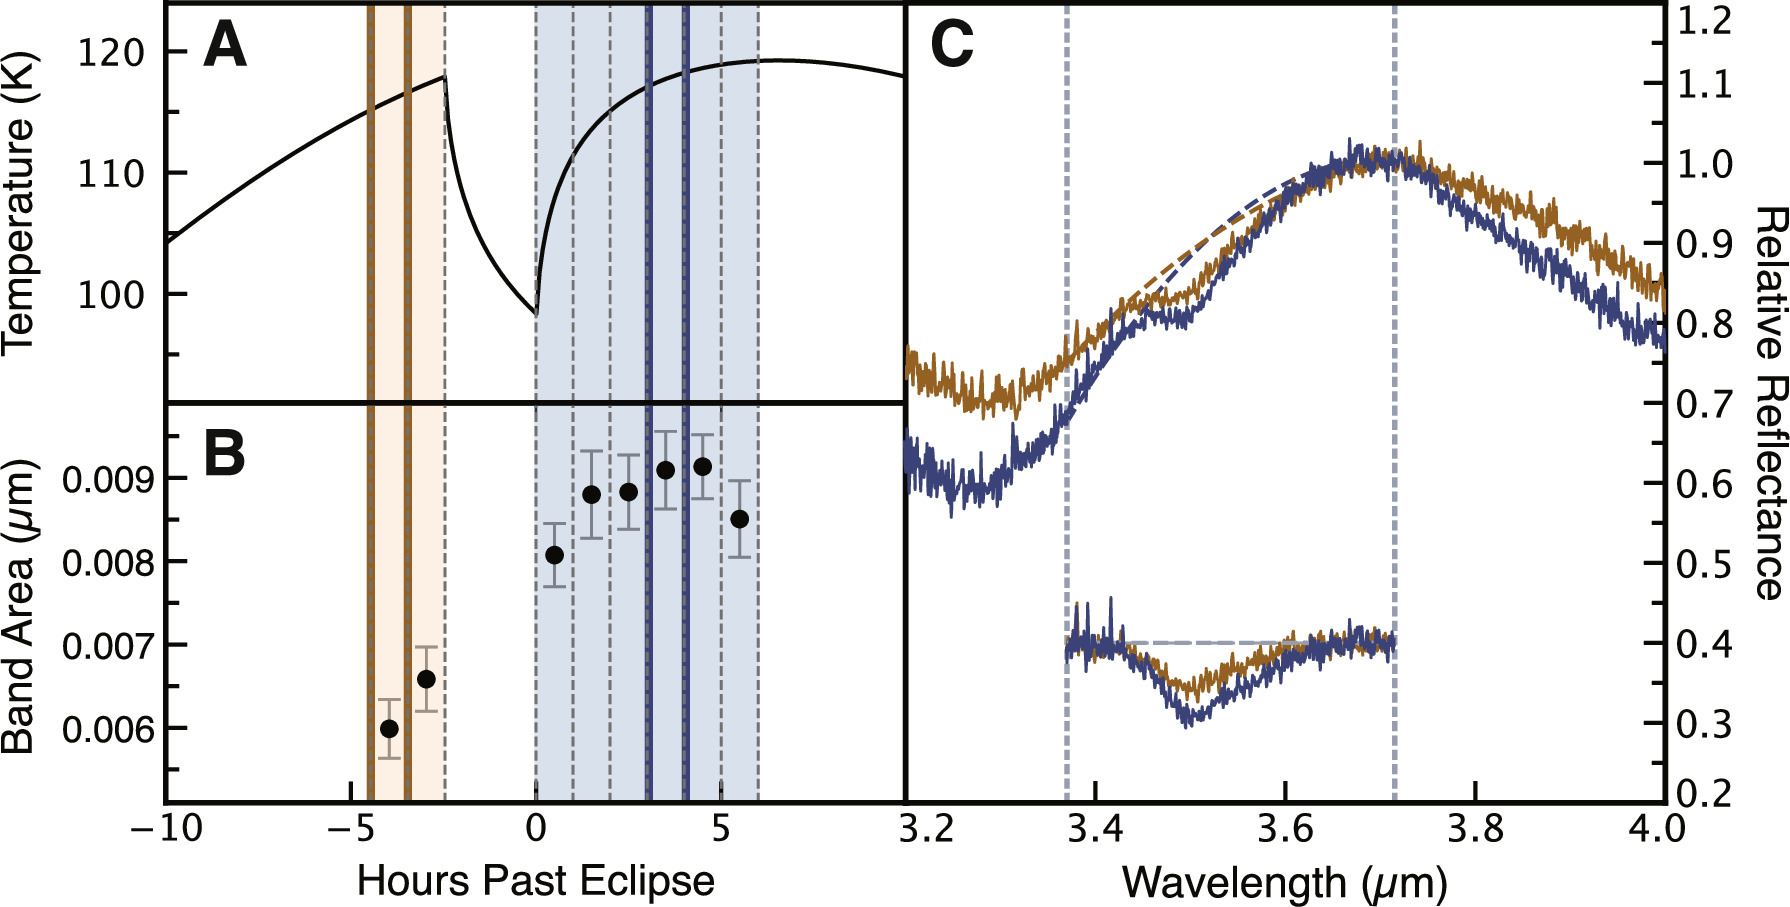
Figure 1. (a) The temperature of sub-Jovian Europa as it passes through eclipse. This temperature profile is based on the thermal model of S. K. Trumbo et al. (2017a). Sub-Jovian Europa was observed for 2 hr before eclipse and 6 hr after eclipse (no observations during eclipse owing to the lack of reflected light). The bottom of the drop indicates the end of eclipse. The sub-Jovian temperature takes ∼6 hr to recover from the estimated ∼20 K drop during eclipse. Spectra were averaged for each of the ∼1 hr time intervals. Orange indicates pre-eclipse observations, and blue indicates post-eclipse observations. (b) Integrated band area calculated for each ∼1 hr window. A factor of <2 change is observed both between the measurements immediately pre-eclipse and immediately post-eclipse and between the weakest 3.5 μm absorption at 2 hr pre-eclipse and the strongest 3.5 μm absorption 5 hr post-eclipse. This small change is attributable to rotation of Europa across this time period and rules out a strong response to the eclipse temperature drop (discussed in Section 3). As errors associated with the unknown background continuum dominate over those due to noise, we estimate error bars as the values given using a range of plausible continuum fits across the wavelength range from 3.33–3.37 μm to 3.715–3.78 μm. (c) Example IRTF/Spex spectra comparing the 3.5 μm absorption 2 hr pre-eclipse with the absorption 4 hr post-eclipse. The boundaries of the selected time windows are thick in panel (b). Dashed gray lines outline the H2O2 band. Second-order polynomial continua are indicated by the dashed curves of the same color as the spectra. Continuum-removed absorptions are included to ease comparison of the band strengths. The depth of the 3 μm water-ice absorption band (shown here as the 3.2–3.7 μm range following the Fresnel peak) appears to increase after eclipse (blue), suggesting a possible rotational effect as Europa rotates from a more trailing/sub-Jovian geometry toward a more sub-Jovian/leading geometry.
Download figure:
Standard image High-resolution imageWe used Spextool (Spectral Extraction TOOL), an interactive data language (IDL)–based data reduction package (M. Cushing et al. 2004), to reduce the IRTF/SpeX data. We followed the standard methodology of flat-field correction, image pair subtraction, target detection, spectra extraction, wavelength calibration, combination of multiorder spectra, and telluric correction (W. Vacca et al. 2003). Spectra from within each 1 hr window were merged into one single spectrum per window. We clipped out bad pixels and any highly variable telluric lines by comparing data points to the means of a 51-point window with a threshold of 0.01, as determined by manually inspecting the spectra so that only telluric lines and outliers are clipped. To further improve the signal-to-noise ratio, we then smoothed the spectra using a Savitzky–Golay filter with a window length of 5 data points and a polynomial order of 3.
Though the geometry was nearly identical between subsequent time windows, Europa did rotate ∼50° in longitude across the entire 8 hr of observation. To address this caveat, we used spatially resolved Keck AO observations of the sub-Jovian hemisphere to estimate the effects of small changes in observed band strength attributable to the minor amount of rotation in the eclipse experiment.
2.2. Spatially Resolved Keck AO Observations across Europa's Day
The creation and destruction of H2O2 on Europa exist in a dynamic equilibrium, and the timescale for response to a temperature perturbation is unknown. Indeed, the factor of ∼4 change in H2O2 band strength from laboratory studies mentioned above is a direct comparison of H2O2 band strengths in pure water ice at different temperatures irradiated until equilibrium concentrations were achieved (K. P. Hand & R. W. Carlson 2011), which is not directly translatable to Europa. Thus, we also evaluate the response of H2O2 to temperature variations across a longer timescale than eclipse by using Keck NIRSPEC and the AO system on the Keck II telescope to observe Europa's 3.5 μm H2O2 band throughout its day.
We observed the same locations on rotational timescales from 4 hr (comparable in time frame to Europa's eclipse recovery) to 29 hr (∼1/3 Europa day and equivalent to progression from morning to afternoon) and assessed their localized diurnal variability. In addition, we observed some locations that expand on past maps of the spatial distribution of Europa's H2O2 (S. K. Trumbo et al. 2019a). Observations used in this analysis were acquired in 2013, 2016, 2018, and 2021. Dates, times, and geometries are given in Table 1. We used the 3 96 × 0072 slit in low-resolution mode (R = 2000) across the L-band wavelengths of approximately 3.1–4 μm.
In 2013, we used HD 54371, a V = 7.1 G6V star at 32 separation from Europa, as the telluric calibrator. Each telluric calibrator pointing consisted of one 12–20 s coadd or two 15 s coadds. In 2016, we used HD 98947, a V = 6.9 G5 star at 12 separation from Europa, as the telluric calibrator. Each telluric calibrator pointing consisted of two 15 s coadds. In 2018, we used HD 128596, a V = 7.5 G2V star with a 39 separation from Europa. Each telluric calibrator pointing consisted of two 10 s coadds. In 2021, we used HD 203311, a V = 7.45 G2V star with a 515 separation from Europa. Each telluric calibrator pointing consisted of two 15 s coadds.
We obtained ephemeris data and viewing geometry from JPL Horizons. During the observations, Europa's apparent diameter was approximately 1'', translating to about 10 resolution elements (∼300 km resolution at the sub-observer point) at the diffraction limit of Keck at 3.5 μm. We shifted the pointing of targets between opposite ends along the slits in an AB, ABBA, or ABBAAB pattern, to enable pair subtraction during reduction. Corresponding slit-viewing camera (SCAM) images were acquired to ensure a consistent slit position across each observation set and to allow for later determination of the corresponding geographic coordinates on Europa.
Some of the observations displayed readout artifacts (artificial brightening of every 8 or 64 pixels in the dispersion direction), which we replaced with the mean of the two immediately adjacent pixels. Following the data reduction outlined in S. K. Trumbo et al. (2019a), we then used Python packages (astropy, T. P. Robitaille et al. 2013; A. M. Price-Whelan et al. 2018, 2022; scikit-image, S. van der Walt et al. 2014; scipy, P. Virtanen et al. 2020; cartopy, Met Office 2010-2015; astroquery, A. Ginsburg et al. 2019) in following the standard reduction steps of image rectification, flat-field correction, image pair subtraction, residual sky subtraction, spectra extraction, and telluric calibration. We used an ATRAN atmospheric transmission spectrum (S. D. Lord 1992) for wavelength calibration. The first several columns of the flat fields (separate from the target's location on the chip) were consistently unevenly illuminated, so we replaced the unilluminated edge with the mean of the adjacent illuminated window of the same width in pixels.
We extracted summed spectra in 8-pixel resolution elements, stepping by 4 spatial pixels. As with the IRTF spectra, we clipped out bad pixels and any highly variable telluric lines by comparing data points to the means of a 51-point window with a threshold adjusted for each observation. Spectra were then smoothed using a Savitzky–Golay filter with an optimal window length and a polynomial order of 3 to improve signal-to-noise ratio.
To estimate the coordinates of the slit on Europa and extract spectra for each resolution element, we aligned SCAM images to each NIRSPEC exposure. With detector resolutions of 0013 pixel−1 (pre-upgrade NIRSPEC), 0009 pixel−1 (updated NIRSPEC after 2018), 00168 pixel−1 (pre-upgrade SCAM), and 00149 pixel−1 (updated SCAM), we calculated the size of Europa in both NIRSPEC and SCAM pixels. We then located Europa in the 2D spectral images and estimated the coordinates of the slit by calculating the slit pixel offsets from Europa's center in the SCAM images. With the known NIRSPEC pixel scale, we determined the geographic coordinates of each resolution element. When combining individual exposures (from A and B nods), we account for small changes to the effective slit width that result from minor shifts in the pointing on Europa. We estimate the spatial uncertainty from our SCAM navigation procedure to be one SCAM pixel, which is much smaller than the ∼009 diffraction limit of Keck at 3.5 μm. We use the extracted coordinates to map the geographic distribution of the 3.5 μm H2O2 band. For overlapping regions, we averaged band strengths. We excluded data from limb pixels in the trailing-hemisphere slits, where the data quality was too poor to reliably measure the H2O2 band.
2.3. Spatially Resolved JWST Observation
As CO2 has been proposed as a potential factor enhancing H2O2 concentrations in chaos terrains (R. W. Carlson 2001; R. W. Carlson et al. 2009; S. K. Trumbo et al. 2019a), we assessed the correlation between the geographic distribution of Europa's H2O2 and CO2 using archival JWST NIRSpec data (from the Cycle 1 Guaranteed Time Observations program No. 1250) of Europa's leading hemisphere, observed on 2022 November 23 at 08:18 UT. The data we analyzed were obtained with the NIRSpec integral field unit, the high-resolution gratings (G235H and G395H, R = 2700), and the F170LP and F290LP filters at wavelengths of approximately 1.7–5.2 μm. Only Europa's leading hemisphere (sub-observer longitude of 93° west) was observed during this program. We used a spectrum of GSPC P330-E (Program 1538; K. D. Gordon et al. 2022), a G0V star, as a solar analog. We followed the same data reduction steps as in S. K. Trumbo & M. E. Brown (2023) and S. K. Trumbo et al. (2023) for both the Europa data and the stellar data, and we extracted spectra corresponding to each 01 × 01 spatial pixel on Europa.
2.4. Band Strength Calculation
To assess the response of Europa's H2O2 to temperature changes and its potential correlation with CO2, we measure the strength of the 3.5 μm H2O2 feature in all extracted spectra from IRTF, Keck, and JWST. For all spectra, we excluded the absorption feature itself (3.4–3.65 μm) before fitting a second-order polynomial across the wavelength range of 3.37–3.715 μm. Each fit was visually inspected, and minor adjustments were made as needed to ensure an optimal fit to the continuum. We then divided the fitted continuum from each spectrum to isolate the absorption feature. Band areas (i.e., equivalent widths) were calculated by integrating the area of the residual absorption.
CO2 displays three signatures in the JWST data: a narrow band near 2.7 μm and two minima within the ν3 band at ∼4.25 and 4.27 μm (G. L. Villanueva et al. 2023; S. K. Trumbo & M. E. Brown 2023). To assess the correlation with our H2O2 measurements, we used published band areas of the ν3 band from S. K. Trumbo & M. E. Brown (2023), separately calculated the band depths of each ν3 minimum relative to the continua fit by those authors, and calculated the area of the 2.7 μm band by simply fitting and removing a linear continuum. We excluded some pixels close to Europa's limb that appeared particularly affected by flux oscillation artifacts resulting from the instrument's undersampling of the point-spread function. These oscillations significantly impact areas where Europa's signal changes rapidly (S. K. Trumbo & M. E. Brown 2023). Oscillations affected the measurement of the 3.5 μm H2O2 feature in more pixels than that of the CO2 feature, which resulted in the exclusion of a few more pixels than in S. K. Trumbo & M. E. Brown (2023).
3. Pre- and Post-eclipse H2O2 Measurements
To isolate the effect of temperature on Europa's H2O2 from those of composition or geography, we measure the 3.5 μm H2O2 band on Europa's sub-Jovian hemisphere across a 2 hr period before eclipse and across a 6 hr period following the conclusion of its daily eclipse. Using the thermal model of S. K. Trumbo et al. (2017b) and the best-fit thermal inertia value (60 J/(m2 K s1/2)) found in S. K. Trumbo et al. (2018) from Atacama Large Millimeter/submillimeter Array (ALMA) observations of the sub-Jovian hemisphere, we estimate an expected ∼20 K temperature drop across eclipse and a recovery to pre-eclipse temperatures that span the 6 hr post-eclipse period across which we observed (Figure 1(a)).
K. P. Hand & R. W. Carlson (2011) irradiated pure water ice with 10 keV electrons at temperatures of 80, 100, and 120 K and monitored the change in H2O2 band absorption until equilibrium concentrations were achieved at flux levels of ∼1019 eV cm−2. The authors' measured equilibrium H2O2 band area at 120 K is approximately a factor of 4 weaker than the measured equilibrium H2O2 band area at 100 K and a factor of 6 weaker than the measured equilibrium H2O2 band area at 80 K. This laboratory result is consistent with the expected increased mobility of OH with increasing temperature (T. I. Quickenden et al. 1991; R. E. Johnson & T. I. Quickenden 1997; M. Loeffler et al. 2006; K. P. Hand & R. W. Carlson 2011). However, it is worth noting that the magnitude of temperature effects seen in laboratory studies varies, with some experiments (e.g., O. Gomis et al. 2004; M. Loeffler et al. 2006; W. Zheng et al. 2006) observing smaller changes in H2O2 concentration than K. P. Hand & R. W. Carlson (2011) and some modeling work predicting smaller effects as well (B. D. Teolis et al. 2017). Nevertheless, taking the most simplistic extrapolation from these experiments, we might expect up to a factor of 4 increase in our observed H2O2 band area immediately after the ∼20 K eclipse temperature drop and then a slow decrease of the absorption band as the temperature climbs back up toward pre-eclipse values.
In Figure 1(b), we plot H2O2 band areas of the averaged spectra from each 1 hr time window surrounding the eclipse, where the error bars are estimated by varying the continuum fits across the wavelength range from 3.33–3.37 μm to 3.715–3.78 μm. The unknown true continuum presents a larger source of error than noise, but our error bars are still far smaller than the large increases in band strength we seek to detect. All of the spectra used to derive the band areas in Figure 1 are included in Figure A1. We find that our data clearly rule out such a dramatic increase in the H2O2 band following eclipse, instead exhibiting only a small 22.6% change (factor of 1.23) between the measurements immediately pre-eclipse and immediately post-eclipse and a 38.7% change (factor of 1.53) between the weakest 3.5 μm absorption at 2 hr pre-eclipse and the strongest 3.5 μm absorption at 5 hr post-eclipse.
It is possible that this small change does reflect a delayed response to the eclipse temperature drop resulting from the unknown timescale needed for Europa's surface H2O2 concentrations to re-equilibrate. However, the 2 and 3 μm water-ice absorption bands also appear to change following the eclipse and across the recovery period, which suggests that Europa's small degree of rotation from the slightly less icy trailing/sub-Jovian geometry pre-eclipse (central longitude = 348° west) toward a slightly more icy sub-Jovian/leading geometry (central longitude = 36° west) by 5 hr post-eclipse needs to be considered as well. Our spatially resolved Keck observation across the sub-Jovian hemisphere suggests up to a factor of ∼2.1 increase in H2O2 band strength as the longitude shifts from 352° west to 33° west. Thus, the small change (factor <2) of H2O2 band strength following eclipse could be reasonably attributed to the ∼50° of rotation of Europa surrounding eclipse, and our eclipse experiment reveals no clear evidence for any response of Europa's H2O2 to the temperature changes across eclipse, let alone the large factors seen in laboratory experiments. However, it is possible that the unknown time it would take Europa's H2O2 to re-equilibrate following such a perturbation is longer than the eclipse experiment allowed.
4. Keck H2O2 Diurnal Variability
While we find no clear effect of temperature in our IRTF eclipse experiment, the laboratory data that see strong differences in H2O2 with temperature represent a direct comparison of equilibrium concentrations (e.g., K. P. Hand & R. W. Carlson 2011), which may not have been reached across the eclipse timescale. For this reason, we also use Keck NIRSPEC AO observations to look for variability in Europa's H2O2 over longer, diurnal timescales. In particular, we examine slits oriented in an east/west direction that cover the same surface regions at different times of the local day. As noted above, K. P. Hand & R. W. Carlson (2011) suggest that equilibrium abundances of H2O2 can vary by a factor of 4 across the 100–120 K temperature range relevant to Europa and that H2O2 can be destroyed during the day in equatorial regions and produced efficiently at night across the surface, such that higher H2O2 concentration might be expected in the early morning as opposed to in the warm afternoon.
During our 2016 and 2018 observations, we purposely aligned slits taken on adjacent nights to investigate the hypothesized diurnal variability of H2O2. We examine five east–west slit pairs centered within ±20° of the equator, spanning a timescale of 20–29 hr—approximately one-quarter to one-third of a Europa day—and covering the temperature progression from morning to afternoon. Similar to what we see from the eclipse experiment, the changes in integrated band area from morning to afternoon appear to be much smaller than the equilibrium variations observed in the lab and instead range from −32% to 30% (factor of 0.68–1.3), with no clear or consistent trend attributable to diurnal variability.
As a representative example, in Figure 2 we compare spectra of the same location (186 west, 0.4° north) observed in the morning (cold temperatures) and afternoon (warmer temperatures) of 2016 February. Using the thermal model of S. K. Trumbo et al. (2017a) and a thermal inertia of 60 J/(m2 K s1/2) suggested by ALMA observations of the sub-Jovian hemisphere (S. K. Trumbo et al. 2018) and consistent with thermal inertia values estimated from the Galileo Photopolarimeter-Radiometer (PPR) observations (J. R. Spencer et al. 1999; J. A. Rathbun et al. 2010), we estimate a corresponding ∼12 K temperature increase over a ∼24 hr timescale for this location. We observe only a minimal change (−3.1%) in the integrated H2O2 band areas for this location, and, indeed, the entirety of the overlapping portions of the two slits appear consistent. All of the overlapping E/W slit positions we inspect are presented in Figure A2.

Figure 2. (a) Example Keck NIRSPEC slit obtained on 2016 February 24, when 186 west (labeled with the black circle) is in the morning (∼13 hr prior to local noon in Europa's ∼85 hr day, estimated ∼103 K). (b) Example Keck NIRSPEC slit obtained on 2016 February 25, when the same region (185 west; labeled with the red circle) is in the afternoon (∼16 hr after local noon in Europa's ∼85 hr day, estimated ∼115 K). (c) Corresponding reflectance spectra for this location in the morning (in black) and in the afternoon (in red). Dashed gray lines outline the H2O2 band. Second-order polynomial continua are indicated by the dashed curves of the same color as the spectrum. Continuum-removed absorptions are included and show nearly overlapping absorptions. A ∼12 K temperature increase over 24 hr is estimated from the thermal model of S. K. Trumbo et al. (2017a). This temperature change results in a negligible −3.1% change in the integrated band areas. Leading chaos regions are outlined in black (E. J. Leonard et al. 2024). Background basemap credit: USGS (2002).
Download figure:
Standard image High-resolution imageTo expand on this analysis, we also assess two east/west slit pairs observed over a timescale of 4 and 16 hr between 2013 and 2018 (rather than subsequent nights) in our larger data set (Figure A2). We observe only minimal changes in integrated band areas from −0.24% to 0.44% (factor of 0.76–1.44). We also note that there appears to be some evidence for stochastic H2O2 variability between years, as noted in S. K. Trumbo et al. (2019a), where the bands observed in 2016 are overall stronger than in later years (Figure A2). We suggest that this could be related to potential variability of the dynamic radiation environment.
The lack of a strong or consistent diurnal trend, along with the minimal changes observed across eclipse, suggest that Europa's H2O2 is largely insensitive to the temperature fluctuations that it experiences on a daily basis. Thus, our results indicate that, in addition to temperature not influencing the spatial variations of Europa's H2O2, temperature also appears not to drive strong temporal variations. We discuss this apparent discrepancy with laboratory work further in Section 7.
5. Keck H2O2 Mapping
In addition to suggesting that diurnal temperature changes do not strongly control Europa's H2O2, the Keck observations provide additional spatial coverage of Europa's surface compared to past maps of H2O2 (S. K. Trumbo et al. 2019a). In Figure 3, we present maps of H2O2 band area composed of east/west-oriented and north/south-oriented slits from 2013, 2016, 2018, and 2021, which include additional coverage beyond the previous maps. We separated out coverage of the leading and trailing hemispheres for clarity and to highlight the longitudinal variation along the two included anti-Jovian E/W slits. Overall, the updated distribution agrees well with the trends shown by S. K. Trumbo et al. (2019a).

Figure 3. Mapped Keck NIRSPEC slits from our 2013, 2016, 2018, and 2021 observations on the (a) leading and (b) trailing hemispheres, which show the spatial distribution of Europa's 3.5 μm H2O2 band. Consistent with full-disk spectra (K. P. Hand & M. E. Brown 2013) and previous spatially resolved spectra (S. K. Trumbo et al. 2019a), the geologically young chaos regions on the leading hemisphere (outlined in black; E. J. Leonard et al. 2024) exhibit the largest H2O2 features. In contrast, the trailing hemisphere demonstrates generally much weaker absorptions compared to the leading hemisphere and a depletion of H2O2 west of the anti-Jovian point around 210° west, corresponding to a gap between the large-scale chaos regions of the leading and trailing hemispheres. We note that observations from various years are mapped together to illustrate the updated coverage of Europa's H2O2, despite some apparently stochastic fluctuations in H2O2 between 2016 and later years. Background basemap credit: USGS (2002).
Download figure:
Standard image High-resolution imageOur maps present a clear difference between low-latitude chaos and low-latitude plains terrain in east/west slits crossing the leading chaos regions (Figures 2(b), 3(a), A2(a)–(d)) and a north/south slit just east of Tara Regio (∼85° west; Figure 3(a)) shows overall weaker H2O2 absorption and less latitudinal variation in H2O2 than do north/south slits crossing Tara Regio. This distribution further confirms the curious enrichment of the 3.5 μm H2O2 feature within the large-scale chaos terrains at low to midlatitudes on the leading hemisphere (S. K. Trumbo et al. 2019a), which are understood to contain endogenic non-ice material like salts (P. D. Fischer et al. 2015, 2016; S. K. Trumbo et al. 2019b, 2022).
Our maps also provide additional north/south and east/west coverage on the trailing hemisphere. Given the drastic changes in the spectral continuum shape between the two hemispheres associated with changes in water-ice abundance, we carefully inspected all continuum fitting manually and adjusted fitting parameters accordingly. Consistent with the hemispheric data of K. P. Hand & M. E. Brown (2013) and the spatially resolved data of S. K. Trumbo et al. (2019a), the trailing regions show much weaker H2O2 absorption overall. This hemispheric difference in H2O2 abundance may stem from the strong contrast in water-ice fraction between the leading and trailing hemispheres (K. P. Hand & M. E. Brown 2013; S. K. Trumbo et al. 2019a). The widespread SO2 on the trailing hemisphere (e.g., T. M. Becker et al. 2022) may also contribute to the depletion of H2O2 via interactions to create sulfate (M. J. Loeffler & R. L. Hudson 2013; S. K. Trumbo et al. 2019a).
Given that the H2O2 absorption on the trailing hemisphere is so weak against the background continuum, we cannot robustly distinguish between trailing chaos and non-chaos regions or make a clear detection of any latitudinal trend on this hemisphere. However, we do repeatedly see a depletion of H2O2 west of the anti-Jovian point around 210° west, which corresponds to a gap between the large-scale chaos regions of the leading and trailing hemispheres (Figures 3, A2), hinting that similar geological associations could exist below our detection across the trailing side. This depletion around 210° west also corresponds to lower mean reflectances across the L band (3.15–3.95 μm) mapped in P. D. Fischer et al. (2016). Future high signal-to-noise ratio JWST observations of Europa's trailing hemisphere would help further investigate the geographic variation of its weak H2O2 bands.
With the additional Keck coverage, we confirm a strong correlation between concentrated H2O2 and chaos terrains. This suggests that the endogenic composition of these regions may play an important role in controlling the distribution of H2O2 and that a possible correlation with CO2 remains a key hypothesis (S. K. Trumbo et al. 2019a).
6. JWST Mapping and Correlation with CO2
To investigate the hypothesized effect of CO2 on the unexpected distribution of H2O2 (S. K. Trumbo et al. 2019a), we measure the H2O2 band in the Cycle 1 JWST data recently used to map Europa's leading-hemisphere CO2 (G. L. Villanueva et al. 2023; S. K. Trumbo & M. E. Brown 2023) and evaluate whether H2O2 and CO2 are geographically correlated. Both features are observed simultaneously in the same data set, ensuring the best geographic alignment.
In Figure 4(a), we map the integrated band areas of the 3.5 μm H2O2 feature across Europa's leading hemisphere and show the corresponding map of Europa's ν3 CO2 band, as obtained by S. K. Trumbo & M. E. Brown (2023) (Figure 4(b)). In agreement with the Keck observations (S. K. Trumbo et al. 2019a; this work), we find that the strongest H2O2 absorption occurs in the leading-hemisphere chaos terrains Tara Regio (∼85° west) and Powys Regio (∼125° west) (Figure 4(a)), which also exhibit the strongest CO2 signatures (Figure 4(b)). In fact, a simple linear fit between the H2O2 and CO2 band strengths in the JWST data reveals a strong positive correlation (Pearson correlation coefficient of 0.94), as would be expected for the previously hypothesized effect of endogenic CO2 on radiolytically produced H2O2 (Figure 4(c)).

Figure 4. (a) Map of the H2O2 integrated band area from the JWST Cycle 1 observations. Gray dashed lines indicate the meridians and the 60° south, 30° south, 0° north, 30° north, and 60° north parallels. The strongest absorption occurs in Tara Regio (∼85° west) to the right of the 90° west meridian and in parts of the chaos region Powys Regio (∼125° west) on the left portion of the disk. (b) Map of the entire ν3 CO2 integrated band area (μm; S. K. Trumbo & M. E. Brown 2023). Concentrated CO2 occurs in the same regions as concentrated H2O2—the leading chaos terrains. The disk of Europa is indicated by a black circle centered at 2.7° north, 93° west. (c) Linear fit illustrating the relationship between the distributions of the two features. A Pearson correlation coefficient of 0.94 (P < 0.001) signifies a strong positive correlation between the distributions of H2O2 and CO2 on the leading hemisphere. Consistent with S. K. Trumbo & M. E. Brown (2023), limb pixels affected by the instrument's inherent undersampling of the point-spread function are excluded. Oscillations affected the measurement of the 3.5 μm H2O2 feature in more pixels than that of the CO2 feature. Therefore, a few more pixels are excluded than in S. K. Trumbo & M. E. Brown (2023). Leading chaos regions are outlined in black (E. J. Leonard et al. 2024).
Download figure:
Standard image High-resolution imageTwo distinct peaks are resolved within the ν3 band of Europa's CO2 (at 4.25 and 4.27 μm; S. K. Trumbo & M. E. Brown 2023), along with a combination band at 2.7 μm (G. L. Villanueva et al. 2023). As these signatures might indicate different CO2 host materials or trapping mechanisms, we also assess the correlation of H2O2 with the individual depths of each CO2 peak within the ν3 band and with the strength of the 2.7 μm feature. The Pearson correlation coefficients (R) calculated with respect to the 4.25 μm peak, the 4.27 μm peak, and the 2.7 μm band—with coefficients of 0.92 (P < 0.001), 0.92 (P < 0.001), and 0.90 (P < 0.001), respectively—are consistent with that calculated with respect to the overall ν3 band (R = 0.94; P < 0.001). As all three CO2 signatures are individually the strongest within Tara Regio (∼85° west) and Powys Regio (∼125° west; G. L. Villanueva et al. 2023; S. K. Trumbo & M. E. Brown 2023), it is unsurprising that we cannot separate a correlation between H2O2 and a particular CO2 phase from a simple strong correlation with the overall abundance of CO2 regardless of its trapping mechanisms or host materials. Nevertheless, the strong pixel-to-pixel correspondence suggests that the presence of CO2 in some form may be an important factor affecting the distribution of H2O2 in the chaos terrains, though the possibility remains that H2O2 could be associated with chaos terrains for an independent reason.
7. Discussion
Our findings suggest that Europa's H2O2 is largely insensitive to the daily temperature changes it experiences. We find no strong evidence to support the idea that H2O2 builds up efficiently overnight and then becomes depleted across Europa's day, as hypothesized from laboratory work demonstrating an inverse dependence of equilibrium H2O2 concentrations on ice temperature (K. P. Hand & R. W. Carlson 2011). We suggest that this apparent discrepancy might be due to the short timescales of Europa's temperature changes, though we also note that the observed magnitude of the influence of temperature also varies widely across different irradiation experiments and may be part of the explanation as well (e.g., O. Gomis et al. 2004; M. Loeffler et al. 2006; W. Zheng et al. 2006). Indeed, conditions directly analogous to Europa's diurnal cycles have, to our knowledge, not been simulated in the lab, and the timescale for the reaction of the dynamic equilibrium of production and destruction of H2O2 in impure ice to temperature perturbations is uncertain. K. P. Hand & R. W. Carlson (2011) infer that, if starting from pristine ice (with no H2O2 or other non-ice materials, like CO2) and irradiating at a constant surface temperature (as was done in their experiments), it would take an estimated ∼48 hr of irradiation on the trailing hemisphere and approximately 2 weeks on the leading hemisphere to reach equilibrium (R. W. Carlson et al. 2009; K. P. Hand & R. W. Carlson 2011). These timescales are extremely short in geologic terms, suggesting that a dynamic equilibrium with respect to H2O2 is almost instantly achieved following any resurfacing events, but they do not directly enable precise predictions of diurnal variations. Future irradiation experiments that first reach equilibrium H2O2 concentrations and then continuously monitor changes in H2O2 absorption, while simulating the temperature fluctuations observed on Europa through controlled heating and cooling, could help further investigate the timescales needed for Europa's H2O2 to respond to local temperature changes.
Though our IRTF and Keck results contradict the hypothesized temperature effects, our JWST results showing a strong correlation between H2O2 and CO2 within large-scale, leading-hemisphere chaos regions support the previously proposed hypothesis that CO2 may be an important factor controlling the geographic distribution of H2O2 on Europa (S. K. Trumbo et al. 2019a). Certain laboratory experiments have shown that electron-accepting contaminants, such as O2 and CO2, have the potential to enhance H2O2 yields (M. Moore & R. Hudson 2000; G. Strazzulla et al. 2005), potentially by inhibiting the breakdown of newly formed H2O2 by consuming the destructive electrons produced as the ice continues to be irradiated (M. Moore & R. Hudson 2000). Indeed, recent work continues to build on these prior experiments and appears to confirm the augmenting effects of small amounts of CO2 more robustly (B. Mamo et al. 2023; U. Raut et al. 2024), which further suggests that the spatial correlation between Europa's CO2 and H2O2 reflects this effect, rather than coincidence.
Though CO2 may explain the surprising association of radiolytically produced H2O2 with endogenic terrains on the leading hemisphere, it remains unclear how important it is for the trailing side. It is possible that the lower water-ice fraction (e.g., M. E. Brown & K. P. Hand 2013; P. D. Fischer et al. 2015; N. Ligier et al. 2016) and warmer temperatures (e.g., J. A. Rathbun et al. 2010; S. K. Trumbo et al. 2018) on the trailing side may help explain its comparative lack of H2O2. The potential chemical reaction with SO2 (M. J. Loeffler & R. L. Hudson 2013) also remains a compelling possibility. As there are few existing constraints on the possibility of CO2 on Europa's trailing hemisphere (R. W. Carlson et al. 2009; G. B. Hansen & T. B. McCord 2008), the magnitude of its influence relative to these other effects remains an open question. Future JWST observations of the trailing side would help further explore the H2O2–CO2–chaos connection and in the context of the added complications of sulfur radiolysis (e.g., R. W. Carlson et al. 2002; R. W. Carlson et al. 2009).
H2O2 was recently discovered on Ganymede and was found to be associated with its cold, icy, and highly irradiated polar regions (S. K. Trumbo et al. 2023). This discovery contrasts with the distribution of Europa's H2O2 in warm, ice-poor, large-scale chaos terrains at low to midlatitudes and instead aligns better with laboratory expectations on the effects of water-ice availability, temperature, and irradiation (e.g., M. Moore & R. Hudson 2000; M. Loeffler et al. 2006; W. Zheng et al. 2006; K. P. Hand & R. W. Carlson 2011). Indeed, Ganymede's equatorial latitudes, where little H2O2 is observed, are shielded from irradiation by its intrinsic magnetic field (e.g., K. Khurana et al. 2007; A. R. Poppe et al. 2018) and are warmer than Europa's equator (e.g., G. S. Orton et al. 1996; J. R. Spencer et al. 1999; K. de Kleer et al. 2021). Thus, though such factors do not seem to control the geographic distribution of H2O2 on Europa, they may still be important on Ganymede. Interestingly, however, Ganymede's surface also features ubiquitous CO2 (e.g., C. A. Hibbitts et al. 2003), which JWST data suggest exists in multiple trapped phases across the surface (D. Bockelée-Morvan et al. 2024). The CO2 appears most abundant in the equatorial regions, where it is suggested to be trapped in dark and non-icy substrates (C. A. Hibbitts et al. 2003; D. Bockelée-Morvan et al. 2024), which would most likely separate it from the production of H2O2 in water ice. However, in the polar regions the CO2 may be trapped within amorphous water ice and is spatially coincident with the H2O2 (D. Bockelée-Morvan et al. 2024). This opens up the possibility of a similar influence on H2O2 as seems likely on Europa and is consistent with the possibility that CO2, in addition to the low temperatures, more abundant water ice, and preferential radiolysis driven by Jovian magnetospheric particles, might help enhance H2O2 abundances at Ganymede's poles.
JWST observations of Callisto, in contrast, reveal no signs of H2O2 (R. J. Cartwright et al. 2024), despite its widespread CO2 (C. A. Hibbitts et al. 2000, 2002; R. J. Cartwright et al. 2024). The lack of H2O2 on Callisto might be related to multiple factors. First, Callisto's surface, although featuring localized bright and ice-rich knobs (J. M. Moore et al. 2004), appears to be primarily characterized by a dark, ice-poor lag deposit (J. M. Moore et al. 1999; R. J. Cartwright et al. 2024), which would restrict the availability of water ice for radiolysis. Moreover, Callisto's distance from Jupiter results in a much weaker impact of charged-particle irradiation on its surface, and the flux of charged particles from Jupiter's magnetosphere is hundreds of times lower than at Europa (J. F. Cooper et al. 2001; R. Johnson et al. 2004). Additionally, Callisto (like Ganymede's equatorial latitudes) has a higher surface temperature (representative equatorial daytime temperature ∼155 K) than Europa (representative equatorial daytime temperature of ∼120 K) (R. Hanel et al. 1979; J. R. Spencer 1987; J. R. Spencer et al. 1999; J. A. Rathbun et al. 2010; S. K. Trumbo et al. 2018; M. Camarca et al. 2023). Collectively, these factors may inhibit the production of H2O2 at Callisto to the point where the presence of CO2 is not enough to result in detectable H2O2.
Looking at H2O2 across the Galilean system may thus help us understand the factors controlling its presence on each moon. CO2 appears likely important for H2O2, on Europa and potentially also on Ganymede. Surface temperature, while not important for spatial or temporal variations of H2O2 on Europa, does align with the influences expected from laboratory studies (e.g., M. Moore & R. Hudson 2000; M. Loeffler et al. 2006; W. Zheng et al. 2006; K. P. Hand & R. W. Carlson 2011) when looking at the icy Galilean satellites as a whole. Future JWST observations of the icy satellites of Saturn and icy Kuiper Belt objects—like Charon (Pluto's largest moon), where both CO2 and H2O2 were recently detected (S. Protopapa et al. 2023)—may enhance our understanding of the complex interplay of factors influencing the radiolytic production of H2O2, thereby providing deeper insights into this important process in the outer solar system.
8. Conclusion
In this study, we use a combination of IRTF, Keck, and JWST observations of Europa to assess the influence of temperature and CO2 on Europa's H2O2. We find at most minimal changes in H2O2 as a result of local temperature variations on timescales associated with Europa's eclipse by Jupiter and diurnal cycle, suggesting a surprising temperature insensitivity that appears at odds with some laboratory studies. We suggest that this apparent discrepancy might be explained if the diurnal timescales are short compared to those needed for the H2O2 concentrations to respond to a temperature perturbation and recommend laboratory experiments to explore this further. Using JWST NIRSpec data, we find a clear and strong correlation between Europa's H2O2 and CO2, supporting the previously suggested hypothesis that endogenic CO2 may enhance H2O2 abundances and thereby explain the unexpected concentration of H2O2 in low-latitude chaos terrain. This correlation is also in agreement with limited past and recent laboratory work suggesting that CO2 can act as an electron-scavenging contaminant that increases H2O2 yields by inhibiting its breakdown. Future spatially resolved observations on Europa's trailing hemisphere can further test this correlation and explore the possible influence of sulfur-bearing, trailing-hemisphere components as well.
Acknowledgments
The IRTF/Spex data presented were obtained at the Infrared Telescope Facility, which is operated by the University of Hawaii under contract 80HQTR24DA010 with the National Aeronautics and Space Administration. The Keck AO data presented were obtained at Keck Observatory, which is a private 501(c)3 nonprofit organization operated as a scientific partnership among the California Institute of Technology, the University of California, and the National Aeronautics and Space Administration. The Observatory was made possible by the generous financial support of the W. M. Keck Foundation. The authors wish to recognize and acknowledge the very significant cultural role and reverence that the summit of Maunakea has always had within the indigenous Hawaiian community. We are most fortunate to have the opportunity to conduct observations from this mountain. The JWST data were obtained from the Mikulski Archive for Space Telescopes (MAST) at the Space Telescope Science Institute, which is operated by the Association of Universities for Research in Astronomy under NASA contract NAS 5-03127 for JWST. These observations are associated with program No. 1250. The authors acknowledge H. Hammel and the GTO team led by PI G. Villanueva for developing their observing program with a zero-exclusive-access period. The specific observations analyzed can be accessed via DOI:10.17909/e269-sm44. S. K. Trumbo acknowledges support from the Heising-Simons Foundation through a 51 Pegasi b Fellowship. We thank Ryleigh Davis for fruitful discussions and Jonathan Lunine for insightful comments and constructive suggestions. We thank Erin Leonard for providing shape files for Europa's geologic units.
Facilities: IRTF/Spex - , Keck II - , JWST - James Webb Space Telescope
Software: Astropy (T. P. Robitaille et al. 2013; A. M. Price-Whelan et al. 2018, 2022), Scikit-image (S. van der Walt et al. 2014), Scipy (P. Virtanen et al. 2020), Cartopy (Met Office 2010-2015), Astroquery (A. Ginsburg et al. 2019), Spextool (M. Cushing et al. 2004)
Appendix
This appendix includes supplementary figures of averaged IRTF spectra for each 1â€hr time window (Figure A1), additional Keck paired slits to illustrate the lack of a strong diurnal trend (Figure A2), and two example JWST spectra used for Figure 4 (Figure A3).

Figure A1. Averaged spectra for each ∼1 hr time window of (a) 2 hr pre-eclipse, (b) 1 hr pre-eclipse, (c) 1 hr post-eclipse, (d) 2 hr post-eclipse, (e) 3 hr post-eclipse, (f) 4 hr post-eclipse, (g) 5 hr post-eclipse, and (h) 6 hr post-eclipse. All spectra are normalized to their individual peaks in the 3.6–3.7 μm region. Dashed gray lines outline the H2O2 band. Second-order polynomial continua are indicated by the black dashed curves. Continuum-removed absorptions are included. We note that the 3 hr post-eclipse spectrum is noisier owing to a shorter observation time (necessitated by weather conditions), as indicated in Table 1. A factor of change <2 is shown in the H2O2 band throughout the 8 hr time period surrounding eclipse. The slight changes to the background water-ice absorption bands suggest likely rotational effects as Europa rotates from a more trailing/sub-Jovian geometry toward a more sub-Jovian/leading geometry. More discussion is included in Section 3.
Download figure:
Standard image High-resolution image
Figure A2. Additional representative paired slits to illustrate the lack of a strong diurnal trend. We examine a total of five Keck slit pairs observed on adjacent nights in 2016 and 2018, one of which is shown in Figure 2, and two slit pairs observed across different years. Time spans for each paired comparison are labeled on top. (a) Paired slits from consecutive nights obtained on 2016 February 24 (top) and 2016 February 25 (bottom), when overlapped regions (∼18°–36° west) are in the morning and afternoon, respectively. (b) Paired slits slightly south of A with a slightly shorter time span, obtained on 2016 February 24 (top) and 2016 February 25 (bottom), when overlapped regions (∼20°–45° west) are in the morning and afternoon, respectively. (c) Paired slits obtained from consecutive nights on 2018 June 06 (top) and 2018 June 07 (bottom), when overlapped regions (∼155°–179° west) are in the morning and afternoon, respectively. (d) Paired slits from consecutive nights obtained on 2018 June 06 (top) and 2018 June 07 (bottom), when overlapped regions (∼157°–180° west) are in the morning and afternoon, respectively. (e) Paired slits obtained across years on 2013 December 29 (top) and 2018 June 07 (bottom), when overlapped regions (∼155°–182° west) are in the morning and afternoon, respectively. (f) Paired slits obtained across years on 2018 June 06 (top) and 2013 December 29 (bottom), when overlapped regions (∼155°–181° west) are in the morning and afternoon, respectively. For all pairs and overlapping regions examined, the measured band area changes from morning to afternoon are within −32%–44% (factor of 0.68–1.44). These results suggest the absence of a strong diurnal trend and a lack of sensitivity in H2O2 to temperature variations over the assessed timescales. The slits also present a clear difference between low-latitude chaos and low-latitude plains terrain in east/west slits crossing the leading chaos regions (panels (a)–(d)) and a depletion of H2O2 west of the anti-Jovian point around 210° west, corresponding to a gap between the large-scale chaos regions of the leading and trailing hemispheres (panels (c)–(f)). Leading and trailing chaos regions are outlined in black (E. J. Leonard et al. 2024). Background basemap credit: USGS (2002).
Download figure:
Standard image High-resolution image
Figure A3. Representative JWST spectra used for Figure 4, showing both the H2O2 and CO2 bands in the Cycle 1 JWST data recently used to map Europa's leading-hemisphere CO2 (S. K. Trumbo & M. E. Brown 2023; G. L. Villanueva et al. 2023). The black spectrum is extracted from a pixel within Tara Regio (92° west, 17° south), and the gray spectrum is extracted from a pixel north of Tara Regio (57° west, 19° north). A clear enrichment of both H2O2 and CO2 is shown in the Tara Regio spectrum.
Download figure:
Standard image High-resolution image