


Abstract
The origins of the giant planet satellites are debated, with scenarios including formation from a protoplanetary disk, sequential assembly from massive rings, and recent accretion after major satellite–satellite collisions. Here, we test their predictions by simulating outer solar system bombardment and calculating the oldest surface ages on each moon. Our crater production model assumes the projectiles originated from a massive primordial Kuiper Belt (PKB) that experienced substantial changes from collisional evolution, which transformed its size frequency distribution into a wavy shape, and Neptune's outward migration, which ejected most PKB objects onto destabilized orbits. The latter event also triggered an instability among the giant planets some tens of Myr after the solar nebula dispersed. We find all giant planet satellites are missing their earliest crater histories, with the likely source being impact resetting events. Iapetus, Hyperion, Phoebe, and Oberon have surface ages that are a few Myr to a few tens of Myr younger than when Neptune entered the PKB (i.e., they are 4.52–4.53 Gyr old). The remaining midsized satellites of Saturn and Uranus, as well as the small satellites located between Saturn's rings and Dione, have surfaces that are younger still by many tens to many hundreds of Myr (4.1–4.5 Gyr old). A much wider range of surface ages are found for the large moons Callisto, Ganymede, Titan, and Europa (4.1, 3.4, 1.8, and 0.18 Gyr old, respectively). At present, we favor the midsized and larger moons forming within protoplanetary disks, with the other scenarios having several challenges to overcome.
Export citation and abstract BibTeX RIS

Original content from this work may be used under the terms of the Creative Commons Attribution 4.0 licence. Any further distribution of this work must maintain attribution to the author(s) and the title of the work, journal citation and DOI.
1. Introduction
The satellites of the giant planets show amazing diversity, ranging from a moon dominated by ongoing volcanism (Io) to a myriad of ocean worlds (e.g., Europa, Enceladus) to objects that resemble captured Kuiper Belt–like objects (e.g., Phoebe). By probing the satellite's earliest geologic histories, it may be possible to glean insights into the processes that formed them as well as how they have changed over time. A major geologic process affecting the giant planet satellites is early bombardment. While most of the giant planet satellites have extensive crater records, there are also intriguing indications that some were hit by impactors capable of shattering or even disrupting their targets (Movshovitz et al. 2015, 2016). It is uncertain what such events would mean for worlds with subsurface oceans. One could imagine a range of possibilities, with the large impacts producing near-surface melting, global resurfacing, and in some cases, partial or wholesale differentiation (e.g., Barr & Canup 2010).
An additional motivation for probing the bombardment history of the giant planet satellites is to test satellite origin models. While the classical scenario is that most of these moons formed from a circumplanetary disk of gas, dust, and pebbles (e.g., Canup & Ward 2002, 2006; Shibaike et al. 2019; Batygin & Morbidelli 2020; Madeira et al. 2021), others suggest they could be derived from a massive ring, with moonlets forming, dynamically evolving, and accreting at the edge of a planet's Roche limit (Charnoz et al. 2011; Crida & Charnoz 2012; see Nimmo et al. 2018 and references therein). There are also intriguing suggestions that Saturn's rings and satellites are relatively young (Ćuk et al. 2016; Zhang et al. 2017; Crida et al. 2019; Iess et al. 2019; Kempf et al. 2023), such that some inner Saturnian satellites formed as the byproduct of one or more cataclysmic collisions within the last ∼0.1 to 1 billion years (e.g., Ćuk et al. 2016; Dubinski 2019). Ideally, the predictions of many of these origin models are testable using the crater histories of the giant planet satellites.
A substantial source of bombardment for outer solar system worlds in the post-accretion era is the primordial Kuiper Belt (PKB), a ∼30 Earth mass disk of ice-rock planetesimals located primarily between ∼24 and ∼30 au (e.g., Nesvorný et al. 2017; Bottke et al. 2023). Dynamical models favor the idea that the giant planets originated on different orbits than we see today, with all of them initially residing within mutual mean motion resonances (MMRs) between ∼5 and ∼17 au (Tsiganis et al. 2005; Nesvorný & Morbidelli 2012). A few tens of millions of years after the dissipation of the solar nebula, Neptune entered the PKB and migrated across it, coming to a stop near ∼30 au. The timing of this event is constrained by collisional evolution modeling of the PKB and Jupiter Trojans (e.g., Nesvorný et al. 2018; Bottke et al. 2023). The havoc wreaked by Neptune's passage across the PKB caused numerous Kuiper Belt objects (KBOs) to be ejected onto giant planet-crossing orbits, creating what Bottke et al. (2023) called the destabilized population. They argued this population is the probable source of most early impacts on the giant planet satellites.
Interactions between the destabilized population and the giant planets also triggered a dynamical instability that led to numerous encounters between the giant planets (Tsiganis et al. 2005). Eventually, the giant planets migrated to their observed orbits, but not before they created numerous small body reservoirs, such as the observed Kuiper Belt, Oort cloud, scattered disk, irregular satellites of the giant planets, Jupiter and Neptune Trojans, Hilda asteroids, and D- and P-type asteroids captured in the main asteroid belt (e.g., Nesvorný et al. 2003, 2007, 2013, 2017, 2018, 2020, 2021a; Morbidelli et al. 2005; Tsiganis et al. 2005; Levison et al. 2008; Nesvorný 2011; Batygin et al. 2012; Nesvorný & Morbidelli 2012; Kaib & Sheppard 2016; Nesvorný & Vokrouhlický 2016, 2019; Vokrouhlický et al. 2016, 2019; Clement et al. 2018; Lawler et al. 2019; see Nesvorný 2018 for a review). The longest-lived component of the destabilized population is called the scattered disk, which has resupplied the Jupiter-family comet and Centaur populations for billions of years (e.g., Fraser et al. 2022). The scattered disk is the source of most recent impacts on the giant planet satellites.
In this paper, we quantify the time-varying impact flux on the giant planet satellites from the destabilized population and scattered disk. The goal is to explore how each satellite was affected by impacts and determine their oldest surface ages as constrained by their most ancient crater size–frequency distributions (SFDs). This requires the construction of a crater production model that includes the following components:
- 1.the nature and degree of collisional evolution in the PKB prior to Neptune's entering this population;
- 2.the nature and timing of the PKB's dynamical depletion by Neptune's outward migration, the creation of the destabilized population and scattered disk, and how collisional evolution affected their SFDs over time;
- 3.the time-varying impact flux of the destabilized population/scattering disk onto the giant planet satellites from primordial times to today;
- 4.crater scaling laws that can turn a bombardment flux into a crater production rate over time.
As we will discuss below, previous efforts to model the impact flux on the giant planet satellites have produced many interesting results but have not included all aspects of items #1–#4. For example, some have concentrated their studies on relatively late eras where the impact flux can be constrained by present-day observations (e.g., Zahnle et al. 2003; Dones et al. 2009; Nesvorný et al. 2023). Other groups have tried to incorporate the dynamical results of existing giant planet instability simulations into their crater production models (e.g., Charnoz et al. 2009; Barr & Canup 2010; Nimmo & Korycansky 2012; Wong et al. 2019, 2021, 2023). To date, though, no group has yet tried to incorporate how the collisional evolution of the PKB and destabilized population may have affected the bombardment rate of the giant planet satellites, nor have they used a giant planet instability model that has been successfully tested against a wide range of small body population constraints (e.g., see Nesvorný et al. 2013, 2017, 2021a; Vokrouhlický et al. 2019).
Here, we propose to overcome these issues by building on the work of Bottke et al. (2023), who modeled the collisional and dynamical evolution of the PKB, destabilized population, and Jupiter Trojans. Their solutions for items #1–#4 will be discussed below.
One dynamical process we will exclude from our modeling work will be an exploration of how the semimajor axes of the giant planet satellites have changed over time from tidal evolution. Tidal effects can increase the semimajor axes of moons relatively close to a giant planet, provided they have orbital periods longer than the planet's spin period (e.g., Burns 1986). The research on tidal evolution processes is extremely rich, with recent theoretical work suggesting tidal dissipation linked to the internal evolution of the giant planets can dominate the outward migration of a moon away from a giant planet (Fuller et al. 2016; Lainey et al. 2020). In these so-called resonance locking models, the tidal quantity Q, which describes a body's response to tidal distortion, can vary with time, such that current Q values may not be representative of past values.
As of this writing, there is no consensus on what model parameters should be used when simulating the coupled evolution of a giant planet's interior, the dynamical tidal response, and the satellite's semimajor axis. Until more is known, we have decided to defer including a satellite tidal evolution model in our work. With that said, the crater production model described here could be readily used to constrain how far satellites migrating outward from their host giant planet have traveled by tidal evolution. Some discussion of these issues is provided in Section 7.3.
2. Previous Work
There is something of a natural division when it comes to previous work on the bombardment of the giant planet satellites from heliocentric impactors. Some groups have concentrated on developing a crater chronology, and others have examined what happens to the satellites from the largest impacts. We discuss each set in the following subsections. We also briefly review a scenario where all craters on the satellite were derived from planetocentric debris.
2.1. Crater Chronologies for the Giant Planet Satellites
There have only been a few previous attempts to develop an impact chronology for the outer solar system, partly because few Kuiper Belt and scattered disk objects were known until the late 1990s, but also because the dynamical models of small body and outer solar system evolution changed radically between the mid-1990s and the mid-2000s. Pioneering works on chronology prior to this era include Smith et al. (1982, 1986, 1989), Shoemaker & Wolfe (1982). They recognized that the dominant heliocentric impactor population striking the giant planet satellites were comets (i.e., we use comets as a generic term for outer solar system small bodies, even though most do not display activity far from the Sun). They did what they could to quantify the impact flux, but the observational data and computational simulations on comets and their source populations were limited in that era.
Additional work was done by Neukum et al. (1998, 1999), who assumed that the impactor population for the giant planet satellites was predominantly coming from objects ejected from the main asteroid belt. Given that some of these bodies struck the Moon, they argued their derived crater chronology for the Moon could be scaled to outer solar system worlds. We consider this scenario to be unlikely given what is known about comet and asteroid dynamics as well as the nature of their source regions (Bottke et al. 2023).
A key advance in outer solar system chronology came from the realization that ecliptic comets, which are comprised of Jupiter-family comets and Centaurs, are derived from the scattered disk of Neptune, a population that dynamically decays over time (Levison & Duncan 1994; Duncan & Levison 1997). This led to the breakthrough modeling work of Zahnle et al. (2003; see also Zahnle et al. 1998, 2001), who developed a crater production and chronology model based on the expected impact rate of ecliptic comets over time. Impacts from nearly isotropic (i.e., Halley-type and Oort cloud) comets and escaped Jupiter Trojans were also evaluated, but the flux from both was small relative to ecliptic comets.
Using results from a dynamical model describing the distribution and long-term dynamical depletion of ecliptic comets (Levison et al. 2000), Zahnle et al. (2003) computed the collision probabilities and impact velocities of comet impacts on the giant planets and their satellites. The same dynamical model was also used to calculate how the impactor flux on Jupiter likely changed over the last several billions years. They constrained the impact flux by estimating the present-day impact rate on Jupiter from various-sized comets using a wide range of data (also see Dones et al. 2009). For example, some values came from observations of Jupiter-family comets having close encounters with Jupiter over the last 350 yr. Other insights were derived from the crater SFDs found on Jupiter's Galilean satellites (Schenk et al. 2004) and Triton (Schenk & Zahnle 2007). Using the model components discussed above, they were able to scale their estimate of the Jupiter impact flux to other outer solar system worlds. The final step was to turn their impactor flux into a crater production model using their chosen crater scaling law.
Their crater production model had two variants called Case A and Case B. In Case A, the impactor SFD was largely based on the crater SFDs found on Europa and Ganymede, while, in Case B, the impactor SFD was based on the crater SFD found on Triton. Triton's crater SFD was found to be substantially steeper (i.e., the number of craters increased more rapidly with decreasing crater size) than those found on Europa and Ganymede, but the reason for this difference was unknown at the time.
Subsequent work by Schenk & Zahnle (2007) showed that 5 km craters on Triton were within 90° of the apex of Triton's orbital motion (i.e., all on its leading hemisphere) and that the craters followed a cosine density distribution with respect to the apex. The authors argued that this pattern was unlikely to originate from heliocentric projectiles. They instead suggested Triton's craters were from planetocentric debris swept up by Triton, with the impactors possibly originating as ejecta from small moons within the Neptune system. Given that Case B was not built to account for this impactor source, it cannot be used to estimate surface ages in the outer solar system without additional work.
On the other hand, the potential importance of planetocentric projectiles was highlighted by Ferguson et al. (2020, 2022a, 2022b). They showed that terrains on Tethys and Dione with Case B–like SFDs have populations of elongated craters dominated by east–west orientations. These crater populations, mostly comprised of Dcrat < 20 km craters, are more easily explained by the impact of planetocentric debris than heliocentric comets, the latter of which would produce no preferred orientation (e.g., Marchi et al. 2001). For reference, craters formed by planetocentic debris can take on different forms. Secondary craters are those formed from the impact of suborbital ejecta from a single impact, while sesquinary craters are those formed from the impact of ejecta that initially escaped the target body, orbited the central body in the circumplanetary system, and then reimpacted the target body or another body in the system. The source of the small planetocentric projectiles striking Tethys, Dione, and other worlds is unknown, but we will discuss some intriguing possibilities later in the text.
At this time, Case A is the best available model to date younger terrains on the giant planet satellites, but it does have limitations. For example, it has no associated dynamical model, but instead assumes the projectiles decay with a dependence that follows the reciprocal of elapsed time. The dynamical models presented later in our text, however, are more consistent with stretched exponentials. This means the Case A ages for ancient surfaces with large crater spatial densities in the outer solar system may be inaccurate.
Other issues involve the inferred crater production SFD for Case A. Based on our work in Bottke et al. (2023), we argue that the Case A SFD is reasonable for many circumstances, with a shallow power-law slope followed for D < 1 km projectiles and a steeper power-law slope followed for D > 1 km projectiles. As will be further described below, however, Bottke et al. (2023) showed that impactor SFD steadily evolves over time, with the power-law slope for 1 < D < 10 km projectiles becoming modestly steeper as time goes on. This will play a role in our discussion of crater SFDs found on Ganymede (Section 5.6).
An alternative crater chronology was developed by Di Sisto & Zanardi (2013, 2016), who calculated the production of craters on the midsized Saturnian satellites over time by Centaurs, a subpopulation derived from the scattered disk (see also Di Sisto & Brunini 2007, 2011). Specifically, they used the output from numerical simulations of scattered disk objects encountering Saturn when they entered onto planet-crossing orbits. These data were then turned into a time-varying impact flux. The initial scattered disk was assumed to be 100 times more massive than the present one (Morbidelli et al. 2008). The projectile SFD used was also different from that of Case A from Zahnle et al. (2003), with the tested differential power-law slopes for D < 60 km projectiles having values of −2.5 and −3.5. This model will be discussed further below.
The crater chronology from Wong et al. (2019, 2021, 2023) takes advantage of several advances in outer solar system dynamical models since Zahnle et al. (2003). Specifically, Wong et al. (2019, 2021, 2023) assumed the giant planets experienced a giant planet instability brought on by Neptune's migration through the PKB (e.g., Tsiganis et al. 2005). This allowed them to compute the impact rates between the destabilized population and the giant planets while also accounting for how the destabilized population experienced dynamical depletion. In their model, they computed the collision probabilities and impact velocities between synthetic comets and the giant planet satellites by tracking test bodies passing through the Jupiter, Saturn, and Uranus systems. Their model also attempted to account for potential bombardment from unstable irregular satellites captured around the host planet during the giant planet instability, although they found these impactors had a minimal effect on their results compared to those from the destabilized population.
To compare their results to observed crater populations, Wong et al. (2019, 2021, 2023), like Zahnle et al. (2003), used an impactor SFD that had a static shape through time. Various choices were made for that shape: Wong et al. (2021) based their estimates on what was known of the Kuiper Belt SFD from Fraser et al. (2014), Nesvorný & Vokrouhlický (2016), while Wong et al. (2023) based their work on crater SFDs found by Kirchoff & Schenk (2009), Singer et al. (2019). The surface ages from Wong et al. (2021) were computed by comparing their model results to the spatial densities of Dcrat > 20 and 300 km craters on the giant planet satellites, while those for Wong et al. (2023) compared model impact–crater isochrons with the full crater SFDs for the Saturn satellites. They did this by converting their impactor SFD to a crater production SFD using the crater scaling laws in Zahnle et al. (2003), Johnson et al. (2016). Crater spatial densities and SFDs were taken from several sources (e.g., Plescia 1987; Neukum et al. 1998; Zahnle et al. 2001; Schenk et al. 2004; Kirchoff & Schenk 2009).
There are strengths and weaknesses to the approaches taken by Di Sisto & Zanardi (2016), Wong et al. (2019, 2021, 2023). We consider it a strength that Di Sisto & Zanardi (2016) tried to explicitly account for how the scattered disk lost material over time, and that Wong et al. (2019, 2021, 2023) used a dynamical model that assumes a giant planet instability took place (Tsiganis et al. 2005). On the other hand, Di Sisto & Zanardi (2016) does not model the giant planet instability, while Wong et al. (2019, 2021, 2023) treats the instability in an approximate manner. This could mean that both impactor flux models have inaccuracies that feed back into their model results. In addition, both methodologies use a diversity of crater production SFDs in their models. This wide range of possibilities makes it difficult to interpret any differences that exist between their model results and observed crater spatial densities/crater SFDs.
We defer a discussion of their model results to Section 5.7. This gives us the opportunity to summarize the properties of the giant planet satellites, discuss the nature of our model, and provide our own crater production model results.
2.2. Impact Disruption for Some Giant Planet Satellites
Dynamical simulations indicate the PKB originally contained the order of ∼108 D > 100 km bodies (Nesvorný et al. 2018). When Neptune migrated across the PKB, 99.9% of these bodies were sent into the destabilized population. While most were ultimately ejected out of the solar system by close encounters with Jupiter, a fraction should have hit the giant planets and their satellites. This intense bombardment likely affected the evolution of many midsized satellites. For smaller satellites (i.e., a few tens of kilometers in diameter), their fate rests on the shape of the impacting SFD for smaller projectiles.
Charnoz et al. (2009) examined these issues as well as whether bodies from the destabilized population passing through the Saturn system could have produced Saturn's rings. Their two proposed mechanisms were the tidal disruption of sizable objects as they passed through Saturn's Roche limit (e.g., Dones 1991) and the impactors disrupting a preexisting satellite near Saturn's Roche limit. Their model adopted the classical form of the giant planet instability from Tsiganis et al. (2005), while their estimate of the destabilized population's SFD was based on what was known of the Kuiper Belt SFD at that time (e.g., Bernstein et al. 2004; Charnoz & Morbidelli 2007). Specifically, they assumed a cumulative power-law SFD with a break near D = 200 km, with D > 200 km objects following a power-law index of −3.5 and D < 200 km objects following −2.5. They also tested an SFD that was scaled to match Iapetus's cratering constraints. It was similar to the previous SFD but had a second elbow in the SFD at D = 15 km, with D < 15 km bodies following a power-law index of −1.5. For reference, this gave them the order of ∼107 D > 100 km bodies and nearly 1010 D > 10 km bodies.
Their results showed that Mimas and the smaller satellites in the Saturn system had likely been disrupted. To explain their existence, Charnoz et al. (2009) suggested these bodies reaccreted after early bombardment was complete. They also concluded that Enceladus had a roughly 50% chance of survival, while Titan and the other midsized moons (Tethys, Dione, Rhea, Iapetus) and Phoebe were likely to survive. Note that several earlier works had also suggested that the smaller satellites experienced disruption in the past (e.g., Smith et al. 1982; Marchi et al. 2002).
Barr & Canup (2010) also examined how such a bombardment would have affected Ganymede and Callisto, two Jovian satellites that are similar in both size and composition. They pointed out that, while Ganymede shows many signs that it is differentiated (e.g., it has a magnetic field, it has shown tectonic activity in the past, and it has a large rock/metal core), the separation of ice and rock in Callisto's interior may still be incomplete (e.g., no magnetic field; no widespread tectonic activity; evidence for a core is ambiguous from existing data). They hypothesized that impact heating from large projectiles in the destabilized population would cause more ice/rock separation in Ganymede than Callisto. As shown by Zahnle et al. (2003), Ganymede has a higher impact flux, and impactors strike it at higher speeds than Callisto (i.e., mean velocities of 20 and 15 km s−1, respectively).
Using an impactor SFD reminiscent of the one from Charnoz et al. (2009; i.e., a cumulative power-law SFD with an elbow that occurred at D = 94 km, with D < 94 km following q = −2, and D > 94 km following q = −5.5), they found intriguing solutions where impacts triggered runaway differentiation in Ganymede yet left Callisto only partially differentiated. The mass delivered to Callisto was <3 × 10²⁰ kg (Barr & Canup 2010; Nimmo & Korycansky 2012). In a similar modeling effort, Barr et al. (2010) found that Titan would remain undifferentiated if the PKB started with <32 Earth masses.
These results inspired Nimmo & Korycansky (2012) to examine whether impactors from the destabilized population would lead to dire consequences for many of the smaller giant planet satellites. Using the Iapetus-constrained impactor SFD from Charnoz & Morbidelli (2007), they examined the impactor masses and energies delivered to all the giant planet satellites by applying the collision probabilities and impact velocities derived by Zahnle et al. (2003). They also used Equation (13) from Kraus et al. (2011) to see if these same impactors would vaporize large quantities of ice from the satellites. They found that Mimas, Miranda, and Enceladus were likely to lose all of their volatiles from early bombardment. This model prediction, however, does not match the observed composition of the moons themselves, all of which have high mass fractions of ice. Several explanations were postulated for this difference, including that the mass delivered to the satellites by their SFD was too large. Nimmo & Korycansky (2012) asserted that lowering the mass flux by a factor of 10 would be sufficient to explain observations (i.e., the upper bound on the mass delivered to Callisto would be <3 × 10¹⁹ kg), but that this would work against the idea that the differences between the impact populations on Ganymede and Callisto were produced by impacts. We will return to these issues in Sections 6.1–6.2.
Additional work on satellite disruption can be found in Movshovitz et al. (2015, 2016). Movshovitz et al. (2015) adopted the "Iapetus" impactor SFD from Charnoz et al. (2009) and developed a criterion for catastrophic disruption for large satellites. They found that Mimas, Enceladus, Tethys, and Miranda experienced at least one catastrophic impact in every one of their simulations. In a follow-up study, Movshovitz et al. (2016) examined suites of impact experiments on 10–1000 km diameter bodies performed by numerical hydrocode simulations. Their results led to disruption thresholds that were lower than previous estimates from the literature. For example, using Mimas as a target test body, which is nearly 400 km in diameter, a 36 km, 54 km, and 30 ± 6 km projectile striking at 24 km s−1 would cause a disruption based on the scaling law criteria in Benz & Asphaug (1999), Leinhardt & Stewart (2012), and Movshovitz et al. (2016), respectively (see Movshovitz et al. 2016 for details). This range spans nearly an order of magnitude in mass and energy.
Finally, we return to the work of Wong et al. (2019, 2021). Their estimates of the destabilized population's SFD assumed there were the order of ∼108 D > 100 km bodies and between 109 and 1010 D > 10 km bodies. They found that Mimas, Enceladus, Hyperion, and Miranda would all be hit by several weight percent (wt%) of their individual masses; Tethys, Dione, Ariel, Umbriel, Titania, and Oberon receive about 1 wt%; while Io, Europa, Ganymede, Callisto, and Titan get <0.1 wt%. Using the disruption criterion of Movshovitz et al. (2016) and a mass erosion relationship from Hyodo & Genda (2020), they argued that Mimas, Enceladus, and Miranda would all be expected to lose an amount of mass that is greater than their current masses, while Tethys, Dione, Rhea, Ariel, Umbriel, Titania, and Oberon would lose approximately 10% of their masses. We will discuss these issues further in Sections 6.4–6.5.
2.3. Synthesis
Some takeaways from Sections 2.1 and 2.2 are as follows. First, the proposed projectile SFDs for the giant planet satellites have shapes that have been reverse engineered from crater SFDs and/or extrapolated from small body observations. This leads to some variability in the results between different groups. Second, the dynamical depletion of the destabilized population and scattered disk is accounted for in different ways by different groups, which also produces a range of outcomes. Third, some groups do not show their fit between their crater production model and the observed crater SFDs found on various worlds. We believe this test is useful in identifying issues that could affect the interpretation of the results. Fourth, while several groups have proposed that large impacts could have disrupted small giant planet satellites, there is no agreed upon criterion for this outcome, and the implications of satellite disruption need further exploration.
Our work uses what we have learned from Bottke et al. (2023) to find a path through this thicket of issues. In the process, we find both interesting results and complicating factors that warrant discussion. Our description of our crater production model starts in Section 3.
2.4. Can Planetocentric Debris Produce All Craters on Satellites?
In Section 2.1, we briefly discussed the possibility that some craters on the giant planet satellites were produced by the impact of planetocentric debris. The idea of a dichotomy in crater populations, with some craters produced by heliocentric impactors and others produced by planetocentric impactors, goes at least as far back as Smith et al. (1981, 1982) and their exploration of craters on Saturn's moons (i.e., Populations I and II). We will further discuss the possibility of a hybrid impactor population in Section 5.2.3.
Given this, one might ask whether all craters on the giant planet satellites could be from planetocentric sources. This endmember bombardment scenario was recently championed by Bell (2020). They argued that the similarity in crater spatial densities between Mimas, Tethys, Dione, Rhea, and Iapetus could have been produced by planetocentric debris. Bell (2020) also predicted that his preferred planetocentric production function would vary by less than a factor of ∼5 between Mimas and Iapetus.
The need for craters from planetocentric impactors goes hand in hand with new modeling work suggesting that the midsized satellites of Saturn may be considerably younger than the age of the solar system (e.g., Crida & Charnoz 2012; Ćuk et al. 2016; Salmon & Canup 2017; Lainey et al. 2020). As discussed in Bottke et al. (2023), heliocentric sources for satellite bombardment become highly depleted over time. This means that, if a moon forms late enough, the only viable option to explain its cratering record is to have the projectiles come from planetocentric debris. Some challenges with this scenario are discussed in Section 7.3.
At present, there are no models in the literature that cover all three of the following topics: (i) planetocentric debris creation, (ii) debris population evolution, and (iii) satellite bombardment from planetocentric debris over time. The best available for component (i) would perhaps be from Kegerreis et al. (2023), who created ejecta in the inner Saturn system by smashing a Dione-sized satellite into a Rhea-sized satellite. Components (ii) and (iii) were beyond the scope of their work. Even if (ii) and (iii) were included, however, it seems unlikely that debris from such a collision would produce a relatively even distribution of craters all the way from Mimas to Iapetus, as suggested by Bell (2020). We would instead expect that the ejecta would be concentrated near the collision site, with relatively few projectiles obtaining high enough eccentricities to reach Iapetus.
While we will not pursue components (i)–(iii) within this paper, we do consider it an important project for future work. It may be one of the best ways to test the young satellite scenarios going forward.
3. Crater Production Model
3.1. Collisional and Dynamical Evolution of the Destabilized Population
To construct a crater chronology/crater production model for the giant planet satellites, we need to understand items #1–#3 in the introduction (Section 1), which are repeated here:
- 1.the nature and degree of collisional evolution in the PKB prior to Neptune's entering this population;
- 2.the nature and timing of the PKB's dynamical depletion by Neptune's outward migration, the creation of the destabilized population and scattered disk, and how collisional evolution affected their SFDs over time; and
- 3.the time-varying impact flux of the destabilized population and scattering disk on the giant planet satellites from early times to today.
We address these issues using model results from Bottke et al. (2023), who investigated the coupled collisional and dynamical evolution of the PKB and destabilized population. Here, we briefly review their model and results.
They started their work with two model components developed and tested by Nesvorný & Morbidelli (2012), Nesvorný et al. (2013, 2017). The first was the size/orbital distribution of the initial PKB population, most of which started between 24 and 30 au, with a low mass extension outward through the cold classical Kuiper Belt to 45 au. They assumed the PKB contained ∼2000 Pluto-sized objects and 108 D > 100 km bodies. The second was a giant planet instability model that can reproduce the nature of the terrestrial planets, main asteroid belt, Hildas, Jupiter and Neptune Trojans, irregular satellites, Kuiper Belt, and Oort cloud (Nesvorný 2015a, 2015b; Nesvorný & Vokrouhlický 2016; Vokrouhlický et al. 2016; Nesvorný et al. 2017, 2018, 2019, 2020, 2021a; see also Nesvorný 2018 for a review).
The starting SFD for the PKB in Bottke et al. (2023) was assumed to have ∼30 Earth masses of material, most of it in D ∼ 100 km diameter bodies, as suggested by the shape of the current Kuiper Belt SFD and streaming instability calculations (Nesvorný et al. 2019, 2021b; Simon et al. 2022). This mass was chosen to be modestly larger than previous estimates, which were closer to 20 Earth masses (e.g., Nesvorný 2018), in order to leave some room for collision evolution within the PKB.
The cumulative power-law slope of the SFD for D < 100 km bodies was assumed to be shallow (e.g., close to q ∼ −1), as suggested by recent observations of the cold classical Kuiper Belt (Napier et al. 2024) and main belt collision evolution models, with the carbonaceous planetesimals presumably formed in the giant planet region (e.g., Bottke et al. 2005a, 2005b; 2015; Walsh et al. 2011; Figure 1). This shape means that planetesimal formation for D < 100 km objects was somewhat limited.
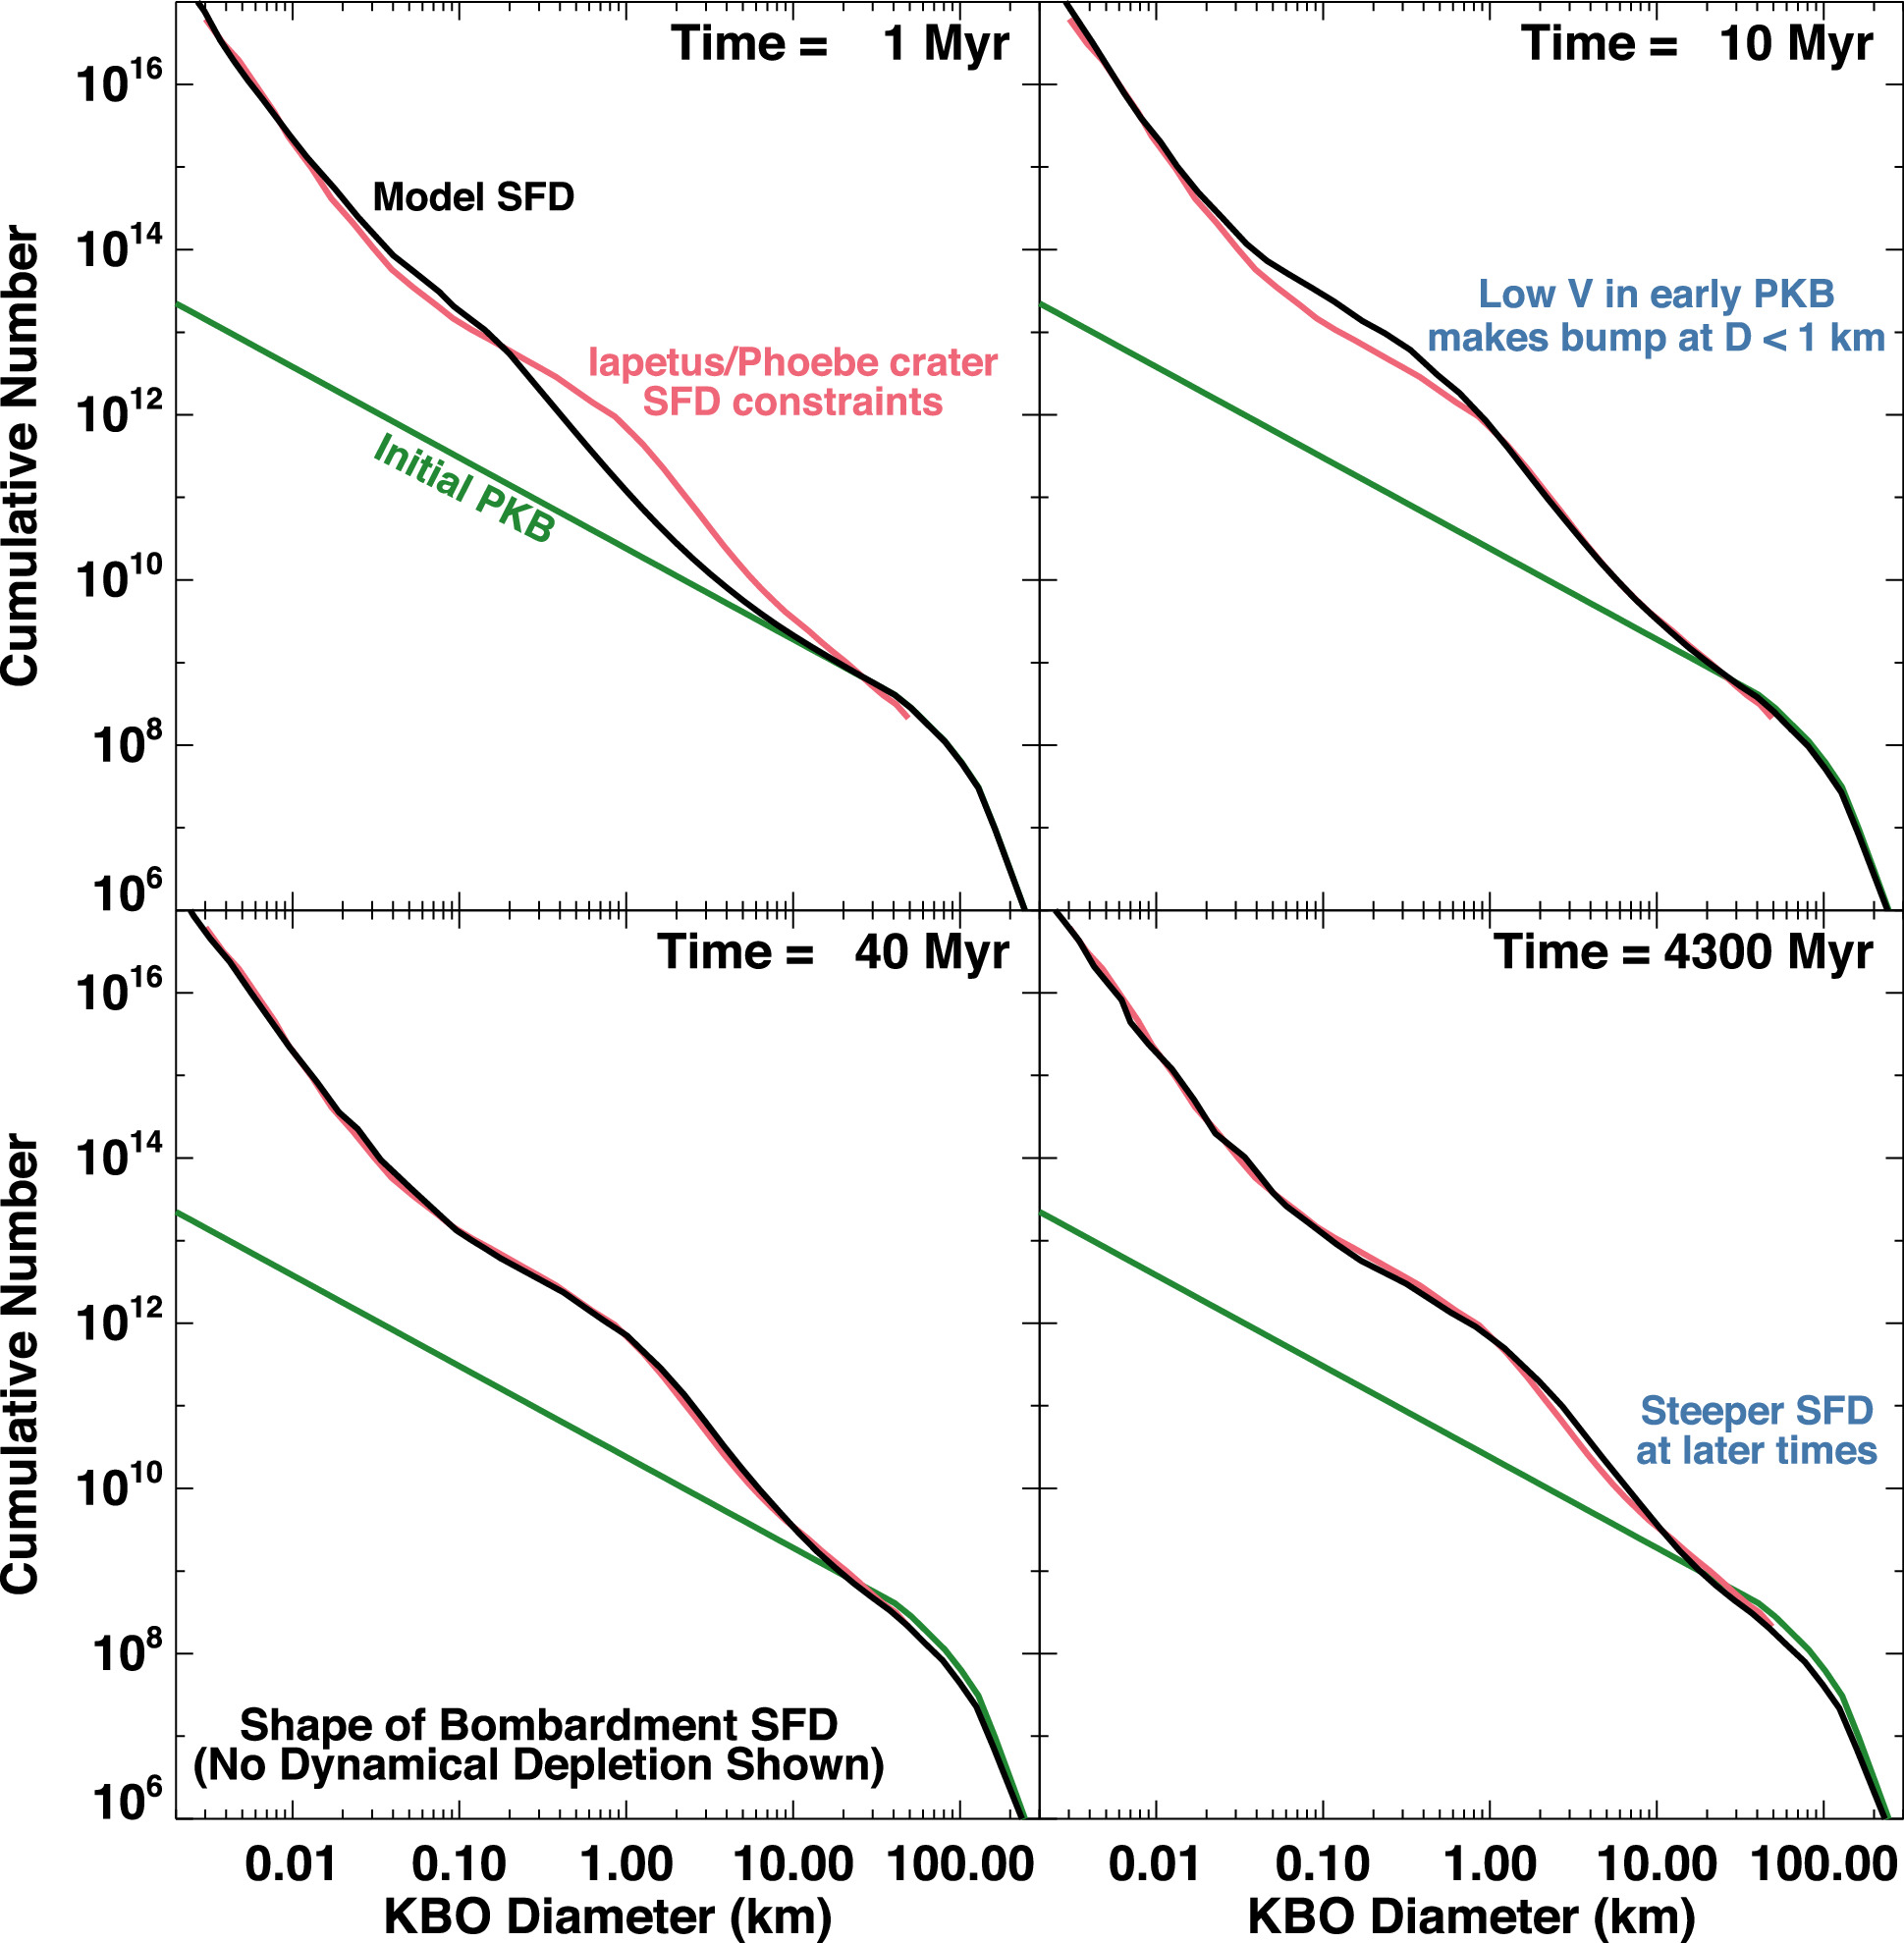
Figure 1. Four snapshots from the collisional evolution of the destabilized population, according to the best-fit run from Bottke et al. (2023). This simulation reproduces the shape of the impactor SFD as determined from Iapetus and Phoebe craters (shown as the red line). Here, Neptune enters the PKB at Δt0 = 10 Myr, while it takes an additional Δt1 = 10.5 Myr to reach 30 au. At 1 Myr, collisional evolution among the D > 100 km bodies creates numerous D < 10 km fragments that undergo a collisional cascade. A sizable bump of fragments is produced at 10 Myr, but low impact velocities within the PKB prevent a good fit to crater constraints. At 40 Myr, the match between the model SFD and crater constraints is excellent. In the last time step, collisional evolution over billions of years has caused the slope of the model SFD between 1 < D < 10 km to become steeper than the red line.
Download figure:
Standard image High-resolution imageOne implication of this choice is that observed comets substantially smaller than 10 km have a strong likelihood of being fragments from collisions. A second implication is that the shape of the heliocentric SFD striking the giant planet satellites is dependent on the nature of our chosen disruption scaling law for PKB objects. In Bottke et al. (2023), the disruption law function used in the collisional evolution code Boulder for PKB bodies was treated as an unknown, and nearly 10,000 different variations were tested.
As Neptune migrated through the densest portion of the PKB, it dynamically ejected 99.9% of the PKB's population onto planet-crossing orbits in what they called the destabilized population. Two different timescales for this behavior were tested in their model: Δt0, the interval between the end of the solar nebula and when Neptune enters the PKB, and Δt1, the interval between Neptune's migration across the PKB and the giant planet instability, which occurs when Neptune approaches ∼28 au. As a reasonable approximation, it was assumed that the earliest bombardment of the giant planet satellites began when Neptune enters the disk, or after Δt0. The formally tested Δt0 values were between 0 and 30 Myr, while the formally tested Δt1 values were 10.5 and 32.5 Myr. Additional tests using Δt0 > 30 Myr did not produce satisfying solutions (see discussion below).
Using the dynamical runs referenced above, Bottke et al. (2023) identified test bodies in the PKB population that would become long-lived members of the scattered disk and those that would be captured as Jupiter Trojans. From there, they calculated the collision probabilities and impact velocities between those test bodies and all other test bodies in the simulation. These values were used as input for the collisional evolution code Boulder, which tracked how the model SFD of the PKB, destabilized population, and Jupiter Trojans evolved with time. To constrain their collisional evolution results, Bottke et al. (2023) assumed that the destabilized population had to reproduce the shapes of the ancient basin and crater SFDs found on Iapetus and Phoebe, respectively, while their model Jupiter Trojans had to reproduce the latest estimates of the observed Trojan SFD. For the former, Bottke et al. (2023) converted the projectile into crater sizes using a crater scaling law verified against crater SFDs on large main belt asteroids such as Ceres and Mathilde (Bottke et al. 2020). Comparisons between model and target SFDs were made using chi-squared methods.
Several trends emerged from their best-fit runs. First, the combined values of Δt0 + Δt1 were close to 30 Myr, with their preferred runs suggesting Δt0 was 10–20 Myr. Those results indicate the earliest bombardment of the giant planet satellites started 10–20 Myr after the gas disk dissipated. This interval also means the PKB undergoes a limited degree of collisional evolution before Neptune starts to migrate across it.
Note that test runs with Δt0 > 30 Myr produce too much collisional evolution within the PKB. The models with such starting conditions were unable to reproduce the shape of the destabilized population's SFD at the right times and/or Jupiter Trojan's SFD in the present day, regardless of the disruption law used. This negative result is consistent with the modeling work of Nesvorný et al. (2018). They showed that Δt0 + Δt1 had to be less than 100 Myr after the loss of the gas disk to explain the capture of the Patroclus–Menoetius (P-M) binary in the Jupiter Trojans. Long Δt0 times allow collisions to destroy too many P-M-like binaries in the PKB, leaving too few to be captured in the Jupiter Trojans.
With that said, we caution that these times are not the last word on this subject. For example, if the PKB took additional time to become excited, perhaps because a small amount of nebular gas was long-lived, there would be less early collisional evolution. That would allow the giant planet instability to take place at a modestly later time to satisfy the constraints in Bottke et al. (2023). For this reason, the reader should be aware that the surface ages calculated here may have some additional variability that depends on when Neptune entered the PKB and when the giant planet instability took place.
Second, the preferred disruption function for KBOs shows that the weakest bodies, from an impact energy per unit mass perspective, were D ∼ 20 m (Figure 1). This allowed D < 20 m objects to develop a Dohnanyi-like SFD with a cumulative power slope near q = −2.7 (Dohnanyi 1969; O'Brien & Greenberg 2003). A Dohnanyi-like steep slope for small objects is effective at disrupting modestly larger objects, which in turn creates a shallow slope of q ∼ −1 between 30 m < D < 1 km. In turn, this shallow branch means fewer projectiles exist to disrupt D > 1 km bodies. Over time, this paucity of disruptions makes a bump of fragments between 1 < D < 10 km, with most objects coming from the disruption of large KBOs. Most comets observed by spacecraft fall within this range. The resultant SFD is left with a shape that resembles Case A from Zahnle et al. (2003), but it also has wavy elements at the small and large ends of the SFD as predicted by Iapetus/Phoebe crater constraints (i.e., the SFD becomes steep for objects smaller than several tens of meters and shallow for objects larger than 10 km, as shown in Figure 1).
In addition, the collisional cascade shown in Figure 1 includes some intriguing features. As time passes, the slope for objects between several km < D < 10 km gradually increases, while the inflection point near D ∼ 1 km slides to D ∼ 2 km. As we will discuss below, this shape change may explain the differences between the crater SFDs found on Callisto and Ganymede (Schenk et al. 2004).
This same trend continues in a more destructive fashion with the Jupiter Trojans, which undergo more collisional evolution than a typical member of the destabilized population. These objects are struck by numerous objects from the massive (but quickly fading) destabilized population both en route to capture and immediately after capture. From there, the bodies undergo ∼4.5 Gyr of additional collision evolution from their fellow Trojans within Lagrange points L4 or L5. Bottke et al. (2023) found these impacts create a slope of q ∼ −2 between 5 < D < 100 km bodies and a "knee," or inflection point, that starts near D ∼1 km but advances with time to D ∼ 5 km. For objects smaller than the knee, the Trojan SFD's slope is shallow like that of the destabilized population (Figure 1). Trojan-like SFDs are not seen in the shapes of the crater SFDs found on the giant planet satellites, so it is a possible indication that the PKB did not start with a Trojan-like SFD.
In Figure 2, we show the model impact rate for bodies in the destabilized population to hit Jupiter over 4.5 Gyr. The results were derived from the numerical simulations of Nesvorný et al. (2013, 2017, 2019), and have been normalized over the total number of Jupiter impacts. Approximately 1.1% of the total PKB population strikes Jupiter over time, with 90% of the impacts occurring within 40 Myr of when Neptune enters the disk. As the destabilized population becomes depleted over billions of years, with most objects ejected from the solar system, the impact rate on the planets and satellite drops by several orders of magnitude. This means the heaviest bombardment of the giant planet satellites should occur at early times.
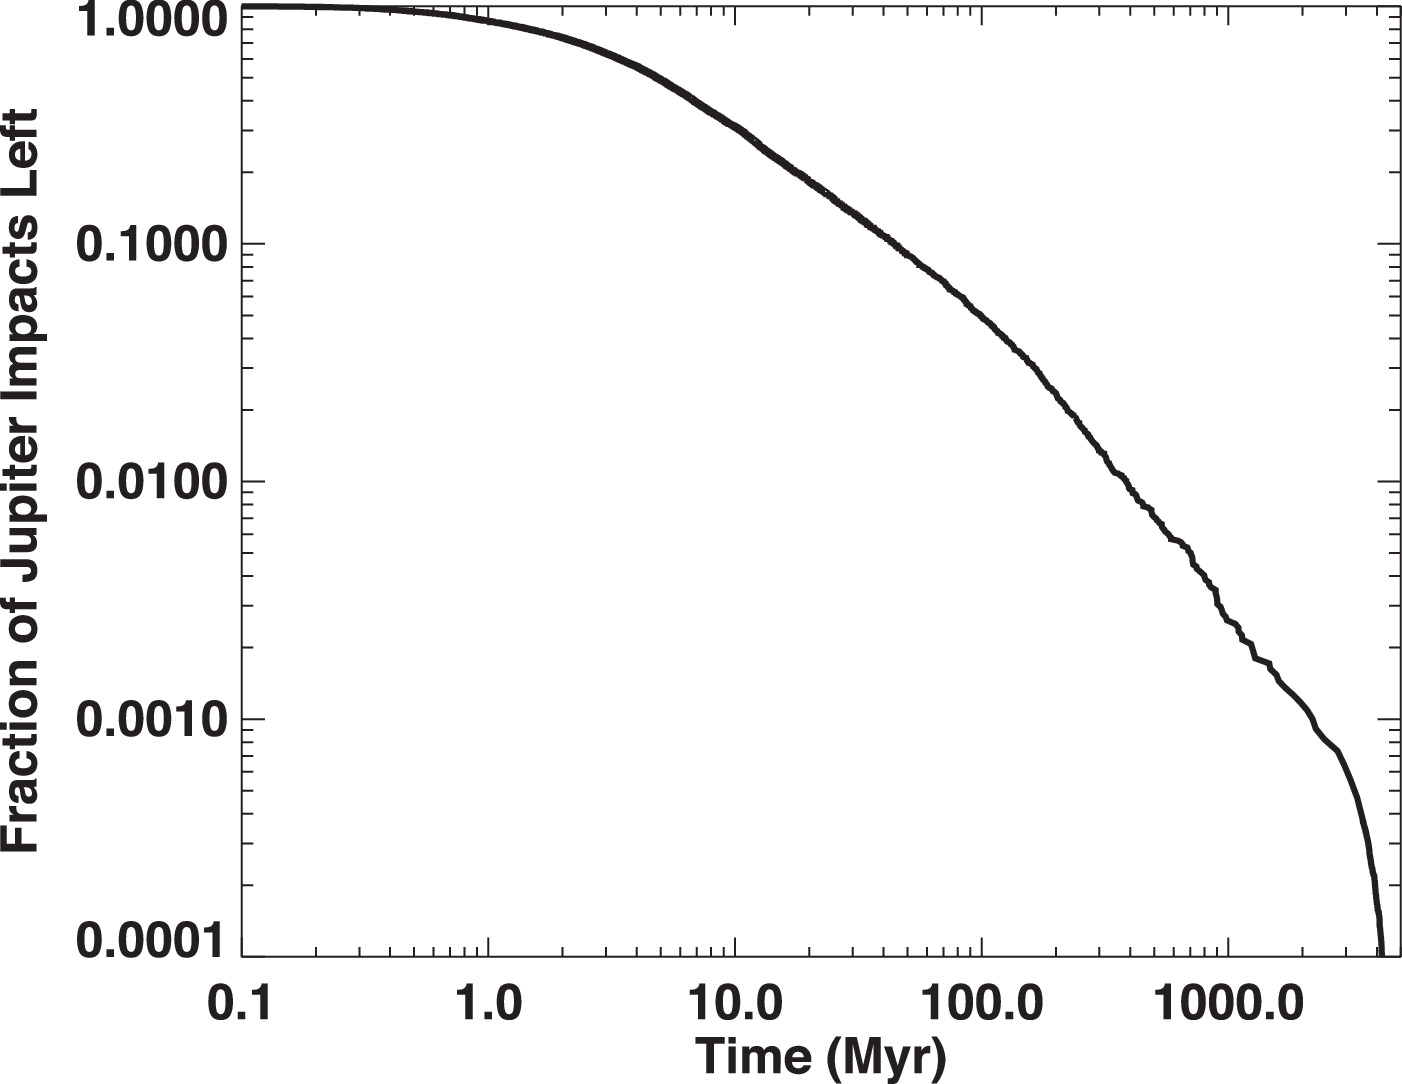
Figure 2. Fractional rate of impacts on Jupiter from the destabilized population and scattered disk. The initial time is when Neptune enters the primordial Kuiper Belt (PKB), some 20 Myr after solar nebula dispersal. Using the numerical simulations described in Nesvorný et al. (2019), we tabulated the number and timing of test bodies striking Jupiter in the aftermath of Neptune's migration across the PKB and the giant planet instability. They found that 1.1% of all test bodies strike Jupiter. Using that value, combined with the model SFDs (Figure 1), it is possible to calculate the impact rate of objects on Jupiter over time.
Download figure:
Standard image High-resolution imageBottke et al. (2023) found that comparisons between their model results and various data sets yielded several interesting outcomes. For example, their estimated impact flux was able to reproduce the trends suggested by the current impact flux on Jupiter from multi-meter-sized bodies (i.e., superbolides) and on Saturn's rings from sub-meter-sized bodies (Hueso et al. 2013, 2018; Tiscareno et al. 2013). Their SFD for the destabilized population at different times was also able to match the debiased shapes of D > 1–2 km objects for Jupiter-family comets (from Bauer et al. 2017) and long period comets (from Boe et al. 2019). The Jupiter-family comets were most consistent with the present-day SFD, while the long period comets matched older, less collisionally evolved SFDs. Finally, Bottke et al. (2023) showed their predicted crater SFD was similar in shape to the crater SFDs found on many satellites of Jupiter, Saturn, and Uranus. This result forms the foundation for our work below.
As a closing caveat, we note that the Bottke et al. (2023) model does not consider tidal disruption in their work. The reason is that the odds that a comet will undergo tidal disruption near a giant planet are lower than that of impacts, particularly for Saturn (Asphaug & Benz 1996; see their Figure 13). For reference, 1.1% of all objects in the destabilized population strike Jupiter, and fewer than 0.33% of all objects hit Saturn, Uranus, or Neptune (Nesvorný et al. 2023). This means tidal disruption affects relatively few objects in the destabilized population.
In addition, only a small fraction of comets traverse deeply enough within the Roche limit of a giant planet to undergo extensive mass shedding (e.g., Shoemaker Levy 9-type disruptions; Asphaug & Benz 1996; Richardson et al. 1998). This helps explain why crater chains, or catena, on Ganymede and Callisto are relatively rare (Schenk 1995). Put together, it seems doubtful that tidal disruption can strongly affect the population that exists at different times in the destabilized population.
3.2. Collision Probabilities and Impact Velocities for the Giant Planet Satellites
The next components needed for our crater production model are the collision probabilities and impact velocities between objects in the destabilized population and the satellites themselves. These values tend to be very small. For example, the probability of a body from the destabilized population hitting Iapetus is the order of ∼10−8; this comes from a combination of the ∼1.1% probability of hitting Jupiter and the approximately one in a million chance of it hitting Iapetus (Zahnle et al. 2003). Those values are tiny enough that several different methods have been used to calculate them in the literature.
Zahnle et al. (2003) used an assessment of the destabilized population from Levison & Duncan (1997), together with Öpik's equations (Shoemaker & Wolfe 1982), to calculate the collision probabilities and impact velocities between test comets on hyperbolic orbits passing through each giant planet system and satellites on circular orbits around the giant planet in question (see Zahnle et al. 1998, 2001 for methodology). For a body on a hyperbolic trajectory, one needs to calculate the volume of space where a collision could take place with the satellite over the net volume traveled by the body within the Hill sphere of the giant planets. This value is then multiplied by the probability both bodies will be in the same place at the same time. The geometric nature of the problem explains why Öpik's equations yield results that are generally similar to calculations using direct numerical integration (e.g., Wong et al. 2019; see below).
The key parameters for the comet impactors in Zahnle et al. (2003) were their periapse distances to each giant planet, their planetocentric eccentricities for their hyperbolic orbits, and their inclinations through the giant planet system, which were assumed to be isotropic. The encounter velocities were derived using the Jupiter impacts calculated by Levison & Duncan (1997). The satellite parameters used in these equations are their semimajor axes around the planet, their sizes, and their orbital and escape velocities. Zahnle et al. (2003) scaled all these results to the fraction of objects hitting Jupiter (their Table 1).
A different method to perform the latter calculation is to numerically track test bodies on hyperbolic orbits through the giant planet systems and thereby directly determine the fraction hitting the satellites. This methodology was used by Wong et al. (2019). They found collision probabilities and impact velocities that were comparable to those of Zahnle et al. (2003). The differences that do exist are probably attributable to the nature of the heliocentric population used to set up the impactors.
Here, we adopt results from a third method used by Nesvorný et al. (2023). Using 106 test bodies from the destabilized population in Nesvorný et al. (2017), they cloned those bodies that came within 23 au of the Sun within the last billion years 50 times and then tracked their encounters within the Hill spheres of the giant planets. From there, they used Equations (3) and (13) from Nesvorný et al. (2004) to compute the collision probability between the test bodies and the moons. This method yields results that are consistent with Öpik's equations (Opik 1951; Zahnle et al. 1998). They also accounted for gravitational focusing by the giant planets and the fact that the sizes of the giant planets can shield the moons from impacts. Additional modifications accounted for how comets may disrupt near the Sun, which we will not use in this paper.
The primary variable in all three sets of calculations comes from the mean encounter velocity at infinity for the heliocentric projectiles. Lower velocities mean more gravitational focusing and better collision odds for inner satellites, but lower collision odds for the outer satellites where gravitational focusing is less important. Accordingly, because Nesvorný et al. (2017) used a more excited destabilized population than the one determined by Levison & Duncan (1997), they found a flatter collision probability distribution for the giant planet satellites than Zahnle et al. (2003; i.e., modestly higher and lower impact probabilities for the outer and inner moons, respectively).
Note that the collision probabilities and impact velocities between bodies entering the Hill sphere of a giant planet and the satellites themselves should also change during giant planet migration. For example, if a giant planet is closer to the Sun than at present, objects will generally have higher encounter velocities with it (i.e., Keplerian motion means objects closer to the Sun travel at higher velocities). This change is short-lived, though, because giant planet migration is largely complete within a few Myr after the giant planet instability.
For the model used in this paper, we find that the crater history of most worlds does not start until close in time or well after that of the giant planet instability, which means the giant planets have largely reached their current orbits. At that point, we expect the encounter velocity distribution of the destabilized population with Jupiter, Saturn, and Uranus at early times to be comparable to what currently exists for objects coming from the scattered disk. The reason is that all of the objects reaching Jupiter, Saturn, or Uranus, either in the deep past or today, must first pass by Neptune, with Neptune encounters controlling the process. Confirming the velocity distribution is identical in these cases, however, would require a large numerical campaign and is beyond the scope of this paper.
Accordingly, we consider it a reasonable approximation to use the collision probabilities and impact velocities provided in Nesvorný et al. (2023) for our work. These values can be found in Table 1, and they are given with respect to the impact probability on Jupiter.
Table 1. The Collision Probabilities, Impact Velocities, and Surface Ages for the Giant Planet Satellites of Jupiter, Saturn, Uranus, and Neptune Discussed in This Paper
| Satellite | a (Jovian planet radii) | e | i | Radius | Surface Gravity | Bulk Density | Prob. of Satellite Impact | Impact Velocity | Model Age | Model Age |
|---|---|---|---|---|---|---|---|---|---|---|
| (deg) | (km) | (cm s−2) | (g cm−3) | (km s−1) | (Myr ago) | (Myr after gas disk dissipation) | ||||
| Io | 5.91 | 0.004 | 0.04 | 1818 | 181 | 3.53 | 1.1 × 10⁻⁴ | 31.6 | N/A | N/A |
| Europa | 9.40 | 0.009 | 0.466 | 1565 | 130 | 2.99 | 5.9 × 10⁻⁵ | 25.4 | 180 [+50, −40] | 4380 [+40, −50] |
| Ganymede | 14.97 | 0.001 | 0.177 | 2631 | 143 | 1.94 | 9.7 × 10⁻⁴ | 20.3 | 3360 [+100, −100] | 1200 [+100, −100] |
| Callisto | 26.3 | 0.007 | 0.192 | 2410 | 125 | 1.83 | 5.7 × 10⁻⁵ | 16.0 | 4080 [+70, −110] | 480 [+110, −70] |
| Prometheus | 2.28 | 0.002 | 0.0 | 42.8 | 0.8 | 0.48 | 6.5 × 10⁻⁸ | 29.6 | 4330 [+20, −40] | 230 [+40, −20] |
| Pandora | 2.35 | 0.004 | 0.05 | 40.7 | 0.7 | 0.49 | 5.6 × 10⁻⁸ | 29.6 | 4360 [+40, −20] | 200 [+20, −40] |
| Epimetheus | 2.51 | 0.009 | 0.34 | 58.1 | 1.0 | 0.63 | 1.3 × 10⁻⁷ | 29.1 | 4370 [+30, −40] | 190 [+40, −30] |
| Janus | 2.51 | 0.007 | 0.14 | 89.5 | 1.6 | 0.65 | 2.7 × 10⁻⁷ | 28.6 | 4410 [+20, −20] | 150 [+20, −20] |
| Mimas | 3.08 | 0.020 | 1.574 | 198 | 6.5 | 1.15 | 1.1 × 10⁻⁶ | 26.2 | 4160 [+100, −200] | 400 [+200, −100] |
| Enceladus | 3.95 | 0.004 | 0.003 | 252 | 8.5 | 1.61 | 1.5 × 10⁻⁶ | 23.1 | 4060 [+100, −200] | 500 [200, −100] |
| Tethys | 4.89 | 0.000 | 1.091 | 531 | 18.5 | 0.96 | 6.0 × 10⁻⁶ | 21.0 | 4280 [+70, −120] | 280 [+120, −70] |
| Calypso | 4.89 | 0.0 | 1.1 | 10.7 | 0.28 | 1.0 | 3.3 × 10⁻⁹ | 21.0 | 4490 [+10, −40] | 70 [+40, −10] |
| Telesto | 4.89 | 0.0 | 1.0 | 12.4 | 0.28 | 1.0 | 2.4 × 10⁻⁹ | 21.0 | 4500 [+10, −20] | 60 [+20, −10] |
| Dione | 6.26 | 0.002 | 0.028 | 561 | 22.4 | 1.48 | 5.6 × 10⁻⁶ | 18.7 | 4300 [+50, −70] | 260 [+70, −50] |
| Helene | 6.26 | 0.005 | 0.15 | 17.6 | 0.4 | 1.5 | 6.2 × 10⁻⁹ | 18.7 | 4510 [+10, −20] | 50 [+20, −10] |
| Rhea | 8.74 | 0.000 | 0.333 | 764 | 28.5 | 1.24 | 7.8 × 10⁻⁶ | 15.8 | 4430 [+20, −30] | 130 [+30, −20] |
| Titan | 20.37 | 0.029 | 0.306 | 2575 | 135 | 1.88 | 4.8 × 10⁻⁵ | 11.2 | 1760 [+500, −600] | 2800 [+600, −500] |
| Hyperion | 24.58 | 0.104 | 0.4 | 135 | 4.3 | 0.54 | 1.0 × 10⁻⁷ | 10.4 | 4526 [+6, −11] | 34 [+11, −6] |
| Iapetus | 59.09 | 0.028 | 14.7 | 734 | 24 | 1.09 | 1.6 × 10⁻⁶ | 7.9 | 4531 [+3, −5] | 29 [+5, −3] |
| Phoebe | 215 | 0.163 | 150 | 107 | 3.7 | 1.63 | 1.8 × 10⁻⁸ | 7.1 | 4539 | 21 |
| Miranda | 5.082 | 0.001 | 4.338 | 236 | 8.1 | 1.20 | 3.5 × 10⁻⁶ | 12.7 | 4260 [+60, −90] | 300 [+90, −60] |
| Ariel | 7.469 | 0.001 | 0.041 | 579 | 29 | 1.66 | 1.4 × 10⁻⁵ | 10.6 | 4060 [+200, −400] | 500 [+400, −200] |
| Umbriel | 10.41 | 0.004 | 0.128 | 585 | 22 | 1.40 | 1.3 × 10⁻⁵ | 9.2 | 4450 [+10, −20] | 110 [+20, −10] |
| Titania | 17.07 | 0.001 | 0.079 | 789 | 36 | 1.71 | 1.3 × 10⁻⁵ | 7.3 | 4460 [+20, −30] | 100 [+30, −20] |
| Oberon | 22.83 | 0.001 | 0.068 | 761 | 32 | 1.63 | 1.0 × 10⁻⁵ | 6.5 | 4520 [+4, −4] | 40 [+4, −4] |
| Triton | 14.33 | 0.000 | 156.9 | 1353 | 78 | 2.06 | 8.2 × 10⁻⁵ | 8.1 | N/A | N/A |
Note. The values of semimajor axis (a), eccentricity (e), and inclination (i), radius, and density of each satellite come from Chen et al. (2014), Buratti & Thomas (2014), with the former superseding the latter where differences exist. The semimajor axes are scaled by the radius of the host giant planet for each satellite. The gravity data comes from Table 1 of Zahnle et al. (2003). The collision probabilities and impact velocities are taken from Nesvorný et al. (2023). The former values are given with respect to the impact probability on Jupiter, and they assume no comet disruption takes place.
Download table as: ASCIITypeset image
3.3. Crater Scaling Laws for the Giant Planet Satellites
3.3.1. Formulation for Small and Midsized Satellites
The crater scaling law used in this work comes from Holsapple & Housen (2007). It is based on Pi-group scaling relationships and has the following form:
In Equation (1), the transient crater diameter, defined by Dt, is found by inserting various impactor properties (impactor diameter d, velocity perpendicular to the surface Vp, bulk density δ) and target properties (density of target material ρ, strength of target material Y, surface gravity g). Additional dimensionless parameters, such as k, ν, μ, and the yield strength Y, correspond to the nature of the target terrain, namely whether the surface of a given giant planet satellite can be characterized as cold ice, cohesive soil/ice, porous materials, etc. Some of the suggested values for these parameters can be found in Table 1 of Holsapple (2022). The input parameters we will use for the giant planet satellites are discussed in Section 3.3.2.
Sizable transient craters also experience enlargement after formation. For example, most simple craters become modestly wider via debris sliding of the oversteepened transient crater rim walls (e.g., Johnson et al. 2016). For simple craters, this collapse into a final crater size has the form of the following:

We note that this relationship was successfully used to model crater SFDs on D > 10 km asteroids observed by spacecraft (Marchi et al. 2016; Bottke et al. 2020).
For midsized and larger satellites, simple craters beyond some threshold size collapse into complex ones, which makes them even broader and shallower. The simple to complex transition size (DSC) for icy worlds has been estimated from empirical data by Aponte-Hernández et al. (2021), and it follows the following relationship:

where DSC is in kilometers, and the surface gravity g is in centimeters per square second. Using this parameter, the complex crater scaling relationship can be written as follows:

and is used when Dt > DSC (Johnson et al. 2016). The values γ and η are empirically determined constants, with γ = 1.25, and η = 0.13 suggested by Johnson et al. (2016). Here, we will use γ = 1.2, partly to keep Equation (3) consistent with Equation (2) but also because we will model craters on bodies comparable in size to many spacecraft-observed asteroids (e.g., Bottke et al. 2020).
3.3.2. Choosing Scaling Law Parameters for Small and Midsized Satellites
A complication in generating a crater production model for the small and midsized satellites is choosing the right input parameters for Equation (1). The physical properties of their near-surface materials are unknown as far as the input values needed for cratering mechanics. Given this gap in our knowledge, the best we can do is interpret the solar system data that exist and make inferences where possible.
In work building up to this project, we tested a wide range of scaling law possibilities for the small and midsized satellites. In the input parameters for Equation (1), we have assumed that near-surface ice acts like water, dry sand, dry soil, wet soil, hard soils, hard rock, lunar regolith, and cold ice (e.g., see Table 1 in Holsapple 2022). These values correspond to a wide range of k (from 0.7 to 2.2), μ (from 0.40 to 0.55), and Y values (from 0 to 15 MPa). Intermediate values between different kinds of materials, such as hard rock and cold ice, also seem plausible, so they were examined as well. The problem is that, a priori, it is not clear which type of material is best suited for our purposes. The porosity and consolidated nature of near-surface ice on the giant planet satellites is unknown. Overall, these materials yield a variety of options, with the ratio of crater to projectile sizes, a parameter we call f, going from values near 2 to more than 50 (and beyond). The issue is how to winnow these possibilities and argue one set of parameters is better than another.
As an example of some choices discussed in the literature, consider the crater scaling functions shown in Figure 19.3 of Dones et al. (2009). They use impact velocities from Zahnle et al. (2003) and satellite surface materials consistent with competent ice. In their results, a 1 km diameter comet striking Iapetus, Rhea, and Mimas at their chosen mean impact velocities makes a crater that is approximately 12, 17, and 30 km in diameter, respectively, while a 5 km comet makes a crater that is 47, 69, and 126 km in diameter, respectively. This result suggests that crater SFDs on the innermost moons of Saturn, with f near 30, should have much larger craters than those on the more distant moons for the same projectile SFD, with f near 10. This should translate into a rightward shift of a factor of ∼3 between the observed crater SFDs on the innermost worlds compared to those on the outermost ones.
Curiously, such a change is not obvious from the crater SFDs themselves (Bottke et al. 2023; see their Figure 14). Instead, the shapes of observed crater SFDs of the Saturn system are arguably similar to one another when superposed on one another. In our testing, we found that near-surface ice that is cold and similar to hard, consolidated, rock-like materials can reproduce this property (e.g., see input parameters in Holsapple 2022). This observation is useful, but it is still insufficient to allow to choose a preferred crater scaling law from countless possibilities.
At this point, we decided to examine worlds that are arguably similar to the midsized satellites in terms of how they react to collisions. For example, (1) Ceres, the largest main belt asteroid, is a 940 km diameter carbonaceous chondrite-like world that probably formed in the giant planet zone (e.g., De Sanctis et al. 2015; Singh et al. 2021). It is a probable ocean world as well, making it a potential match to many giant planet satellites (e.g., Fu et al. 2017; De Sanctis et al. 2020; Park et al. 2020; Raymond et al. 2020; Schmidt et al. 2020). Note that most midsized satellites in our Table 1 have comparable sizes and gravitational accelerations to (1) Ceres. In addition, Ceres's craters have depths to diameter ratios that are comparable to those on the midsized satellites (Schenk et al. 2021). These factors imply that a crater scaling law that works for Ceres may also be reasonable for the midsized satellites.
This takes us to the crater SFDs found on spacecraft-observed asteroids. Most of the projectiles striking these bodies are from the main asteroid belt, which is dominated by carbonaceous chondrite-like materials (e.g., Masiero et al. 2013). The shape of the main belt SFD is also well defined through a combination of ground-based observations and model predictions (Bottke et al. 2020). The combination has made it possible to solve for the scaling law affecting asteroids by comparing the wavy shapes of the projectile SFD to those of crater SFDs. Using Equations (1) and (2), Bottke et al. (2020) found they could reproduce observations if their target bodies had surfaces analogous to hard soils, with k = 1.03, ν = 0.4, μ = 0.41, and yield strength Y = 2 × 10⁷ dynes cm−2 (2 MPa). In particular, their results worked for the crater SFDs on Ceres and (253) Mathilde, a ∼50 km diameter carbonaceous asteroid. Mathilde's size and physical properties potentially make it a good analog for the small satellites listed in Table 1.
Given that the scaling law used in Bottke et al. (2020) worked on Ceres and Mathilde, Bottke et al. (2023) tested whether it could also be used for the small and midsized giant planet satellites. Their gravity values came from Table 1 of Zahnle et al. (2003), while their impact velocities came from Nesvorný et al. (2023). They also assumed that the bulk density values of the projectiles and near-surface ice for the giant planet satellites were comparable to one another, allowing these values to cancel out in Equation (1). This approximation assumes that comets from the destabilized population make craters in bodies whose near-surface materials are akin to an icy megaregolith. Note that they did not include the crater enlargement factors from Equations (3) and (4), but this factor would only modestly change the sizes of the largest craters. Their results, shown in their Figures 13–15, show many good matches between model and data over a variety of satellite sizes.
Given this success, and that this scaling law yields results comparable to what one would get from impactors striking cold ice (i.e., cold ice arguably acts like hard, consolidated, rock-like materials), we opted to use the same crater scaling law as Bottke et al. (2020), with Equations (3) and (4) included, for all but the largest satellites. While Ceres and Mathilde are not identical to the surfaces of the small and midsized satellites, we argue their near-surface materials act in similar ways when hit by main belt impactors.
A caveat on this approximation is that our adopted crater scaling law does not work well for large, cratered surfaces on Ganymede. This problem led us to adopt a new crater scaling law function for the largest satellites Europa, Ganymede, Callisto, and Titan. The rationale for this change is easier to justify after we have presented our results for the small and midsized satellites, so it will be discussed in Section 5.6.
All of the crater scaling relationships used in this paper are shown in Figure 3. The midsized Saturnian satellites are in panel (a), the midsized Uranian satellites are in panel (b), the small satellites of Saturn are in panel (c), and the largest satellites are in panel (d). For panels (a)–(c), the ratio between crater and impactor diameters is relatively flat as a function of impactor size, with most values found to be between 10 and 18. The differences between the lines are caused by individual target gravities and impactor velocities. The small kink seen in panels (a) and (b) at larger impactor sizes comes from the simple to complex crater transition defined by Equations (3) and (4).
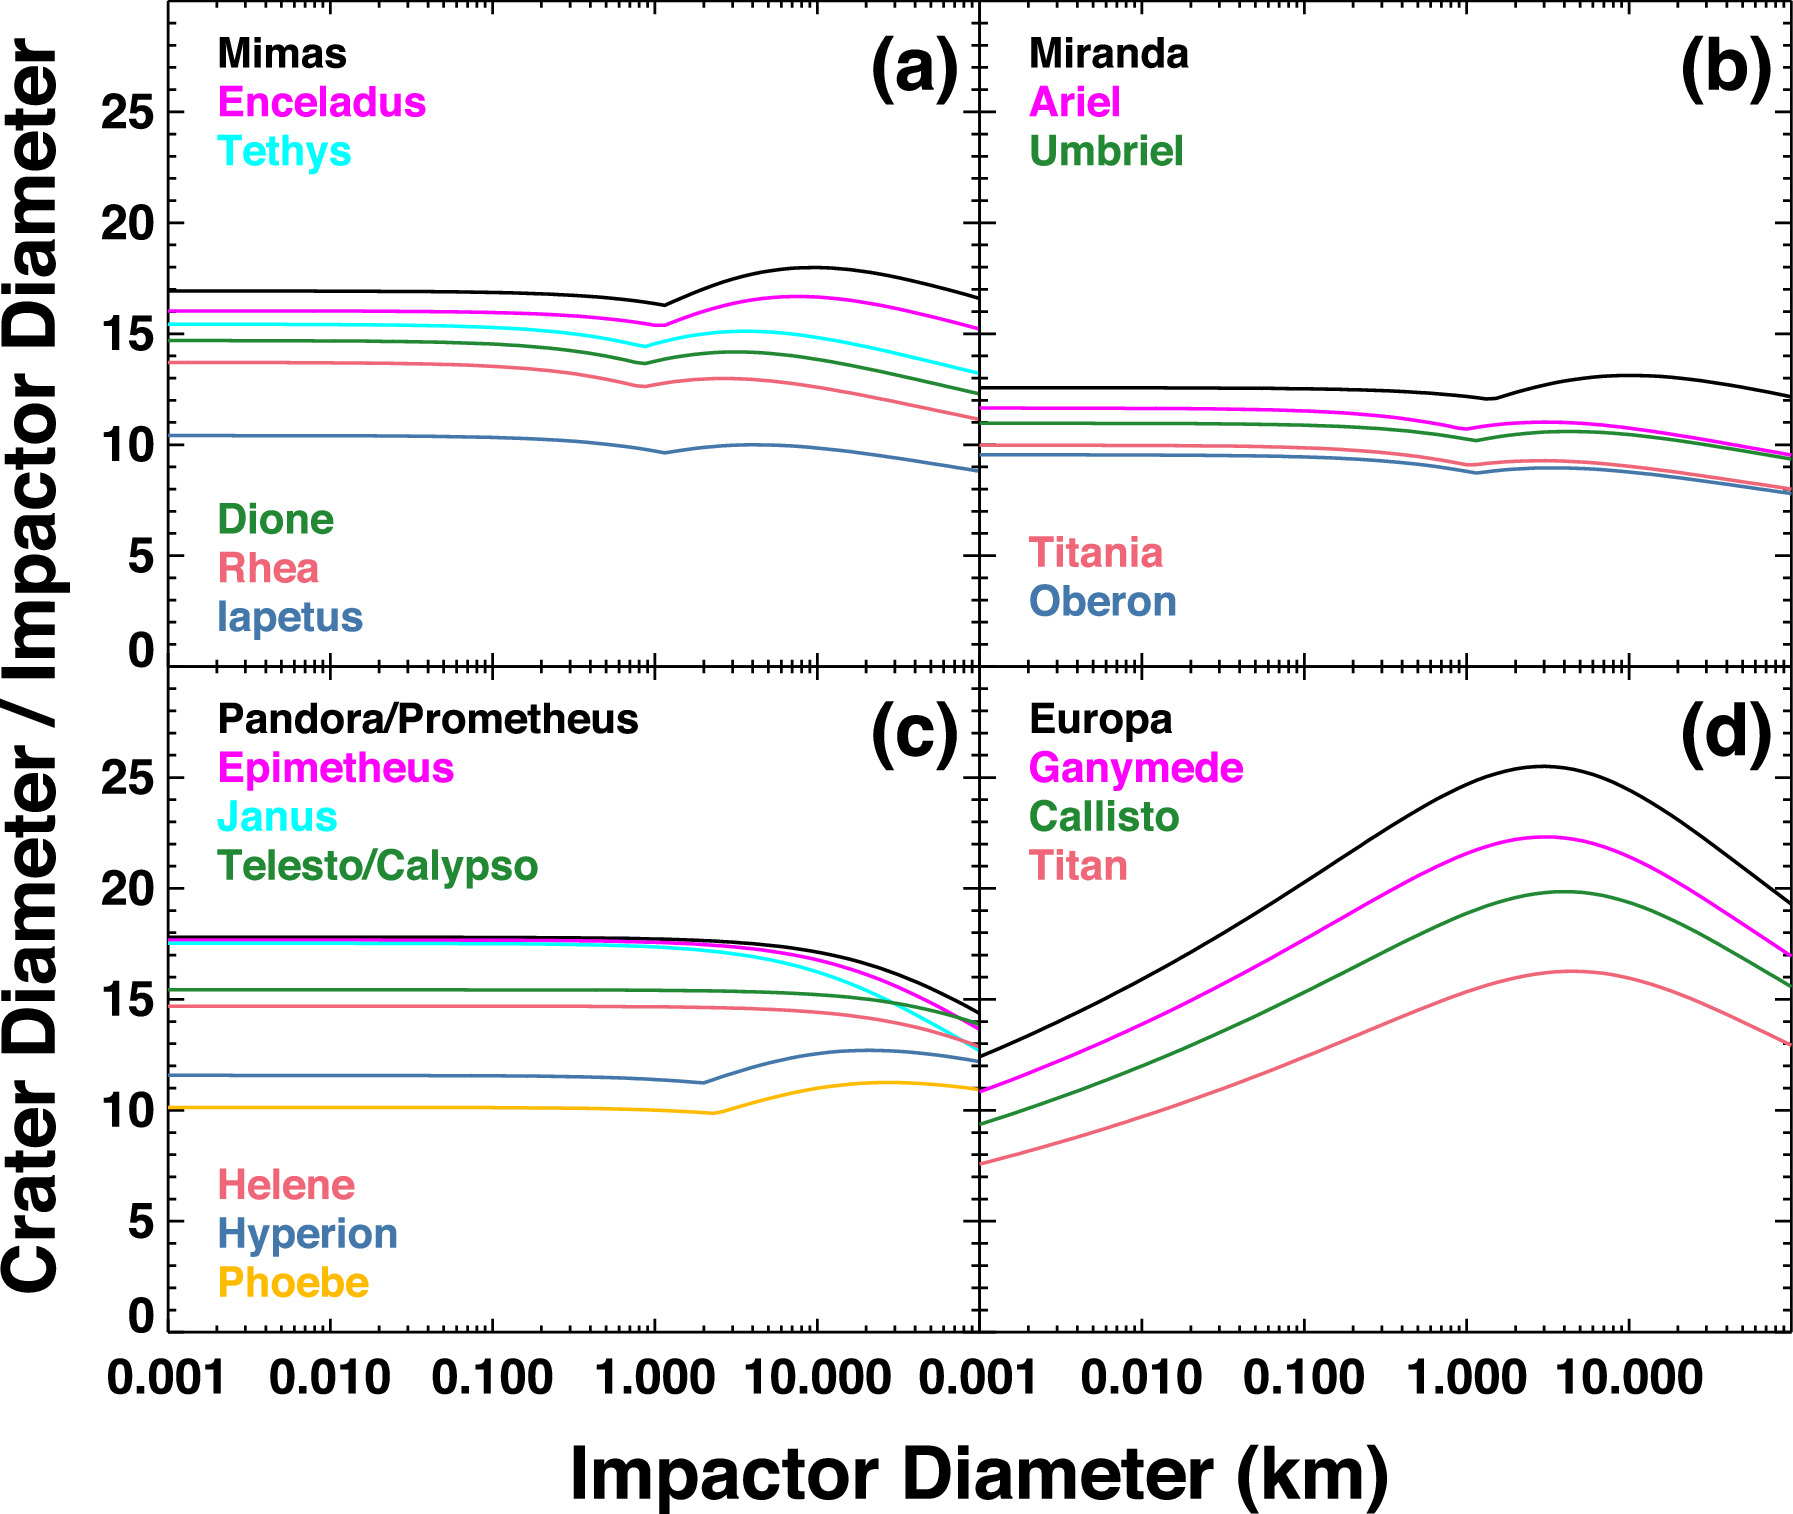
Figure 3. The crater scaling law relationships for the giant planet satellites discussed in this paper. The scaling laws for the small and midsized sized satellites in (a), (b), and (c) are discussed in Section 3.3, while those for the giant satellites in (d) are in Section 5.6. The kinks seen in several of the curves show the transition from simple to complex craters.
Download figure:
Standard image High-resolution imageIn summary, for the small and midsized satellites investigated in this paper, we will use Equations (1)–(4) as follows:
- 1.
- 2.
3.4. Crater Saturation
Many old regions on the giant planet satellites are close to a state called saturation equilibrium (e.g., Gault 1970; Melosh 1989). This describes a surface with such high crater spatial densities that new craters cannot form without removing older craters. This keeps the crater population in an equilibrium of sorts for modest-sized craters, although the largest craters will occasionally clean off large areas via cookie cutting erasure. Modeling work indicates that equilibrium crater SFDs may eventually evolve into shapes discordant with our production SFD, although we have yet to identify obvious cases of this situation in this paper.
A possible end state for saturation equilibrium is an impact large enough to produce a surface reset event. For icy moons, this might mean global terrains being erased via melting, shattering of the body, or even the catastrophic disruption of the body. Crater production then begins anew when the new surface stabilizes.
We point out that the crater SFDs for several satellites used in this paper are an amalgamation of two types of crater counts: terrains with high crater spatial densities that include a wide range of crater sizes, and global counts of the largest craters and impact basins. The threshold size between the two is Dcrat ∼ 100 km (e.g., midsized Saturnian satellites; Kirchoff & Schenk 2010). To interpret that data, it is useful to consider a thought experiment.
Imagine an ancient moon with no active geology. We will give it a regional terrain that is in equilibrium saturation to some unknown level with Dcrat < 50–100 km craters. The act of barely reaching saturation on that regional terrain means that N basins with Dcrat > 100 km form globally across the moon. We will assume these basins are so large that they are hard to erase.
Using a Monte Carlo code, we want to model this world's crater history. Random deviates will be used to choose the location and size of each simulated crater, with the latter drawn from a predefined crater production SFD. Choosing a new random seed means a different sequence of craters are formed on the surface, so each trial will yield modestly different results.
In general, Monte Carlo crater models show the largest craters are the least likely to reach saturation (e.g., Marchi et al. 2012). So, according to the formulation above, if the number of globally distributed basins is close to N, one could argue that the regional terrain is barely in saturation. On the other hand, values of 2N, 3N, and 4N mean the regional terrain has likely been saturated two, three, and four times over on average, although stochastic variations may complicate this story. The more craters that form, however, the greater likelihood that an impactor large enough to produce a global reset event will take place. In fact, depending on the probabilities, it may be unlikely to reach 2N, 3N, and 4N without getting a reset event.
As we will show below, we suspect this is the case for most giant planet satellites with regional crater SFDs near saturation. So far, we have yet to find evidence of a substantial mismatch between our combined crater SFDs and our crater production model for Dcrat > 20 km or so. That suggests that the ancient regional surfaces are only barely in crater saturation. A plausible reason is that the projectile SFD for D > 10 km, which makes Dcrat > 100 km basins (Figure 3), has a shallow power-law slope (Figure 1). From a Monte Carlo perspective, when one draws random impactors from such a projectile SFD, the likelihood of getting a very large impactor and a surface reset event is relatively high.
The situation may be different for a few small worlds like Pandora, Prometheus, etc., whose largest craters are often near Dcrat < 10 km (Thomas et al. 2013). To test what happens, in a limited fashion, we investigated crater saturation on a small world using an improved version of the crater formation/evolution model discussed in Marchi et al. (2012). It simulates the random formation of craters on a square surface according to an input production function. Craters are defined by their rims, and when more than 70% of a crater's rim is removed by overlapping craters, the crater is removed from the count. The code is similar to several in the literature (Woronow 1985; Chapman & McKinnon 1986; Richardson 2009) and has been calibrated against saturated terrain in the Sinus Medii region (Gault 1970).
We found equilibrium saturation is often difficult to determine for certain small satellites because Dcrat < 10 km craters, often made by D < 1 km projectiles (Figure 3), follow a shallow power-law slope (Figure 1). Our model indicates that few craters can form with those sizes on observed terrains before a large crater erases much of the population. As we show below, this may explain what happened to the smallest observed craters on Hyperion, with the crater SFD offset from model expectations compared with those of larger craters (Section 5.1). For modestly larger worlds, however, the observed size range of craters is more or less consistent with the shape of the crater production function, at least for Dcrat > 20 km craters.
Accordingly, we argue that our model surface ages, for both small and large bodies, are probably describing the interval since the last global reset event, with crater saturation less concerning than it might be if we were dealing with planet-sized worlds. Additional modeling of crater saturation and resurfacing events on the giant planet satellites will be needed to better quantify this issue.
3.5. Apex–Antapex Differences in Crater Populations
We close this section by briefly discussing apex–antapex asymmetries in cratering between the leading and trailing sides of satellites. Once a satellite achieves synchronous rotation, its leading hemisphere (apex) should be hit by more projectiles than its trailing hemisphere (antapex). For the giant planet satellites, the predicted asymmetries are expected to be pronounced, yet they are not observed (e.g., Zahnle et al. 2001).
The most common solution cited to explain why we do not see this difference is nonsynchronous rotation of the satellites (e.g., Zahnle et al. 2003; Kirchoff & Schenk 2010). Here, the surfaces and interiors are decoupled from one another, perhaps because some bodies possess a subsurface ocean (e.g., Ashkenazy et al. 2023). Another possibility is that large impacts cause the near surface to break synchronous lock before being recaptured in it, as may have happened with the Moon (e.g., Wieczorek & Le Feuvre 2009). If so, the apex and antapex directions may have flipped multiple times over a satellite's history, which would muddle the expected crater asymmetry.
A third possibility is that most impactors are produced by planetocentric debris, which potentially could strike a surface in a more symmetric manner (e.g., Horedt & Neukum 1984). While there are no obvious sources of planetocentric impactors in the Jupiter system, they could be more important in the Saturn, Uranus, and Neptune systems (Zahnle et al. 2003).
4. Net Impacts on the Giant Planet Satellites from the Destabilized Population
To provide context for our crater surface ages, and how they might be interpreted, it is useful to start by showing the cumulative number of impacts that occur on the giant planet satellites from the destabilized population and scattered disk. This calculation would be straightforward if the impacting SFD had a shape that was constant with time; we would compute the impact flux for a given satellite by multiplying it by the fraction of test bodies in our giant planet instability model that strike Jupiter (∼1.1%) and then by the collision probability for that satellite with respect to the impact probability on Jupiter (Table 1).
A complicating issue, however, is that the destabilized population's SFD is changing with time from the collisional evolution. Our method to derive this function is to integrate the net bombardment backwards in time from the present day. First, we multiplied the evolving SFDs in our model (Figure 1) by the fractional Jupiter impact rates appropriate for their output time (Figure 2). Next, we determined the mean difference between the projectile SFD from the youngest output time step (i.e., the time nearest the present day) and the next youngest time step. This represents the projectile SFD produced in that time interval (Δt). Moving backward in time, we repeated this procedure until we reached the time when Neptune enters the PKB. For the model used here, that occurs at 20 Myr after the gas disk dissipates (Bottke et al. 2023). In other words, that is the oldest possible satellite age in our model. With the integrated model SFD in hand, we obtained the net bombardment on the satellites by multiplying them by the collision probabilities discussed above. Note that these same results can be turned into a model crater production function by running the projectiles through our chosen crater scaling law (Sections 3.3, 5.6).
The cumulative number of impacts that occur on the giant planet satellites is shown in Figure 4. Rather than show a line for every satellite, which would make the plot difficult to read and annotate, we have instead grouped the satellites by similar collision probabilities. The legend on the plot gives the rank order of how often the satellites are hit; the top of the filled curve corresponds to the first satellite, while the last one gives the bottom. The issue of stochastic effects for large impactors on these worlds will be addressed in Section 6.

Figure 4. The cumulative size frequency distribution (SFD) of all projectiles striking the giant planet satellites from the clearing of the primordial Kuiper Belt (PKB). The bombardment starts when Neptune enters the PKB at Δt0 = 20 Myr. The satellites have been grouped according to collision probability (Table 1), with the first name in each group corresponding to the top of the annulus, and the last name corresponding to the bottom of the annulus. The other names in each set are placed in order of collision probability. The largest mean impact to occur is represented by the dashed black line. Here, we find that all midsized and larger satellites are likely to be hit by at least one object with D > 90 km. These events are likely to produce global erasure events.
Download figure:
Standard image High-resolution imageWe find that the largest satellites of the giant planets—Io, Ganymede, Triton, Europa, Callisto, and Titan—are hit by many tens of D > 100 km bodies, with the largest mean impactor being the order of several hundreds of kilometers. As we will discuss in Section 5.6, and show in Figure 3, these impactors would likely create basin diameters larger than those observed. For example, the largest accepted impact structure on these giant moons is the Valhalla basin on Callisto. It is the order of ∼1000 km in diameter, although its ring system is larger, and is classified as a palimpsest, defined as a rimless crater with low relief that lacks a central peak (Smith et al. 1979; Schenk 1995; Schenk et al. 2004; Barata et al. 2012). Smaller palimpsests have also been identified on Ganymede and Callisto.
With that said, there is intriguing evidence that the remnants of a megaimpact structure larger than Valhalla may exist on Ganymede. An analysis of furrows on that world, defined as a concentric system of tectonic troughs, showed that they are part of a global concentric circular structure. The furrows themselves are only found on the oldest heavily cratered terrains (which are also the darkest terrains; Moore et al. 2004; also see Bottke et al. 2013). While they only make up about a third of Ganymede's entire surface, the furrow structure has been interpreted to be the byproduct of a global-scale multiring system formed by a single ancient impact event (Hirata et al. 2020). If true, it is the largest impact structure identified so far in the solar system and the oldest recognizable surface feature on Ganymede (Passey & Shoemaker 1982; Hirata et al. 2020).
The scale of the furrow system on Ganymede is roughly 4 times larger than that of the Valhalla ring system; the Valhalla ring system extends in radius 360 km < R < 1900 km, while the furrow system on Ganymede is 1380 km < R < 7800 km. Numerical hydrocode simulations suggest this system could be produced by an impactor that was 100–300 km in diameter (Hirata et al. 2020). These projectile sizes are comparable to the estimated sizes of the largest mean projectiles in Figure 4.
A Valhalla-like impact feature may also exist on Titan. An analysis of radar images from the Cassini mission suggests that a highly eroded ∼700 km diameter impact basin might be present in the western Xanadu province, with basin rings extending to ∼1800 km (Brown et al. 2011). This feature could mean Titan's icy crust, while experiencing considerable local- or regional-scale erasure from tectonic and fluvial processes, is roughly as old as the most ancient regions of Ganymede or Callisto. On the other hand, supporting evidence in the form of concentric or radially aligned features has yet to be identified (Radebaugh et al. 2011; Langhans et al. 2013). New data, possibly from NASA's Dragonfly mission to Titan, scheduled to land in 2034, may help to resolve this issue.
Midsized satellites such as Ariel, Titania, Umbriel, Oberon, Rhea, Tethys, Dione, and Miranda were likely hit by multiple D > 100 km bodies (Figure 4). The basins expected to be formed by these projectiles far exceed the largest impact craters found of several of these worlds, including Tethys' Odysseus basin (Dcrat = 445 km), Dione's Evander basin (Dcrat = 350 km), and Rhea's Mamaldi basin (Dcrat = 480 km) (Figure 3). For smaller satellites like Miranda, these projectile sizes are large enough to produce catastrophic disruption events (e.g., Smith et al. 1982; Movshovitz et al. 2015, 2016). We will return to the topic in Section 6.5.
The impact flux for the remaining satellites, such as Iapetus, Mimas, Enceladus, Hyperion, and Phoebe, among others, becomes more challenging to interpret because the largest impacts are sampling a relatively shallow portion of the projectile SFD. From a Monte Carlo standpoint, this means one can get a wide range of possible basin sizes when drawing from the crater production function. Still, on average, no D > 100 km bodies hit these worlds.
Iapetus, being a Rhea-sized satellite located far from Saturn (Table 1), has one of the most extensive crater and basin records in the solar system (Dones et al. 2009; Levison et al. 2011; Rivera-Valentin et al. 2014), probably because it became tectonically inactive not long after it formed. The largest well-preserved crater on Iapetus is the Dcrat = 580 km Turgis basin. Using the scaling law relationship for Iapetus from Figure 3(a), we find this size is not far from the largest expected impactor to strike Iapetus. This coincidence suggests that Iapetus's surface is likely to be extremely ancient. The largest crater on Mimas, on the other hand, is the Herschel crater (Dcrat = 139 km). Using Figure 3(a), we find the predicted impactors in Figure 4 would make craters substantially larger than Herschel. This makes it probable that Mimas is missing a considerable amount of its earliest history (e.g., Movshovitz et al. 2015).
In summary, we find that most satellites have been hit by objects larger than suggested from their basin/crater records (Figure 4). Given the scaled impact flux curve from Figure 2, our expectation is that most large impacts occur relatively early in the solar system history. Given that evidence for such events is not obvious, it can be argued that many of these satellites experienced early disruption and/or shattering events that reset their surfaces and mixed surface and interior materials (e.g., Smith et al. 1982; Movshovitz et al. 2015). This heavy bombardment era represents missing history. Evidence for such titanic blasts might now only be attained via high-resolution gravity measurements, such as those planned for Ganymede by ESA's Juice mission in the mid-2030s.
A key implication of Figure 4 is that any craters made on the giant planet satellites prior to Neptune entering the PKB were likely eliminated by early disruption, shattering, or resurfacing events. Unfortunately, this means any putative impact signatures from the leftovers of accretion in the giant planet zone or from satellite formation have been eliminated. Effectively, the bombardment from the destabilized population provided the giant planet satellites with a clean slate for its subsequent history.
It is interesting to compare Figure 4 to a comparable plot where 100 Myr have passed since the start of the bombardment (Figure 5). At this younger time, defined as T = 120 Myr after solar nebula dissipation, the barrage of D > 100 km bodies is complete for all but the largest satellites. The largest mean bodies likely to hit Rhea, Tethys, and Dione from this time on are from the shallower part of the impactor SFD between 20 < D < 100 km, with the largest impactors being a few tens of kilometers. Using the crater scaling relationships from Figure 3(a), many of these size projectiles are capable of creating the largest basins found on those worlds. Accordingly, our preliminary prediction is that many midsized worlds will have surface ages starting ∼100 Myr or more after the bombardment begins. In the next section, we will test these predictions more explicitly against the crater histories of these worlds.

Figure 5. The cumulative size frequency distribution (SFD) of all projectiles that hit the giant planet satellites 100 Myr after Neptune enters the PKB (i.e., 120 Myr after the dissipation of the solar nebula). See Figure 4 for additional details. Here, bombardment starts when Neptune enters. The net flux for each world has decreased substantially from collisional and dynamical evolution in the destabilized population. The largest mean impacts for the midsized satellites are generally several tens of kilometers in diameter, and they come from a relatively shallow portion of the SFD. This limits the ability of bombardment to produce global erasure events on many worlds from this point on.
Download figure:
Standard image High-resolution imageWe close this section by noting that, even after ∼100 Myr of bombardment, the largest moons like Callisto are still likely to be hit by very large objects (Figure 5). The conventional wisdom is that Callisto has one of the most ancient surfaces of the giant planet satellites, but this is contradicted by the long tail of large impactors that are still to come for this world. Identifying the oldest surfaces on each of the giant planet satellites is our task for the next section.
5. Calculating the Oldest Surface Ages for the Giant Planet Satellites
Relative ages on a giant planet satellite are commonly estimated using crater spatial densities; the higher they are, the older the surface. Absolute ages are determined by reproducing crater spatial densities using a crater production model that has been linked to a chronological system. Ideal absolute age models reproduce the crater SFD on a given surface over a large range of crater sizes.
Finding a good fit between the model and observed SFDs for certain surfaces, however, can be problematic if the production crater population has been substantially contaminated by craters formed by planetocentric debris. The latter craters, usually made by material ejected from the impact site of heliocentric projectiles, have size/spatial distributions that can be highly variable (e.g., Bierhaus et al. 2018). On many of the worlds discussed below, craters formed by planetocentric debris may dominate the known population of Dcrat < 20 km craters (e.g., Smith et al. 1982; Zahnle et al. 2003; Ferguson et al. 2020, 2022a, 2022b), although their source is unknown. We will discuss this issue in more detail below.
For these reasons, we have taken the following steps in our analyses of the giant planet satellites. First, we are interested in the oldest surface ages for each moon, so our work examines crater SFDs with the highest crater spatial densities coupled with global counts of the largest craters or basins when they are available. Second, where possible, our fits between model and observed craters emphasize the craters that are out of the probable size range for planetocentric debris. For many giant planet satellites, this appears to correspond to craters that are Dcrat > 20 km (Zahnle et al. 2003; Ferguson et al. 2020, 2022a, 2022b). Third, there are many giant planet satellites, so we have tried to group the satellites by size, dynamical context, and history. Fourth, we will not use our model at this time to probe the ages of interesting geologic features (e.g., Ithaca Chasma on Tethys; Herschel crater on Mimas).
We start our discussion with an examination of the oldest satellites among those listed in Table 1, which include three satellites from Saturn and one from Uranus.
5.1. The Ancient Surfaces of Hyperion, Iapetus, Phoebe, and Oberon
5.1.1. Description of the Satellites
Our first group of giant planet satellites orbit relatively far from their host planet (Table 1). In increasing order of distance, Hyperion, Iapetus, and Phoebe are the most distant satellites from Saturn with observed cratered surfaces, while Oberon is the farthest from Uranus. The moons' large distances mean limited gravitational focusing and a lower heliocentric impact flux per square kilometer than closer satellites, as shown by the collision probabilities in Table 1 (see also Nesvorný et al. 2023). Here, we briefly introduce each satellite and their main characteristics.
Hyperion. Hyperion is an irregularly shaped moon with a mean diameter of 270 km diameter and a bulk density of 0.54 ± 0.05 g cm−3, about half of that of Iapetus (Table 1). The unusual morphology of its craters makes Hyperion look like a giant sponge (Thomas et al. 2007). Dark material on its surface is probably implanted dust from Phoebe and possibly other irregular satellites (e.g., Bottke et al. 2010). The low albedo from these deposits leads to ice sublimation on crater floors that concentrates the dark material into a lag deposit, where it produces even more melting (Moore et al. 1996; Dalton et al. 2012; Howard et al. 2012). This fascinating process, possibly akin to "suncup" formation on terrestrial glaciers, does not appear to modify crater diameters, so the crater SFD from Thomas et al. (2007) can be used to probe Hyperion's earliest history.
Iapetus. Iapetus is a large distant moon with a mean diameter of 1468 km, a low eccentricity, and a large inclination (i.e., relative to Saturn's Laplace plane, Iapetus's inclination is ≃7 5; Ward 1981; Table 1). The high inclination value is unexpected because models describing how worlds form within a circumplanetary disk of gas and dust indicate these bodies start with circular orbits and inclinations near 0° (e.g., Canup & Ward 2006). It is possible that Iapetus's orbit is a byproduct of planetary encounters during the giant plant instability (Nesvorný et al. 2014). It also has an unusual dark–bright surface dichotomy on different hemispheres from the implantation of Phoebe/irregular satellite dust (e.g., Buratti et al. 2005; Tamayo et al. 2011).
The standout topographic feature of Iapetus is its equatorial ridge, which rises as much as ∼13 km in height (Giese et al. 2008) and extends for 1300 km in length (Porco et al. 2005). There are several different formation hypotheses for the origin of the ridge (see Levison et al. 2011 and references therein), but for the purposes of this paper, its main attribute is that it is likely the oldest geologic feature on Iapetus (e.g., Rivera-Valentin et al. 2014). We discuss the formation of the ridge in Section 6.3. After the creation of this feature, the primary resurfacing mechanism on Iapetus appears to have cratering processes.
Phoebe. Phoebe is the largest irregular satellite of Saturn, with a mean diameter of ≃214 km (Table 1). The irregular satellites are thought to be objects captured from the destabilized population during the giant planet instability (Nesvorný et al. 2003, 2007). After capture, mutual collisions decimated the irregular satellite population within millions of years and led to the loss of ∼99% of their mass (Bottke et al. 2010). This potentially makes Phoebe the principal remnant of a much larger population. Note that, while the moon has been heavily battered over its history, its shape is still relatively spheroidal, which is not obvious from commonly used high-resolution images of Phoebe (Thomas 2010).
Phoebe's surface has been hit throughout its history by both irregular satellites and heliocentric projectiles. Given the results from Bottke et al. (2010), we expect irregular satellites to dominate the earliest bombardment of Phoebe (i.e., the time immediately after capture). As the stable irregular satellites collisionally grind themselves down, heliocentric projectiles should dominate later bombardment. During the heaviest bombardment phases, Phoebe was probably disrupted or shattered multiple times.
The confounding issue to interpreting Phoebe's surface age is that the irregular satellites and destabilized population both originated in the PKB, so their SFDs likely experienced collisional evolution in similar ways (e.g., the objects have the same physical properties and follow the same disruption scaling laws). Our crater production model, however, does not yet include the irregular satellites. In this paper, we will derive an endmember surface age based on the idea that the last resurfacing event occurred at a late enough time that the contribution from the destabilized population outweighed that from the irregular satellites.
Oberon. Oberon is the most distant of the major Uranian satellites. Its nearly circular coplanar orbit with Uranus is not unusual unless one considers that Uranus's rotational pole is inclined ∼98° to the ecliptic plane. Oberon is covered by dark material analogous to carbonaceous chondrites; this could be dust produced by irregular satellite collisions that reached Oberon by Poynting–Robertson drag (e.g., Buratti & Mosher 1991; Afanasiev et al. 2014; Cartwright et al. 2020; Detre et al. 2020; see also Bottke et al. 2010). Its diameter is about the same as that of Iapetus, but its bulk density is much larger (i.e., 1.63 g cm−3 versus 1.09 g cm−3; Roatsch et al. 2009; Table 1). Oberon's high bulk density could suggest differentiation and perhaps even a subsurface ocean (Hussmann et al. 2006). Otherwise, Oberon's surface is dominated by craters, and only has limited evidence for tectonic features (e.g., cryptic linear features; Croft & Soderblom 1991; Schenk & Moore 2020) or endogenic resurfacing at the resolution provided by Voyager 2 images (Schenk & Moore 2020; Kirchoff et al. 2022).
5.1.2. The Oldest Surface Ages for Hyperion, Iapetus, Phoebe, and Oberon
Taken together, our expectation is that the crater ages of Hyperion, Iapetus, Phoebe, and Oberon should go back to deep time, with some potentially recording the beginning of the bombardment from the destabilized population. The crater SFDs used for our studies of these worlds are shown in Figure 6. Each is discussed below, along with our methodology.

Figure 6. Model surface ages of the oldest terrains on Hyperion, Phoebe, Iapetus, and Oberon. The observed crater SFDs come from Kirchoff & Schenk (2010; Iapetus), Thomas et al. (2007; Hyperion), Thomas et al. (2013; Phoebe), and Kirchoff et al. (2022; Oberon). The gray curves show the error envelope of the crater data calculated using the methods of Robbins et al. (2018). The middle gray curve is a synthetic crater SFD, where a kernel density estimator has been used on the observed crater data. The lower and upper gray curves represent bootstrapped confidence intervals of 10% and 90%. Model fits to these values define the age error. The age in the lower left is time from the present day, while the age in the upper right corresponds to time from the dissipation of the solar nebula (i.e., when collisional evolution in the PKB is assumed to begin). Bombardment starts when Neptune enters the PKB at Δt0 = 20 Myr. Phoebe's model age is near this time, so we exclude errors from its age. All four satellites have crater retention ages only modestly younger than the start of bombardment itself.
Download figure:
Standard image High-resolution imageThe crater SFDs for Phoebe and Hyperion come from Porco et al. (2005), Thomas et al. (2007) respectively, with the data provided to us by P. Thomas. They include an assembly of counts determined from Cassini images that were taken at different resolutions, with the crater diameters for each terrain archived within root-2 size bins. To make the counts simpler to interpret for the reader, we removed bins dominated by observational incompleteness (i.e., data points that approach a horizontal line on the cumulative plot near the resolution limit).
The Iapetus crater SFD used here is described in Kirchoff & Schenk (2010). It is a compilation of craters found on the heavily cratered plains residing on both the bright and dark terrains (i.e., cp-bright-global and cp-dark-global, respectively). The regions are separated in longitude by nearly 180° (see their Figure 1). The global distribution of Dcrat > 100 km craters is also included in the plot.
Oberon's crater SFD comes from Kirchoff et al. (2022), who counted craters on a single terrain imaged by Voyager 2 (see their Figure 2). Note that they find higher spatial densities for larger craters than those from previous works (e.g., Smith et al. 1986; Plescia 1987; Strom 1987; Croft 1988).
Each crater SFD in our paper is accompanied by an uncertainty envelope of three gray lines calculated using the methods described in Robbins et al. (2018). These lines replace the standard Poisson N1/2 error bars commonly used in older crater plots (Crater Analysis Techniques Working Group 1979). The middle gray line represents a synthetic crater SFD built using a kernel density estimator on our data. The bottom and top gray lines represent 10% and 90% confidence limits on the uncertainties assigned to the synthetic crater SFD, which were calculated using bootstrap techniques. We refer the reader to Robbins et al. (2018) for additional algorithmic details. Note that, for the binned crater data provided by P. Thomas, we created sets of synthetic craters whose sizes were based on the slope of the crater SFD between bins. They were selected using random deviates, with the number of craters created set to the same value as those in the size bin. From there, we followed the Robbins et al. (2018) procedure to generate the gray lines.
Our model crater production SFDs were calculated as follows. First, using the best-fit case for the destabilized population from Bottke et al. (2023; Figure 1), we converted projectiles into craters using the scaling law functions shown in Figure 3 (see Section 3.3). Specifically, those for Iapetus come from Figure 3(a), those for Oberon come from Figure 3(b), and those for Phoebe/Hyperion come from Figure 3(c).
Second, we numerically increased the time resolution of our crater production model so a model crater SFD would exist for every 1 Myr time step. Recall that, in Bottke et al. (2023), the Boulder collisional evolution code output their results in a nonuniform fashion to save computer storage space. A typical trial run file had a model SFD every Myr between the start of the simulation and 100 Myr of elapsed time, every 50 Myr between 100 and 1000 Myr of elapsed time, and every 100 Myr between 1000 and 4500 Myr. Taking the SFDs for two consecutive time steps, say 4400 and 4500 Myr, we filled in the intervals by creating a weighted average between the SFDs (i.e., for 4499 Myr, the SFD would be 99% from the 4500 Myr time step and 1% from the 4400 Myr time step).
Third, the crater SFDs were multiplied by the normalized Jupiter impact rates from Figure 2 suitable for their output time, the total fraction of the PKB that strikes Jupiter, namely 1.1%, and the impact probability of destabilized bodies striking the satellite in question from Table 1. We then added these SFDs together going backwards in time, with the time interval between the curves being Δt = 1 Myr. These integrated model crater SFDs define our crater production model for times between Neptune entering the disk at Δt0 = 20 Myr after gas disk dissipation and the present day.
Fourth, we compared the spatial densities of craters in our model to the synthetic crater SFD defined by the middle gray curve, with the best fit between the two yielding a model surface age. At face value, this sounds straightforward, but there are several confounding issues.
For example, as discussed above, many crater SFDs used in our model were assembled piecemeal from different images, so occasionally, two SFDs from the same body have modestly different crater spatial densities for the same crater sizes. Another problem is that chi-squared methods used to find fits between model and data favor the smallest craters in the SFD because they have the most data (e.g., Bottke et al. 2020). The issue is that the sizes of small craters are not easy to determine if they are near the resolution limit of the image. In addition, they may also be where craters from planetocentric debris are plentiful enough to distort the shape of the production SFD.
After testing different procedures, we opted for a hybrid fitting method. For each crater SFD, we created a distribution of N points interpolated from the data that are uniform in log D. The value of N was typically several tens to several hundreds. Next, we set up a scoring system like that described in Bottke et al. (2010) and looked for fits that minimized the score between the crater production model at different times and our synthetic craters

Here, Nmodel and Nobs are the cumulative number of model and synthetic craters, and Di = 1, ..., M, are the diameters of model and synthetic craters. This equation resembles a chi-squared test, but because the craters were created for fitting purposes, the denominator is not statistically meaningful, so it is dropped. Finally, except where specified in the text, we only fit over synthetic craters that are out of the likely range of craters produced by planetocentric debris (i.e., usually Dcrat > 20 km).
The same procedure was followed to find error bars on our surface ages, with best fits made between our model crater production function and the 90% and 10% confidence limits represented by the top and bottom gray lines, respectively. The reader should treat these results with some caution, however, because our model is based on multiple parameter choices whose modifications could lead to variations in our results. For example, by choosing different input values for the crater scaling law in Equation (1), we could easily end up with a very different crater production SFD. The bottom line is that, while we have tried to make our results self-consistent, they must also be considered model dependent.
Our best-fit results in Figure 6 yield median model surface ages of T = 34, 29, 21, and 40 Myr for Hyperion, Iapetus, Phoebe, and Oberon, respectively, where T is defined as the time after solar nebula dispersal. Error bars on those values are found in Table 1 and in Figure 6. In the dynamical model used by our crater production model, Neptune enters the PKB at T = 20 Myr (i.e., Δt0 = 20 Myr), making that value the oldest (numerically smallest) possible surface age in our model. Accordingly, we find it interesting that of many these worlds have surface ages close to that age; it suggests that their surfaces retain a record of much of the bombardment produced by the destabilized population. The reader should keep in mind, however, that Figure 6 shows a factor of 3 decrease in the impact rate of Jupiter (and other worlds) in the first 10 Myr of bombardment after Neptune enters the disk. This implies that even these ancient worlds are missing some of their earliest bombardment history.
Phoebe appears to have the oldest surface, with an error envelope that overlaps the start of bombardment at T = 21 Myr. This thwarts any straightforward calculation of error bars for its surface age, so we do not include them for this world. With that said, we suspect Phoebe is missing some of its earliest history. Consider that its surface age is likely complicated by irregular satellite bombardment, even though the irregular satellite population decays rapidly from collisional evolution (Bottke et al. 2010, 2023).
To a more limited degree, irregular satellites captured onto unstable non-satellite-crossing orbits or satellite-crossing orbits could have also hit Iapetus, Hyperion, and possibly Oberon (Nesvorný et al. 2003, 2007). This should occur relatively rapidly, such that collisional evolution among these bodies may be limited, although it needs to be modeled (Bottke et al. 2010). If true, this population could be considered a modest augmentation of bombardment from the destabilized population. Additional collisional and dynamical evolution modeling work will be needed to determine the contribution of these extra impactor populations to the impact histories of Iapetus, Hyperion, and Oberon. To be conservative, the model surface ages of these worlds should probably be considered slightly younger than the values reported here.
The ancient age for the four worlds in Figure 6 provide a limited self-consistency check on our work. If the maximum bombardment from our model produced crater spatial densities that were substantially lower than those observed, it might suggest that our destabilized population contained too little mass or that an additional bombardment population was needed to make up the difference. Conversely, the fact that model and observations line up well near T ∼ 20–40 Myr indicates that the contribution of other bombardment populations, say, from long-lived irregular satellites or from material formed within a circumplanetary disk, is not a major factor in explaining observations. This should not be interpreted to mean that such populations did not exist, only that our ability to investigate them is limited without additional information.
The most surprising result among the four worlds is arguably Oberon's surface age. Consider that Oberon has an impact probability that is 6 times higher than that of Iapetus (Table 1), yet it is comparable in size and surface age (T = 40 [+4, −4] versus 29 [+5, −3] Myr, respectively). This apparent similarity comes from a series of trade-offs: (i) Oberon's crater spatial densities are higher than those on Iapetus for Dcrat > 100 km craters (Figure 6), (ii) Oberon's younger surface age, which corresponds to nearly a factor of 2 in decreased impact flux (Figures 2, 6), and (iii) Oberon's lower impact velocities (8 versus 6.5 km s−1), which generate smaller craters on average (Figure 3).
Our expectation is that Oberon was hit by multiple D > 100 km bodies shortly after Neptune entered the PKB. These impacts likely reset Oberon's surface. Assuming the last reset event occurred near T ∼ 40 Myr, the net flux available to Oberon at that time would be reduced by nearly an order of magnitude compared to the start of bombardment. From that point, the largest impacts would likely come from the shallow portion of the impacting SFD, with the stochastic nature of impacts possibly limiting subsequent large impacts. Given that Voyager 2 has only imaged approximately 40% of Oberon's surface area, it seems probable other large basins will eventually be found on its surface. If not, it could be because Oberon has a subsurface ocean (Hussmann et al. 2006), which can help erase the surface expression of large impact basins via viscous relaxation processes (e.g., as may have happened at Ceres; Marchi et al. 2016; Fu et al. 2017).
The net impact flux plots from Figure 4 also provide some useful context for our results. The largest median impactors to hit Hyperion, Phoebe, and Iapetus come from the shallow portion of the impactor SFD, and so were smaller than those for other worlds found closer to their host planets. This implies that any putative disruption or surface reset event by collisions took place very early in the histories of these satellites. This issue may be relevant to the origin of Iapetus's ridge, which is discussed in Section 6.3.
5.2. The Missing Early History of Mimas, Tethys, Dione, and Rhea
Using the above satellites as context, we are now in a better position to interpret the surface ages of several midsized satellites of Saturn (i.e., Mimas, Enceladus, Tethys, Dione, and Rhea). The moons range in size from nearly 400–500 km (i.e., Mimas, Enceladus) to 1500 km (i.e., Rhea; Table 1) and orbit more closely to Saturn than Hyperion, Iapetus, and Phoebe. Saturn's gravitational focusing is more important for these worlds, which means they have larger collision probabilities per unit area and higher impact velocities than those of more distant moons (Table 1).
5.2.1. Description of the Satellites
Mimas. Mimas is a relatively small midsized icy satellite with an orbit close to Saturn and a bulk density of 1.15 g cm−3 (Table 1). Saturn's tidal forces have given Mimas a shape with a modest elongation; its long axis is about 10% longer than its short axis (Thomas et al. 2007). It has a relatively high eccentricity (Table 1), which suggests at face value that it has not experienced appreciable tidal dissipation. The moon is heavily cratered and shows no signs of tectonics or volcanism (Schenk et al. 2018; Rhoden 2023). The largest impact crater observed on its surface is Herschel, which is 130 km in diameter. With all of this said, Mimas undergoes anomalous librations that may be indicative of a sizable nonhydrostatic interior or, more provocatively, a subsurface ocean under a thick shell (Tajeddine et al. 2014; Rhoden 2023; Lainey et al. 2024).
Tethys. Tethys is an icy moon slightly larger than Ceres (∼1062 km diameter) with a bulk density (0.96 g cm−3) comparable to water ice (Table 1). Its surface is heavily cratered, with some large craters that are viscously relaxed (White et al. 2017). Ithaca Chasma, a ∼1000 km long trough that is 50–100 km wide, shows that Tethys experienced extensive tectonic activity in the past (Giese et al. 2007). The formation of Ithaca Chasma may be related to (i) the freezing of a putative subsurface ocean (Moore et al. 2004), (ii) the passage of Tethys through the 3:2 resonance with Dione, which led to a modest eccentricity for Tethys that was later damped by tidal dissipation (Chen & Nimmo 2008), or (iii) the formation of the ∼400 km diameter Odysseus basin, although crater spatial densities (Giese et al. 2007; Kirchoff & Schenk 2010) and spectra (Stephan et al. 2016) suggest the basin is younger than Ithaca Chasma.
Dione. Dione is comparable in size to Tethys, but its bulk density is considerably larger (1.48 versus 0.96 g cm−3, respectively; Table 1). Gravity and topography measurements from the Cassini mission indicate Dione has a large rocky core overlain by an icy exterior, with a possible small subsurface ocean sandwiched between the two (e.g., Zannoni et al. 2020). Dione has a small eccentricity (Table 1) that is maintained by the 2:1 MMR between Enceladus and Dione (e.g., Meyer & Wisdom 2008). Tidal dissipation may be responsible for the numerous troughs, fractures, and lineaments found on Dione's surface (e.g., Smith et al. 1982; Moore et al. 2004). Despite this, much of the moon is heavily cratered, with its largest basin Evander having a diameter of ∼350 km. Many of Dione's large craters have also experienced extensive viscous relaxation (White et al. 2017).
Rhea. Rhea is the second largest Saturnian moon, with a diameter of 1527 km (Table 1). Its bulk density is 1.24 g cm−3, while its internal structure is uncertain. Some suggest it has a nondimensional moment of inertia value of 0.39, which would make its interior a nearly homogeneous mixture of water ice (three-fourths) and rock (one-fourth; Anderson & Schubert 2007a, 2007b, 2010). Others argue that the gravity field is inconsistent with hydrostatic equilibrium, and that Rhea may have a small core and a weak relaxed mantle (e.g., Tortora et al. 2016). Much of its surface is heavily cratered, with several large, degraded craters and multiring impact basins whose diameters go up to 400 km (i.e., Tirawa basin; White et al. 2013). The basins have a relaxed appearance, unlike those on Iapetus, and could be indicative of higher heat flows in the past (Moore et al. 2004; White et al. 2013). The regions near Rhea's poles and equator are more lightly cratered, suggesting episodes of past resurfacing (e.g., Schenk et al. 2018). Rhea also shows evidence for modest fracturing and has experienced some tectonics.
5.2.2. The Oldest Surface Ages for Mimas, Tethys, Dione, and Rhea
Our crater SFDs for Mimas, Tethys, Dione, and Rhea come from Kirchoff & Schenk (2010), who analyzed suites of Cassini images (Figure 7). Craters' counts for Mimas were derived from about half of its surface, while those for Tethys, Dione, and Rhea were taken from their most heavily cratered terrains. For the latter worlds, some craters were gathered from high-resolution images, while others were derived from global mosaics. Lightly cratered terrains also exist on these worlds (e.g., craters superposed on the Tethys basin Odysseus, the potentially resurfaced plains of Dione, sections of the young complex rayed impact crater Inktomi on Rhea), but we do not consider them in this paper.

Figure 7. The model surface ages of the oldest terrains on Mimas, Tethys, Dione, and Rhea. The observed crater SFDs come from Kirchoff & Schenk (2010). See Figure 6 for additional figure details. The crater production model was fit to Dcrat > 25 km craters in each data set. The mismatch between model and data for Dcrat < 20 km craters is likely produced by craters produced by planetocentric debris, possibly produced by the largest surface reset event on each body. Tethys and Dione are found to have comparable surface ages to one another. Rhea, the farthest of these four moons from Saturn, has a median surface age more than 100 Myr older. All four moons are missing a considerable amount of their early history, probably from large impacts producing shattering and catastrophic disruption events (Figure 4).
Download figure:
Standard image High-resolution imageOur best-fit results from Figure 7 yield model surface ages of T = 400, 280, 260, and 130 Myr after solar nebula dispersion for Mimas, Tethys, Dione, and Rhea, respectively, with the age errors provided in Table 1. The match between model and data is visually good for most Dcrat > 20 km craters but is discordant for smaller sizes. We suspect this difference is primarily from planetocentric impactors striking the moons (Zahnle et al. 2003), although their source has yet to be identified. In support of this, many elongated craters with Dcrat < 20 km are oriented in the east–west directions on Tethys and Dione, which is more consistent with planetocentric impactors than heliocentric impactors (Ferguson et al. 2020, 2022a, 2022b). We will discuss this issue further in Section 5.2.3.
Note that smaller craters on these worlds were originally interpreted by the Voyager imaging team to be from a distinct planetocentric population (i.e., Population II; e.g., Chapman & McKinnon 1986). As stated by Smith et al. (1982), when discussing Dcrat < 10 km craters, "Population II resembles, statistically, secondary populations on the terrestrial planets and has the form expected for debris generated by collision of objects with the satellites or other orbiting debris." Kirchoff & Schenk (2010) noted that the Voyager-era hypothesis of two different impactor populations, one heliocentric and one planetocentric, was still plausible after their analysis and, if anything, may be more widespread than they originally thought.
The surface ages of Mimas, Tethys, Dione, and Rhea are many tens to a few hundred Myr younger than the surfaces' ages of Hyperion, Iapetus, Phoebe, and Oberon. This missing history occurs during an interval when our model predicts that Tethys, Dione, and Rhea were hit by multiple D > 100 km projectiles, whereas Mimas was hit by multiple D > 40 km bodies (Figures 4–5). There is no obvious surface expression for such enormous impact events, which suggests several possibilities. The first is that the moons formed near the times recorded by their oldest surface ages. We will discuss this possibility in Section 8. The second is that these impact events were large enough to reset the surfaces of these satellites. The erasure mechanism could include a range of possibilities, ranging from the shattering of the target body to near-surface melting caused by the impact itself and/or the reaccretion of ejecta (e.g., Levison et al. 2000; Movshovitz et al. 2015). These reset episodes might happen multiple times until the impact flux subsides. As we will discuss further in Section 5.2.3, we suspect that the sources of the putative planetocentric impacts in Figure 7 are the last surface reset events on these worlds, with the fragments bombarding satellite surfaces at relatively late times.
The effects of very large impacts on the interiors of Mimas, Tethys, Dione, and Rhea are unknown. Taken in order, we postulate that multiple shattering and disruption events on Mimas might lead to an irregularly shaped interior shard with some degree of coherence covered by a large quantity of reaccreted debris (McKinnon 2013). This shape might be like that suggested by Tajeddine et al. (2014) to explain Mimas's physical librations, namely an elongated core between 20 and 60 km on each side of the core's longest axis. Alternatively, recent work by Lainey et al. (2024) shows that an irregular shard may no longer yield a plausible solution for Mimas's libration and precession frequencies. They instead favor Mimas possessing a subsurface ocean that is only tens of Myr old. This scenario, while provocative, is inconsistent with an ancient surface age for Mimas. Additional data on the nature of Mimas are clearly needed.
For Tethys, Dione, and Rhea, disruption is unlikely from the size of bodies striking the target, which are the order of 100–200 km (Figure 4), but large impacts may still have influenced their thermal evolution. For example, early shattering events might eject warm materials from their interiors into the coldness of space, allowed them to radiatively cool before reaccretion. Conversely, the return of all of this debris would heat the moon, perhaps enough to cause substantial melting. High-velocity impacts can also potentially melt a region of ice beneath the impact point. The rock within this region would rapidly collect into a large clump, which then could descend to the satellite's center via Stokes flow. In this way, large impacts can potentially drive melting and partial differentiation in a satellite's interior (e.g., Barr & Canup 2010; Barr et al. 2010). New modeling is needed to test how all of these factors play off of one another.
Given that Tethys shows evidence of resurfacing and tectonic activity, it may have partially differentiated (e.g., Smith et al. 1981; Chen & Nimmo 2008). This possibility is surprising because a Tethys-sized satellite with low rock content would be expected to form in a cold, undifferentiated state (i.e., accretional and radiogenic heating are modest; Matson et al. 2009). Tidal heating is the preferred way to provide Tethys with ancient heating (e.g., Zhang & Nimmo 2012). Estimates suggest its passage through a resonance with Dione, and associated tidal heating, would produce an equilibrium heating rate of ∼2.5 mW m−2 (Chen & Nimmo 2008). If this value is too small to explain observations, we speculate that early bombardment might provide an additional unexplored way to generate internal heat on Tethys.
Like Tethys, Dione and Rhea may have formed in an undifferentiated state (e.g., Barr & Canup 2010). A paucity of endogenic features on either body could indicate that both remain undifferentiated and inactive today. Searches for activity on Dione have so far come up empty (Buratti et al. 2018; Howett et al. 2018). Still, it is possible that some impact heating affected the rock distribution within both worlds. For example, Dione's and Rhea's ice may only be modestly melted in its outer radius, with the rock initially in this layer descending to the core. More extensive melting of ice in this layer could not have been much more than this, or it would have led to more complete melting and differentiation. Interestingly, Tethys, Dione, and Rhea's larger craters show signs of viscous relaxation (White et al. 2013, 2017), and that suggests a subsurface ocean within one or more of these worlds is possible (Hussmann et al. 2006).
5.2.3. A Possible Source for Planetocentric Impacts
An open question from our work above is how to explain the differences between our model crater production function and the SFDs for Dcrat < 20 km craters on Mimas, Tethys, Dione, and Rhea. There is no evidence from Figure 1 that the projectile SFD undergoes stochastic changes large enough to explain observations (Bottke et al. 2023). In addition, ejecta formation from the largest observed basins on the midsized Saturnian satellites may not be capable of producing sufficient quantities of high-speed ejecta to explain observations (Alvarellos et al. 2005, 2017). We appear to need a sizeable yet short-lived source of small projectiles with a steep power-law SFD, yet one that becomes shallow again for projectiles that make Dcrat < 10 km craters.
Given what we know of the impacting SFDs striking these worlds (e.g., Figures 4 and 5), and the ability of large projectiles to shatter or disrupt them (e.g., Movshovitz et al. 2015, 2016), we postulate that debris from these impacts may be a plausible source for many smaller craters in Figure 7. Disruption events commonly produce steep SFDs in asteroid family forming events (e.g., Masiero et al. 2013), and most of the ejected material would be reaccreted onto the satellite (Alvarellos et al. 2005, 2017; see also Section 6.5).
The complicating issue for this hypothesis is timescale, namely that most ejecta of the midsized satellites is reaccreted over ∼102–103 yr (Alvarellos et al. 2005, 2017; see also Section 6.5). This may not be enough time for a newly shattered satellite to retain craters. With that said, we are unaware of any quantitative modeling work describing what happens thermally to the near surface of midsized satellites that reaccrete their own ejecta after a shattering or disruption event. For all we know, the near surface may cool fast enough that the longest-lived planetocentric debris will produce craters. This area is ripe for further research.
If the near surface of a newly shattered body takes considerably longer than ∼103 yr to produce a stable surface, we postulate that a small fraction of ejecta from the last global erasure event will need to find a way to survive that length of time as well. Alternatively, ejecta from the youngest surface reset event in the system could bombard other nearby satellites. This would sidestep the immediate problem for most satellites, but the target satellite would still need to bombard itself to explain crater observations.
Intriguing insights into this problem can be found in Hyodo & Charnoz (2017). They used an N-body code to track the aftermath of a collision between two large satellites. From snapshots of their dynamical modeling work, we infer that the largest remnants from the satellite collision gravitationally interact both with each other and the smaller debris prior to forming a new satellite. The reaccretion of large debris onto the satellite may also jolt the orbit of the new satellite, enough to potentially give it a modestly different semimajor axis and eccentricity. Both effects appear to strand some ejecta onto marginally noncrossing orbits with the newly reaccreted satellite.
While the fate of this stranded ejecta has yet to be modeled, our expectation is that some of it is dynamically stable over moderate timescales. If so, this mechanism could help explain the origin of small satellites in the Saturn and Uranus systems interior to the orbits of Mimas and Miranda, respectively, as well as the Trojans of Tethys and Dione (which we discuss in Section 6.6). Perhaps, these tiny moons were originally ejecta from a disruption or shattering event on Mimas, Miranda, Tethys, or Dione, but their orbits have now become stabilized.
Given that Mimas, Tethys, Dione, and Rhea are all hit by projectiles with D > 100 km, we believe it is possible that some ejecta from these events became stranded on noncrossing orbits in a manner similar to the results of Hyodo & Charnoz (2017). For this hypothesis to make sense, most of this stranded material must eventually reach satellite-crossing orbits, or we would see it today. The timescale for this material to dynamically go away is unknown, but it might be hundreds of thousands of years or more. This would give the smashed satellites time to produce a stable surface before the last of this material returns. Moreover, if sufficient mass is in the ejecta, the population could undergo collisional evolution, perhaps enough to explain why the crater SFDs in Figure 7 have shallow power-law slopes for Dcrat < 10 km craters (e.g., Bottke et al. 2023). All told, this ejecta would make an intriguing source for the planetocentric impactors in Figure 7.
The fate of planetocentric debris produced by satellites colliding with one another has been poorly explored to date. If some giant planet satellites have young formation ages, perhaps, this scenario provides a plausible way forward to explain their bombardment histories.
5.3. The Unusual Case of Enceladus
5.3.1. Different Size–Frequency Distributions for Small Craters
Enceladus is one of the more unusual midsized Saturnian satellites. It is the second closest major satellite to Saturn with a mean diameter of 504 km, making it only modestly larger than Mimas. Its bulk density of 1.61 g cm−3, however, is substantially larger than that of nearby moons Mimas (1.15 g cm−3) and Tethys (0.96 g cm−3) (Table 1). The reason for this difference is unknown.
Enceladus experiences substantial tidal forcing from the 2:1 MMR with Dione (e.g., Meyer & Wisdom 2008) and the resonance locking mechanism described by Fuller et al. (2016). This leads to activity on Enceladus's surface, which culminates in water jetting out from fractures (called tiger stripes) located within a ∼300 km depression at Enceladus' south pole. The jets are connected to a putative subsurface ocean, which makes them an interesting target for a future mission (e.g., Cable et al. 2021). They are also the source of the material in Saturn's E ring (Kempf et al. 2010).
The portions of Enceladus with the highest crater spatial densities are its cratered plains located in mid to northern latitudes, which are far from the active regions (e.g., Porco et al. 2006; Kirchoff & Schenk 2009; Bierhaus et al. 2012). Dating their surface ages, however, is difficult using our model. Kirchoff & Schenk (2009) show that the crater SFDs on these cratered plains have considerable variability; as an ensemble, they do not have shapes akin to our crater production model. These differences suggest that portions of the crater SFDs on the oldest terrains came from another source (e.g., planetocentric debris).
To further investigate this possibility, we examined several different crater SFDs found on Enceladus. The first is a cratered terrain from the mosaic ISS_011EN_MORPH002_PRIME, which is located near longitude 180°E and latitudes 30° and 45°S (see Table 4, Figure 10, and Figure 20 from Bierhaus et al. 2012). The second comes from the oldest ridged plains unit on Enceladus defined as "rp6" by Kirchoff & Schenk (2009), a slender irregularly shaped strip of terrain located between longitudes 200°W and 270°W and latitudes 30°S and 45°N (see their Figures 4 and 6). We compared them to the shape of crater SFDs found on the heavily cratered plains from Enceladus's midlatitudes from Kirchoff & Schenk (2009; defined as Enceladus-cp-mid; see their Figures 4 and 6). All three crater SFD are plotted in Figure 8.

Figure 8. The model surface ages of several different terrains on Enceladus. The observed crater SFDs come from Schenk & McKinnon (2009; possible basins); Kirchoff & Schenk (2009; our Ridged Plains are their "Enceladus-rp6"; our Cratered Plains are their "Enceladus-cp-eq"), and Bierhaus et al. (2012; MORPH002). See Figure 6 for additional figure details. The first two crater SFDs have the same shape as the crater production model, so their surface ages are arguably reasonable. The third SFD does not fit the model, and so the surface age must be considered dubious. It is likely this terrain was contaminated by craters produced by planetocentric debris. The fourth SFD makes the speculative assumption that all large depressions on Enceladus are relaxed eroded remnants of impact basins. This age is discordant with nearby moons Mimas and Tethys (Figure 7), which suggests the basins have poorly defined sizes or that some/all are not impact basins.
Download figure:
Standard image High-resolution imageThe first two panels in Figure 8 show crater SFDs with shapes that match our crater production model. The similarity may indicate that the craters are in production, as suggested to us by B. Bierhaus (2024, personal communication). With that said, it is also possible some crater erasure process (e.g., tectonics, the reaccretion of plume material) can preferentially get rid of small craters on this terrain, which potentially would also yield the observed SFD. Additional work will be needed to test such possibilities.
Our median surface ages of the two terrains are T = 500 and 700 Myr, respectively, after solar nebula dispersal. We note that comparable ages were found for craters larger than 5–15 km (depending on the terrain) by Di Sisto & Zanardi (2016; see their Figure 10).
The third panel shows the crater SFD for Enceladus-cp-mid. It was chosen to be a representative sample of many comparable crater SFDs from Kirchoff & Schenk (2009). It has a much steeper slope than that of the crater production model for Dcrat < 20 km craters. A model surface age of T = 700 Myr was computed by fitting our model to a limited number of Dcrat > 15 km craters, but we have no confidence in that value; there is almost no overlap between our crater production model and the observed crater SFD. It seems probable that most of these craters were produced by planetocentric debris. Similarly poor results were found for the cratered plains near the equator (defined as "Enceladus-cp-eq") by Kirchoff & Schenk (2009). Accordingly, the best we can do from Figure 8 is assert that the oldest cratered surface on Enceladus is T ∼ 500 [+200, −100] Myr (Table 1), which we consider to be a lower limit.
This raises the question of how to explain the SFDs for Dcrat < 20 km craters on Enceladus with very different shapes. This postulated population would need to bombard the cratered plains shown in Figure 8 yet also go away fast enough to avoid contaminating the shallow crater SFDs found on the younger surfaces of Enceladus (i.e., first two panels of Figure 8).
Given what we know of the impacting SFDs on Enceladus (e.g., Figures 4 and 5), and the ability of projectiles tens of kilometers in diameter to shatter or disrupt Enceladus (e.g., Movshovitz et al. 2015, 2016), we argue that the source of craters on Enceladus' cratered plains was long-lived debris from an impact large enough to reset Enceladus' surface. This scenario was discussed in Section 5.2.3. The cratered plains on Enceladus in Figure 8 also provide evidence that the majority of craters formed by this putative mechanism are Dcrat < 20 km. This size limit would also help explain why our crater production model diverges from the observed crater SFD on Mimas, Tethys, Dione, and Rhea at these sizes (Figure 7). As suggested in Section 5.2.3, we argue these worlds were cratered by ejecta from their own surface reset events.
The resolution to the fascinating issue is left for future work, but we will discuss additional aspects of it in Sections 5.5, 6.5, and 7.
5.3.2. Putative Basins on Enceladus
As a more speculative aside, we point out that Enceladus has at least six large-scale depressions that are 90–175 km across, along with the 300–350 km south pole depression (SPD) that houses the tiger stripes (Schenk & McKinnon 2009). They have none of the telltale features of impact basins, lacking rims, ejecta, central peaks/features, or other large-scale impact-related structures. When this Enceladus assessment was made, however, we had not yet visited Ceres, which is notably missing a host of large craters and basins (Marchi et al. 2016). Ceres is the largest asteroid in the main belt, so it is likely that it was hit by multiple D > 50 km projectiles (Rivkin et al. 2014). Intriguingly, Marchi et al. (2016) found a few quasi-circular large-scale depressions on Ceres (coined planitiae) that might be relaxed impact basins. The largest one, Vendimia Planitia, is ∼800 km across. We postulate that these planitiae may be analogous to the Enceladus depressions. If so, we consider it plausible that a few of the seven structures mentioned above are impact structures.
As a thought experiment, we plotted the depressions and SPD as basins in the fourth panel of Figure 8. Fitting our crater production model to these data, we find Enceladus's most ancient surface might go as far back to T ∼ 80 [+40, −20] Myr after solar nebula dissipation. The difference in age with Mimas, which has a similar size and impact probability, is substantial (i.e., 400 [+200, −100] Myr). This contrast in ages suggests to us that many of the depressions are not basins (W. McKinnon 2024, personal communication), and/or the true basin diameter is smaller than the depression diameter (e.g., perhaps, a depression rim marks the outermost ring of a multiring basin). Both would yield a younger global surface age for Enceladus than T ∼ 80 Myr.
If the Enceladus depressions are indeed remnant impact basins, the location of the tiger stripes within the SPD becomes easier to understand. The SPD is comparable in size to the largest impact basins on Tethys, Dione, and Rhea. Assuming the SPD was made in a similar fashion, it would have excavated considerable crust while also creating a highly fractured zone of weakness below the impact structure (Roberts & Stickle 2021). When high heat flows were generated within Enceladus by tidal dissipation, upwelling material would naturally try to take the easiest pathway to the surface, which we postulate would be under SPD. Accordingly, the origin of the tiger stripes may be linked to the putative largest impact basin found on Enceladus.
5.4. The Missing Early History of Miranda, Ariel, Umbriel, and Titania
The major Uranian satellites have similar sizes to the midsized Saturn satellites. The innermost major satellite Miranda is small like Mimas, Ariel and Umbriel are comparable in size to Tethys and Dione, and Titania and Oberon are good matches to the sizes of Rhea and Iapetus. These moons also have higher collision probabilities and lower impact velocities than their counterparts in the Saturn system (Table 1).
The origin of these satellites is enigmatic. Given that the obliquity of Uranus is 98°, and that the satellites orbit in the equatorial plane of Uranus, it is probable that a connection exists between the two. Model results by Morbidelli et al. (2012), Rufu & Canup (2022) indicate the Uranian satellite system started to form by coaccretion but were destabilized by a putative giant impact that tilted the planet (see also Rogoszinski & Hamilton 2021). The primordial satellites subsequently collided and disrupted, creating an outer debris disk that reoriented to the planet's new equatorial plane and accreted into Uranus' four major satellites.
This origin scenario for the satellites implies that some craters could have been produced by debris from primordial times. An issue working against this idea is that the inferred surface age of Oberon, which is tens of Myr younger than Neptune's entry into the PKB (T = 40 [+4, −4] Myr versus 20 Myr, respectively) (Figure 6). In order for planetocentric debris from the satellite formation era to make observed craters in the Uranian system, the projectiles would need to be extremely long-lived. Specifically, they would need to occur well after the largest early impacts from the destabilized population, many of which are capable of shattering these moons (Figure 4).
5.4.1. Description of the Satellites
Miranda. Miranda is the closest major satellite to Uranus. It is roughly the size of Mimas and Enceladus, with a diameter of 472 km and a bulk density of 1.2 g cm−3 (Jacobson et al. 1992). Its surface geology, however, is quite complicated. Evidence exists for extensive tectonics in the form of fractures, faults, and a global rift system (e.g., Greenberg et al. 1991; Schenk & Moore 2020; Beddingfield et al. 2022; Beddingfield & Cartwright 2022). It may have also experienced volcanic resurfacing in the form of three giant grooved structures called coronae that are at least 200 km across (e.g., Smith et al. 1986). Many mechanisms have been suggested to make the coronae, including mantle plumes/diapirs (Pappalardo et al. 1997) and sluggish-lid convection driven by tidal forces (Hammond & Barr 2014). Despite this, the majority of Miranda's surface is extensively cratered.
Ariel. Ariel is the second closest major satellite to Uranus. Ariel's size and bulk density are comparable to Dione in the Saturn system (1.66 versus 1.48 g cm−3, respectively) (Table 1). Ariel has experienced considerable resurfacing from both tectonics and volcanic flows (Schenk & Moore 2020). It also has no observed terrains that have been cratered to the same degree as the other Uranian moons. Instead, there are regions of lightly cratered plains that are cut by multiple intersecting troughs, low plains that reside within the troughs, and ridged and knobby plains elsewhere on the body.
The interior heat needed to resurface Miranda was likely produced by tidal dissipation, but Peterson et al. (2015) argue that ancient resonances with Ariel (2:1 resonance with Umbriel, 5:3 resonance with Miranda, or 4:1 resonance with Titania), together with Ariel's current low eccentricity, are insufficient to explain the required heat fluxes. This could suggest a need for induced heat via resonance locking mechanism (Fuller et al. 2016).
Umbriel. Umbriel, the third closest major satellite to Uranus, shares many basic traits with Ariel; its diameter of 1170 km is nearly the same, while its bulk density of 1.4 g cm−3 is only slightly smaller (Jacobson et al. 1992). Umbriel has the lowest albedo of the Uranian moons, many of which are covered by materials whose spectra looks like carbonaceous chondrites (e.g., Buratti & Mosher 1991; Afanasiev et al. 2014; Cartwright et al. 2020; Detre et al. 2020). Umbriel's observed surface is heavily cratered, with few obvious signs of other activity. Several subtle albedo features might be related to ancient tectonic features (Helfenstein et al. 1989), but they could also be the remnants of impact basins (Schenk & Moore 2020). The limited resolution of Voyager 2 images prevents a more detailed assessment of Umbriel's surface.
Titania. In some ways, Titania is the Rhea of the Uranian satellites. It is about the same size, and its surface is covered with cratered plains and tectonic fractures (Schenk & Moore 2020). On the other hand, Titania's bulk density of 1.71 g cm−3 is larger than Rhea's bulk density of 1.24 g cm−3, suggesting a much higher fraction of rock to ice (Jacobson et al. 1992). Titania also has an extensive system of fractures, graben, and scarps, but there is limited evidence for volcanic resurfacing. Tectonic features cut across many craters, indicating most are younger than the oldest cratered surfaces. Titania's albedo is intermediate between the darker Umbriel/Oberon and the brighter Miranda/Ariel. If we assume Titania's color is derived from implanted irregular satellite dust (e.g., Bottke et al. 2010), it could suggest a surface age between those worlds. The largest known crater is Gertrude, which is 326 km in diameter.
5.4.2. The Oldest Surface Ages for Miranda, Ariel, Umbriel, and Titania
Our work employs the crater SFDs determined by Kirchoff et al. (2022) for the most ancient terrains found on Miranda, Ariel, Umbriel, and Titania. These regions were defined by their crater spatial densities and are shown in their Figure 2. Specifically, we used cratered dense terrain for Miranda and cratered for Ariel, Umbriel, and Titania. Limited coverage and image resolution by the Voyager 2 mission meant that only 35%–45% of each satellite's surface had resolvable craters. The crater SFDs used here are shown in Figure 9.
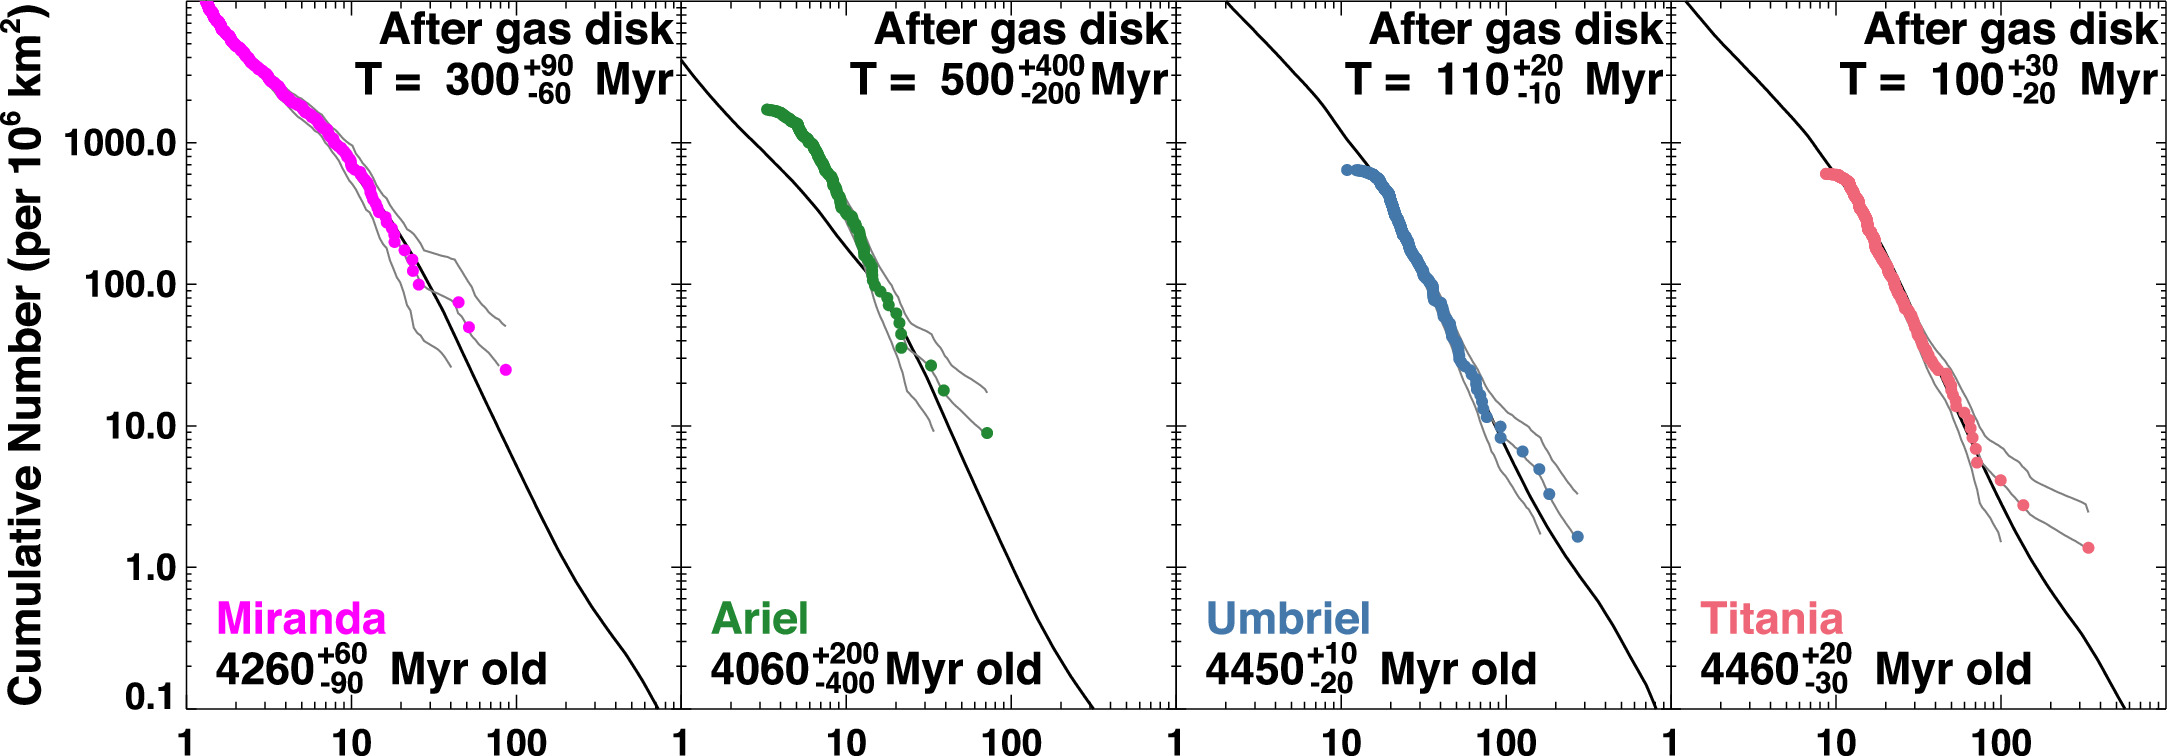
Figure 9. The model surface ages of the oldest terrains on Miranda, Ariel, Umbriel, and Titania. The observed crater SFDs come from Kirchoff et al. (2022). See Figure 6 for additional figure details. Miranda and Ariel are hundreds of Myr younger than Umbriel and Titania. Miranda is small enough to have been shattered and/or disrupted by early bombardment numerous times, while Ariel shows evidence for surface erasure driven by geologic activity. The shape of our crater production function matches Miranda's crater SFD for all observed sizes, while we find a mismatch with Ariel for Dcrat < 20 km craters, probably from those produced by planetocentric debris.
Download figure:
Standard image High-resolution imageOur crater production model fits to these crater SFDs are also shown in Figure 9, along with our derived error envelopes. We find that the median surface ages for these cratered terrains on Miranda, Ariel, Umbriel, and Titania are T = 300, 500, 110, and 100 Myr after solar nebula dispersal, respectively, with age errors provided in Table 1. All these ages are ancient, yet none are as old as the surface of Oberon, the most distant major satellite in the Uranus system, with an age of T = 40 Myr.
Miranda's age of T = 300 [+90, −60] Myr is modestly younger than that of Mimas (T = 400 [+200, −100] Myr), although their error bars overlap. This difference may partly stem from Miranda's factor of ∼4 higher collision probability (Table 1), which means it is hit by larger projectiles for a longer period. If all things were equal, this would result in more frequent shattering or disruption events and an increased rate of impact-driven resurfacing events. On the other hand, projectiles hit Mimas almost twice as fast as they hit Miranda (Table 1), which leads to projectiles making larger craters (Figure 3). Accordingly, the impact velocity trades against the collision probability in this circumstance.
Ariel's model surface age of T = 500 [+400, −200] Myr makes it the youngest of the midsized Saturnian and Uranian moons. In fact, Ariel is ∼200 Myr younger than similar-sized worlds like Tethys and Dione. In one sense, this is curious; Ariel's collision probability is a factor of ∼2–2.5 higher than Tethys/Dione, while its impact velocity is half as large (Table 1). The reason for Ariel's apparent youth is that it has experienced extensive tectonic resurfacing and volcanism. So far, models of Ariel's tidal and thermal evolution do not provide enough internal heating to explain observations. For example, Ćuk et al. (2020) find that the 5:3 MMR between Ariel and Umbriel was unlikely to produce Ariel's geological activity, which Peterson et al. (2015) estimate requires 28–92 mW m−2, values comparable to the heat flow from Earth's interior. There are also reasons to think that Ariel may be an ocean world, which could be tested with magnetometer readings from the proposed Uranus flagship (Weiss et al. 2021).
It should be noted that the crater SFD for Dcrat < 20 km craters on Ariel does not match our crater production model (Figure 9). The mismatch is similar to those seen on Mimas, Tethys, Dione, and Rhea (Figure 7). As discussed in Section 5.2.3, we postulate this may be a signature of planetocentric debris, possibly produced by a shattering impact onto Ariel. Given that we have yet to see large portions of Ariel, Umbriel, Titania, and Oberon, it is also possible that a large unseen basin produced enough ejecta to be the source for these Dcrat < 20 km craters. New investigations of the Uranus system by the proposed NASA flagship may be needed to resolve this issue.
Umbriel and Titania have older surfaces' ages (T = 110 [+20, −10] and 100 [+30, −20] Myr, respectively). These ages are comparable to those found on Rhea (T = 130 [+30, −20] Myr). Their collision probabilities are a factor of ∼2 higher, but that trades against impact velocities that are a factor of 1.7–2.2 lower than Rhea's (Table 1; Figure 3). We do find that Titania's younger age compared to Oberon is consistent with its higher albedo, as discussed above concerning the implantation of irregular satellite dust (i.e., younger surfaces should have less dark material). The explanation works less well for Umbriel, whose age is comparable. As with the other worlds discussed in the last two sections, Umbriel and Titania are also missing their earliest history, possibly from shattering events and impact-driven resurfacing.
5.5. The Surface Ages of the Small Inner Satellites of Saturn
We now move from the midsized satellites to smaller objects. Numerous small satellites in the Saturn system were imaged by the Cassini mission at high enough resolution to map their relatively extensive crater histories (Thomas et al. 2013). These worlds were found in a variety of dynamical contexts. Some track the F ring (i.e., Prometheus and Pandora), others are coorbitals between the F ring and Mimas (Janus and Epimetheus), and several orbit the libration points of Tethys (Telesto, Calypso) and Dione (Helene). These seven bodies have irregular shapes and high crater spatial densities, indicating they have experienced substantial bombardment over time. Some or most may even have crater populations that are near or in saturation equilibrium. On the other hand, interactions with ring particles and/or returning ejecta, most presumably accreting at very low relative velocities, may have buried the smallest craters on these worlds.
Overall, Thomas et al. (2013) found that the moons above have a crater size range that stretches from a few tens of meters to many tens of kilometers or more. The shapes of their crater SFDs are not only comparable to one another (see Figure 17 of Thomas et al. 2013), but they are reminiscent of the shape of our crater production SFD. Specifically, the shapes follow a steep power-law slope for Dcrat > 10 km craters that transitions to a shallower slope for Dcrat < 10 km craters. By inspection of the crater SFDs, we infer that crater erasure processes, while active, have mainly eliminated craters on these worlds smaller than several hundreds of meters to 1 km. This gives us reasonable confidence that there is sufficient data to date their surfaces using our model.
We will compare the crater SFDs found on these worlds to our crater production model in Sections 5.5.1–5.5.3. After doing so, we will discuss an alternative way to interpret their crater SFDs in Section 5.5.4.
5.5.1. Prometheus and Pandora
We start with Prometheus and Pandora, which are the closest of the seven worlds to Saturn. They are elongated bodies that shepherd Saturn's F ring. Their mean diameters are 86.2 ± 2.4 km and 81.2 ± 3.0 km, respectively, while their bulk densities are near 0.5 g cm−3 (Thomas et al. 2013). Befitting objects near rings, they have semimajor axes just outside Saturn's Roche limit at 2.28 and 2.35 Saturn radii, respectively. Both have very small eccentricities and inclinations. Their proximity to Saturn also means they have impact velocities with heliocentric objects that approach 30 km s−1 (Table 1).
Their crater SFDs, and our best-fit model, are shown in Figure 10. Note that we have removed the smallest crater bins from the size distribution where crater erasure and/or image limitations are affecting the data (i.e., these points have essentially the same value as the next largest crater size bin on the cumulative plot; when connected, they make a horizontal line). We find median ages of T = 230 and 200 Myr after solar nebula dispersal, which makes them both 170–200 Myr older than the median surface age of Mimas (T = 400 [+200, −100] Myr).

Figure 10. The model surface ages of Prometheus, Pandora, Epimetheus, and Janus. The observed crater SFDs come from Thomas et al. (2013). See Figure 6 for additional figure details. The satellites are all located between Saturn's rings and Mimas, and have diameters of 86, 81, 116, and 178 km, respectively. Their crater retention ages are older than the surface age of Mimas. The shapes of their SFDs are consistent with our crater production function as well; all have a shallow branch starting near Dcrat < 10 km craters. This shape, however, is also consistent with smaller craters on Mimas (Figure 7), so we cannot rule out the possibility that they were produced by planetocentric debris.
Download figure:
Standard image High-resolution imageThe visual match between model and data appears reasonable, but we suspect that the very high velocities combined with the low bulk densities of the targets are modestly affecting our fits for smaller craters (Figure 3). It is possible that our one-size-fits-all scaling law requires slightly different input parameters, but we lack sufficient data to test this hypothesis.
5.5.2. Epimetheus and Janus
Next, we consider the coorbitals Epimetheus and Janus. They are relatively large bodies for the small satellites, with mean diameters of 116 and 178 km, respectively. Their mean densities are essentially the same, 0.63–0.65 g cm−3. These values are modestly higher than those of many other small satellites (Thomas et al. 2013). Epimetheus and Janus have semimajor axes of 2.5 Saturn radii, with small eccentricities and inclinations of 014 and 034, respectively. These bodies are in horseshoe orbits, such that they exchange orbits every 4 yr (e.g., Yoder et al. 1989). The moons are roundish in shape and are heavily cratered, with their crater SFDs shown in Figure 10.
The best fits between our model crater production function and the crater SFDs of Epimetheus and Janus yield median surface ages of T = 190 and 150 Myr after solar nebula dispersal. These ages are comparable to each other as well as those of Prometheus and Pandora above, especially when error bars are considered (Table 1). All four of these moons are also considerably older than the derived surface age of Mimas, although other possibilities exist, as we will discuss in Section 5.5.4.
It has been suggested that Epimetheus and Janus were derived from the same parent object that was disrupted by some impact (e.g., Treffenstädt et al. 2015). Our results are modestly supportive of this idea; both worlds have similar surface ages, and a bombardment taking place prior to this time would have readily supplied the impactor that disrupted the putative parent object. With that said, getting fragments to enter into a coorbital system is a complicated affair, and more work on this topic is needed.
5.5.3. Telesto, Calypso, and Helene
We now consider the Trojan worlds of Tethys (Telesto, Calypso) and Dione (Helene). A second Trojan of Dione called Polydeuces is not considered; it is only a few kilometers in diameter and was not well imaged by Cassini. By definition, the Trojans have the same semimajor axes as their host worlds and low enough eccentricities that they can orbit within the stable regions near their L4 and L5 Lagrange points. The inclinations of Telesto and Calypso are between 12 and 15, while Helene's inclination is approximately 0°.
Telesto and Calypso are elongated, with mean diameters of 24.8 ± 0.8 km and 19.2 ± 0.8 km. Helene is larger and more roundish, with a mean diameter of 36.0 ± 0.8 km. All three show signs of substantial downslope movement of surface materials. Thomas et al. (2013) have suggested the drainage patterns look reminiscent of terrains found on the Martian moon Deimos.
The crater SFDs for these three Trojans are shown in Figure 11. For Helene, we used craters identified on the leading side of Helene, which is roughly between 0° and 180° longitude. They are shown as triangles in the leftmost plots from Figure 17 of Thomas et al. (2013). We opted to use this set because there are more large craters with Dcrat > 3 km than in the sub-Saturn crater population located between 300° and 360°. It is denoted by cross symbols on the same plot. Note that the shape of the crater SFD on the leading side is similar to the crater SFDs found on the other small satellites (Thomas et al. 2013; their Figure 17). The crater SFD of the sub-Saturn population has a limited size range with a cumulative slope near −2 for craters between 1 and 6 km.
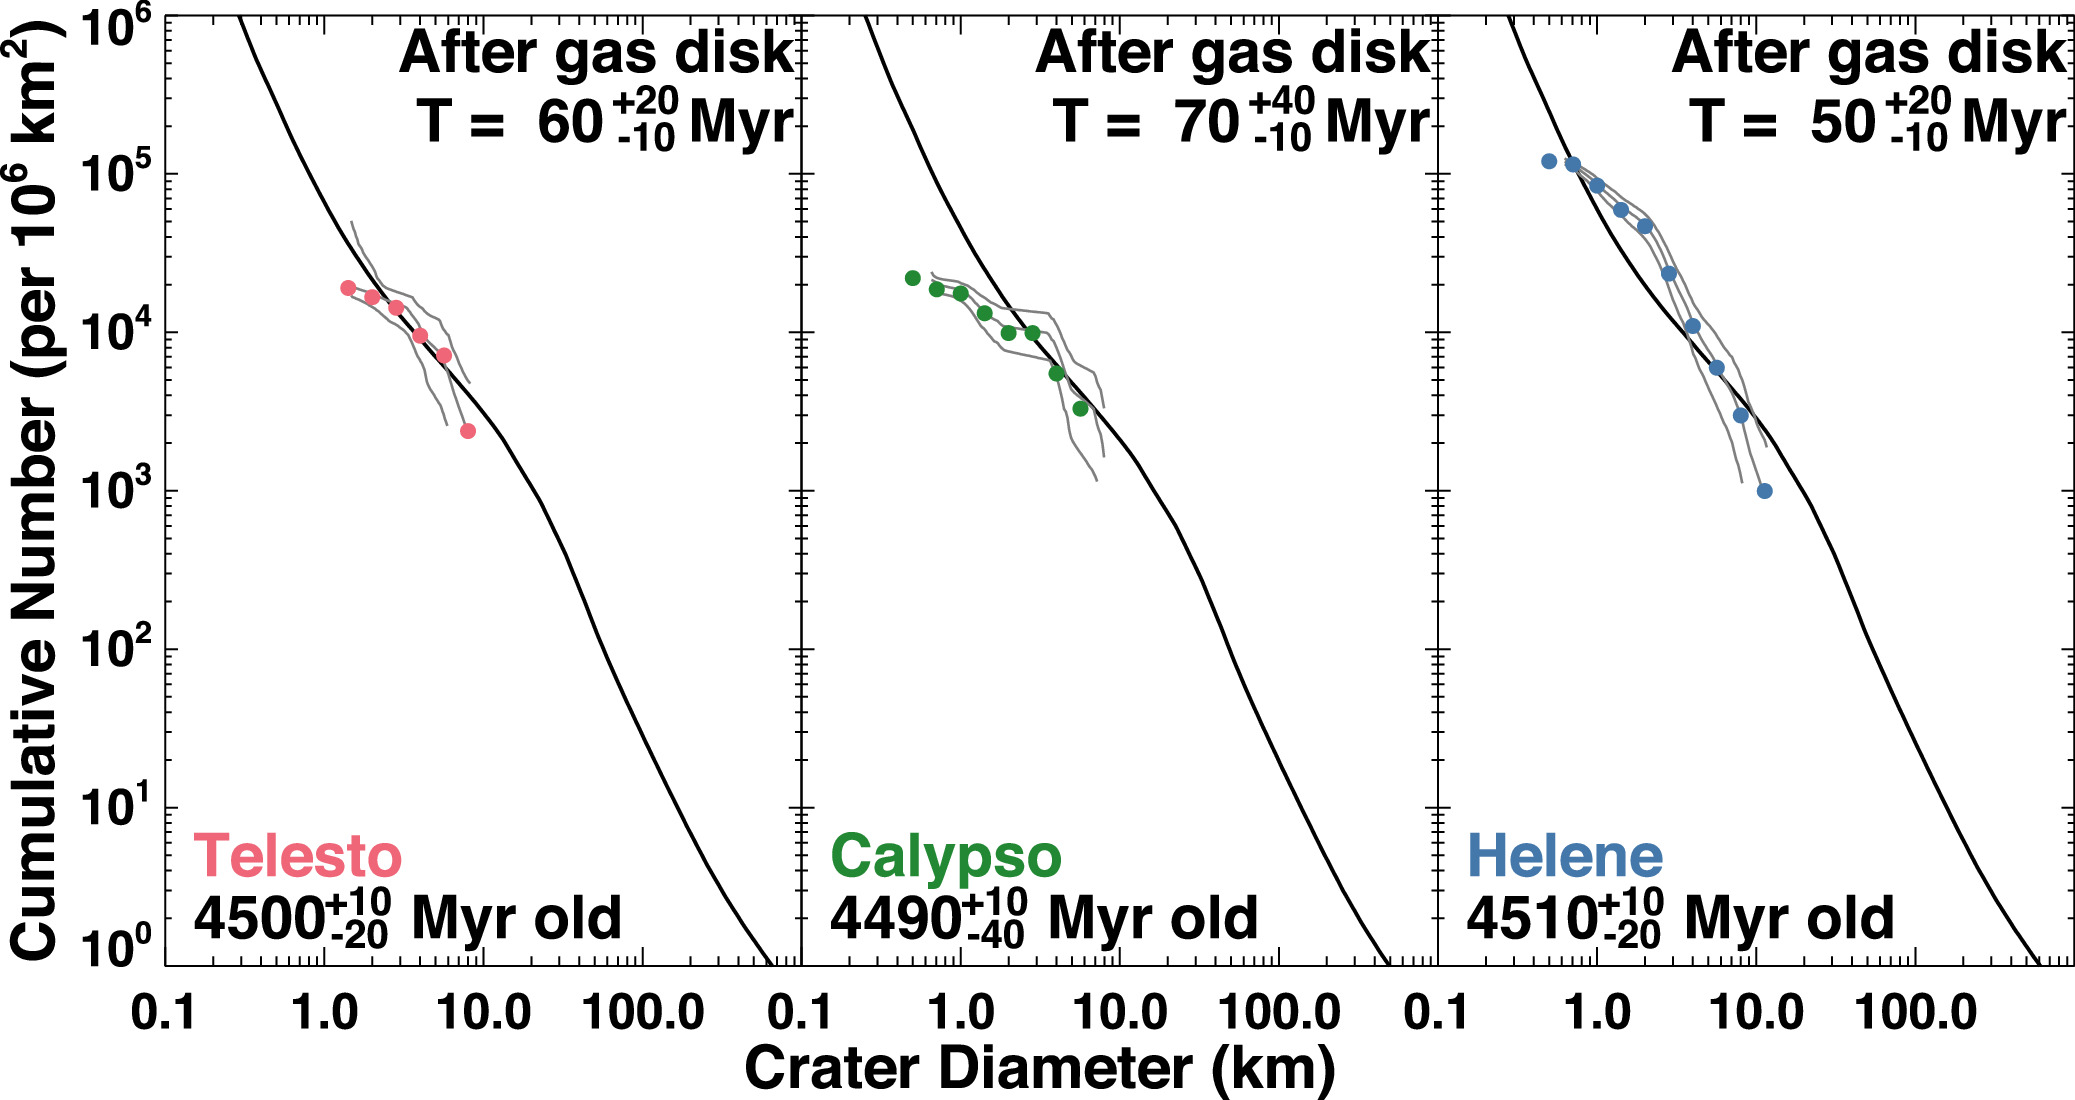
Figure 11. The model surface ages of Telesto and Calypso, both Trojans of Tethys, and Helene, a Trojan of Dione. The observed crater SFDs come from Thomas et al. (2013). See Figure 6 for additional figure details. The moons have diameters of 25, 19, and 36 km, respectively. Their crater retention ages considerably older than the oldest surfaces of their host satellites Tethys (T = 280 Myr) and Dione (T = 260 Myr) (Figure 7). All of the Trojan ages correspond to the heavy bombardment era of Tethys and Dione. As with the small satellites in Figure 10, the shapes of their SFDs have a shallow branch for Dcrat < 10 km craters, as predicted by our crater production model but also by planetocentric debris as shown by small craters in Figure 7.
Download figure:
Standard image High-resolution imageThe interested reader should also examine the crater SFDs for Helene shown in Hirata et al. (2014). They use different definitions for their terrains than Thomas et al. (2013), so making a comparison between the two is not straightforward. Further analysis of this topic is beyond the scope of this paper.
The median surface ages for Telesto, Calypso, and Helene are T = 60, 70, and 50 Myr after solar nebula dispersal. In contrast, the median surface ages of Tethys and Dione are T = 280 and T = 260 Myr after solar nebular dispersal (i.e., they are younger by ∼200 Myr, respectively). One way to interpret these ages is that Telesto, Calypso, and Helene originated during early heavy bombardment when Tethys and Dione were both getting hit by D > 100 km bodies. Given this timing, and the small size of the Saturnian Trojans, we postulate these bodies may be surviving ejecta from the major satellites that either reaccreted near the Lagrange points, as suggested by Smith et al. (1982), or found a dynamical pathway into the stable regions via encounters with large fragments (e.g., as inferred from the dynamical runs shown in Hyodo & Charnoz 2017). We will discuss this issue further in Section 6.6.
5.5.4. Alternative Surface Age Possibilities
Using our crater production model, we find that these small satellites are older than their nearest associated midsized satellite, namely Mimas, Tethys, and Dione. Assuming these ages are valid, they describe either their formation time or the last time the bodies experienced a shattering or disruption event. These surface ages may also be lower limits, with their crater spatial densities influenced by crater saturation. Either way, these ancient ages are not a fluke; as we discuss further in Section 6.4, none of these worlds is likely to be struck by a projectile large enough to disrupt them over the long interval represented by their surface ages (i.e., ∼4.4–4.5 Gyr). Some protection is provided by the shallow shape of the projectile SFD for D < 1 km (Figure 1). Fewer small craters help to hold off the onset of crater saturation, with large craters less likely to be removed by cookie cutter erasure (Melosh 1989).
An alternative interpretation is that we have misapplied our crater production model in our analysis of these worlds. Consider that the crater SFDs on Mimas, Tethys, and Dione show mismatches between our model crater SFD and observed craters for Dcrat < 20 km. We argued in Section 5.3.1 that the source of these craters was possibly long-lived ejecta that was reaccreted from the last surface reset event occurring on those worlds. If true, the ejecta from these events would provide a source of additional bombardment for Telesto, Calypso, and Helene, the Trojans of Tethys and Dione. This would imply that their surface ages are probably as old as the oldest surfaces on Tethys and Dione. Similarly, surface reset events on Mimas or other more distant worlds with high-speed ejecta could produce an additional source of bombardment for Prometheus, Pandora, Epimetheus, and Janus, the innermost satellites of Saturn.
Possible support for this idea comes from the shapes of the SFDs found on Mimas, Tethys, and Dione, which is steep for Dcrat > 10–20 km craters but surprisingly shallow for Dcrat < 10–20 km craters (Figure 7). This shape is different from those found on the cratered plains of Enceladus, which stays relatively steep for few km < Dcrat < 20 km craters. The shallowness of the former could be an indication that those putative planetocentric projectile populations experienced some degree of collisional evolution prior to impact. Here, the shallow shape would be a byproduct of the disruption law affecting the debris, which is assumed here to be comparable to that of cometary materials (Bottke et al. 2023). The reason the Enceladus crater SFDs stay steep to smaller sizes is unknown, but collisional evolution works faster when there is more mass available. Perhaps, the surface reset event for Mimas, Tethys, and Dione involved a larger impact event with more ejected mass, while the one from Enceladus involved less mass.
The bottom line is that, if this ejecta bombardment hypothesis is valid, the surface ages of the small satellites would presumably be bracketed between the crater production ages determined in Sections 5.5.1–5.5.3 and the surface ages of the nearest midsized satellite, namely Mimas, Tethys, and Dione. As listed in Table 1, this would yield age ranges of the following:
- 1.Prometheus/Pandora between T = 200 [+20, −40] and 400 [+200, −100] Myr;
- 2.Epimetheus/Janus between T = 150 [+20, −20] and 400 [+200, −100] Myr;
- 3.Telesto/Calypso between T = 60 [+20, −10] and 280 [+120, −70] Myr;
- 4.Helene between T = 50 [+20, −10] and 260 [+70, −50] Myr.
These extended surface age ranges are still a potential challenge to models that would make the midsized satellite from a more massive ring of Saturn (Crida & Charnoz 2012) or from a recent disruption event (e.g., Ćuk et al. 2016). Our thoughts on the origins of the midsized Saturn satellites will be discussed further in Section 7, while those on the Trojans will be discussed in Section 6.6.
5.6. The Curious Ages of the Giant Satellites: Europa, Ganymede, Callisto, and Titan
In this section, we discuss four of the largest giant planet satellites, namely Europa, Ganymede, Callisto, and Titan. Each is between 3100 and 5300 km in diameter, which is ∼2–∼3 times the size of the largest midsized satellites (e.g., Rhea, Iapetus, Titania, Oberon). All four satellites have crater SFDs that can be analyzed with our crater production model. We have excluded Io from this list because it lacks observable craters. Triton is also left out because its crater SFD may come from ejecta produced by impacts on small satellites near Triton (Schenk & Zahnle 2007; see also Section 2.1).
Interpreting the crater histories of these giant satellites has its own set of challenges. For example, it is unclear whether a crater scaling law verified using crater SFDs on Ceres or the small/midsized satellites can be applied to such enormous worlds without any modifications to the input parameters. As a second example, the crater SFDs on Ganymede and Callisto have different shapes over the same size range (Schenk et al. 2004), an effect that may be unrelated to crater modification processes. As we will argue below, we believe these two issues are telling us that changes are needed to model crater SFDs on these moons.
5.6.1. Description of the Satellites
Europa. Europa is the smallest of the four Galilean satellites, with a diameter of 3121.6 km (Table 1). It is differentiated and is believed to harbor a subsurface ocean underneath an icy shell, making it an excellent target for NASA's upcoming Europa Clipper mission (Howell & Pappalardo 2020), which is scheduled to launch in 2024. Tidal forces driven by the Laplace resonance between Io, Europa, and Ganymede pump heat into the interior of Europa, leading to tidal dissipation within the ice that controls its thickness. Tidal forces also give the ice shell mobility, helping to explain not only the plethora of geologic features found on its surface (e.g., ridges, domes, pits, bands, chaotic terrains, blocks, etc.; Carr et al. 1998; Pappalardo et al. 1998; Sullivan et al. 1998) but also its paucity of primary craters (Bierhaus et al. 2005). Europa has the youngest surface of all three icy Galilean satellites.
Ganymede and Callisto. Ganymede and Callisto are the two largest and most heavily cratered bodies of the Galilean satellites. In some ways, they can be considered twin bodies, with diameters of 5268 and 4817 km, respectively, and bulk densities of 1.94 and 1.83 g cm−3, respectively (Table 1). In other ways, the two worlds appear to have followed very different evolutionary pathways, partly because of tidal heating but also because they may have experienced different degrees of bombardment (Barr & Canup 2010; also see Nesvorný et al. 2023; and Table 1).
Ganymede is strongly differentiated (Anderson et al. 1996), with a metallic core and a magnetic field that indicates the existence of a core dynamo (Gurnett et al. 1996; Kivelson et al. 1996, 2002). The Laplace resonance with Io and Europa means that Ganymede is the recipient of substantial tidal heating from Jupiter (e.g., Burns 1986). Overall, Ganymede is about 60% rock and 40% ice, with a subsurface ocean that probably lies hundreds of kilometers below the surface (Kivelson et al. 1999; Saur et al. 2015, 2018).
Ganymede's icy exterior shows signs of substantial tectonics in the form of grooved terrains; these younger bright regions make up about two-thirds of its surface (Schenk et al. 2001). The remaining third consists of dark terrains that are heavily cratered (Pappalardo et al. 2004). These ancient regions are also covered with a series of concentric furrows centered at (20°S, 180°W). It is postulated that they formed by the early impact of 100 to 300 km diameter projectile (Hirata et al. 2020; see Section 4).
Callisto is the most distant of the Galilean satellites from Jupiter. It is not in resonance with any other moon, so it experiences little in the way of tidal dissipation. This behavior likely explains why it shows no evidence for tectonic or volcanic features (Moore et al. 2004). Callisto has a mixed ice-rock interior comparable in bulk composition to Ganymede but may only be partially differentiated (Schubert et al. 2004). So far, there is no evidence for an internally generated magnetic field (Khurana et al. 1997). It is possible that Callisto has a subsurface ocean, as deduced from the presence of an induced magnetic field (e.g., Khurana et al. 1998), but there is considerable uncertainty on this issue (e.g., Hartkorn & Saur 2017).
Callisto's surface is dominated by heavily cratered terrains akin to the dark regions found on Ganymede. A layer of dark material on Callisto (and Ganymede) may be the consequence of a collapsed atmosphere (Griffith & Zahnle 1995) or dust produced by collisions among the irregular satellites, with the material delivered via Poynting–Robertson drag (Bottke et al. 2013).
Titan. Titan is the largest satellite in the Saturn system. Its diameter of 5150 km is between those of Ganymede and Callisto. Titan differs from those worlds in that it has a dense atmosphere composed primarily of nitrogen (∼98%) and methane (∼2%) (Bézard et al. 2014). This atmosphere gives rise to a host of phenomena not seen on Europa, Ganymede, or Callisto, such as weather, precipitation, lakes at the higher latitudes, river channels, and dune fields near the equator (e.g., Stofan et al. 2007). Titan also has an abundance of organic materials. This diversity of terrains was a major factor in Titan being chosen as the target of NASA's Dragonfly mission.
Despite ample evidence for weathering and surface erosion, it is unclear whether Titan has experienced meaningful tectonism or cryovolcanism. The lack of obvious evidence for geologic activity has prompted some to suggest Titan is a Callisto-like world that happens to have an atmosphere (Moore & Pappalardo 2011; see Lopes et al. 2007 for a contrasting view).
An analysis of Cassini gravity data indicates Titan has a rigid exterior shell of ice that is at least 40 km thick, whereas a low-rigidity ice shell would be more indicative of a geologically active world (Hemingway & Mittal 2019). Despite this, gravity and orbital data suggest that Titan has a deformable interior and a subsurface ocean, and thus may have differentiated into a rocky core and exterior hydrosphere (e.g., Sotin et al. 2021).
This argument stands in contrast to Titan's eccentricity of 0.03, which presumably should have been eliminated by tidal forces if it had a highly dissipative interior. The origin of Titan's eccentricity is mysterious, so some suggest Titan could have formed relatively recently (Ćuk et al. 2016; Lainey et al. 2020) or that the eccentricity was produced by a recent encounter with a destabilized Iapetus-sized moon (Wisdom et al. 2022).
5.6.2. The Oldest Surface Ages for Europa, Ganymede, Callisto, and Titan
Initially, we thought calculating the oldest surface ages on Europa, Ganymede, Callisto, and Titan satellites would be a simple application of the crater production model used on the small and midsize satellites. For reasons that will become more apparent below, however, these worlds appear to require a different crater scaling law. To help justify this change, we start with our analysis with Ganymede, the largest satellite of the giant planets (Figure 12).

Figure 12. The model surface ages of the bright and most ancient terrains on Ganymede. The observed crater SFDs come from Schenk et al. (2004). See Figure 6 for additional figure details. The two curves represent the crater scaling law discussed in Section 3.3 (red), used for the small and midsized satellites, and Section 5.6 (green), which was formulated for the largest satellites (also see Figure 3(d)). The surface ages derived from the red curves are older and provide a poor fit to the shape of the observed crater SFD. The green curves yield a better fit, which means enough time has passed for collisional evolution in the destabilized population/scattered disk to change the shape of the crater SFD from concave to convex.
Download figure:
Standard image High-resolution imageThe Ganymede crater SFDs used here come from Schenk et al. (2004). They include the most ancient, cratered surfaces and so-called bright terrains, large regions of ridges and grooves that cut across older, darker terrains. The crater counts, collected globally, range in size from 30 to 600 km. They include large craters of different morphologies, such as palimpsests and multiring structures.
The red curves in Figure 12 show the best fit between our standard crater production model and the crater SFDs. They indicate that the bright and ancient terrains have median surface ages of T = 380 and 280 Myr after the dissipation of the gas disk. This would place Ganymede's oldest ages in the same ballpark as those of the inner midsized satellites of Saturn and Uranus (Table 1). The problem is that the red model curves have the wrong shape; both crater SFDs have a convex shape, while the red model curves have a more concave shape. For the bright terrains, the match between model and data becomes unsatisfying for Dcrat < 100 km craters, while, for the ancient terrains, the model is outside the error envelope for most Dcrat < 70 km craters.
In order to better understand why the crater SFD on Ganymede would have a different shape than those on the small and midsized satellites, we examined how the destabilized population undergoes collisional evolution over time. Our results in Figure 1 show that projectiles between 1 < D < 10 km become increasingly steep as time passes, which effectively changes the SFD from a concave to a convex shape. This behavior takes many hundreds of millions of years or more to develop in the destabilized population, such that it can only be found on relatively young surfaces that are also large enough to sample a substantial number of these impactors. Accordingly, we infer that Ganymede's bright and ancient surfaces are considerably younger than suggested by our existing crater production model.
As mentioned above, Europa, Ganymede, Callisto, and Titan are several times larger than Ceres or the largest midsized satellites. We postulate that this size difference may lead to different near-surface properties for each world. If true, we need to find an alternative crater scaling law that can explain observations.
Our first step was to adopt a formulation for how transient craters collapse that was solely based solely on Ganymede and Callisto craters (McKinnon & Schenk 1995). It has the form of

McKinnon & Schenk (1995) claim this formulation is accurate to 15%, with the final crater volumes accurate to 50%. We assume this relationship is appliable to all four of the large satellites discussed in this section.
Our second step was to test alternative input parameters for Equation (1) that would then be combined with Equation (2). After considerable trial and error, we found success using input parameters near but not identical to the settings identified for cold ice from Table 1 of Holsapple (2022). Specifically, we found that the input parameters k = 1.1, μ = 0.55, and yield strength Y = 3.5 × 10⁸ dynes cm−2 gave us reasonable matches to the shapes of the crater SFDs on Ganymede, while also matching Europa, Callisto, and Titan, as we will show below. Note that the ν value is not meaningful here because we are assuming the projectile and near-surface bulk density is similar, although Holsapple (2022) suggests making it 0.33 for cold ice. The crater scaling law functions produced for these moons are shown in the last panel of Figure 3. It has a different overall shape than those for the small and midsized satellites.
We caution the reader that our selected input values for Equation (1) are unlikely to be unique. They are merely the best we can do to match the available crater constraints in a reasonable manner. Additional formulations can and should be tested when improved crater data are available from ESA's JUICE or NASA's Europa Clipper missions.
Our revised results for Ganymede are shown as the green curves in Figure 12. For reference, the ratio between crater and projectile sizes, defined as f, yields values between f ∼ 23–26 for projectile diameters 1 < D < 30 km (Figure 3(d)), with Ganymede's impact velocity set to 20.3 km s−1 (Table 1). Given that our projectiles now make larger craters than in our standard crater production model, the surface ages become substantially younger, with the bright and ancient terrains having median surface ages of T = 1600 and 1200 Myr after the dissipation of the gas disk. Our new crater production model now matches the convex shape of the crater SFDs at all sizes for both the ancient and bright terrains, and chi-squared fits between model and data that are much better than before.
This match led us to apply our revised crater production model to Europa, Callisto, and Titan (Figure 13). Their mean impact velocities are 25, 20, and 11 km s−1, respectively (Table 1), while their crater scaling laws are shown in Figure 3(d). The crater SFDs for Europa and Callisto come from Zahnle et al. (2003), Schenk et al. (2004), while those on Titan come from the work of Hedgepeth et al. (2020).
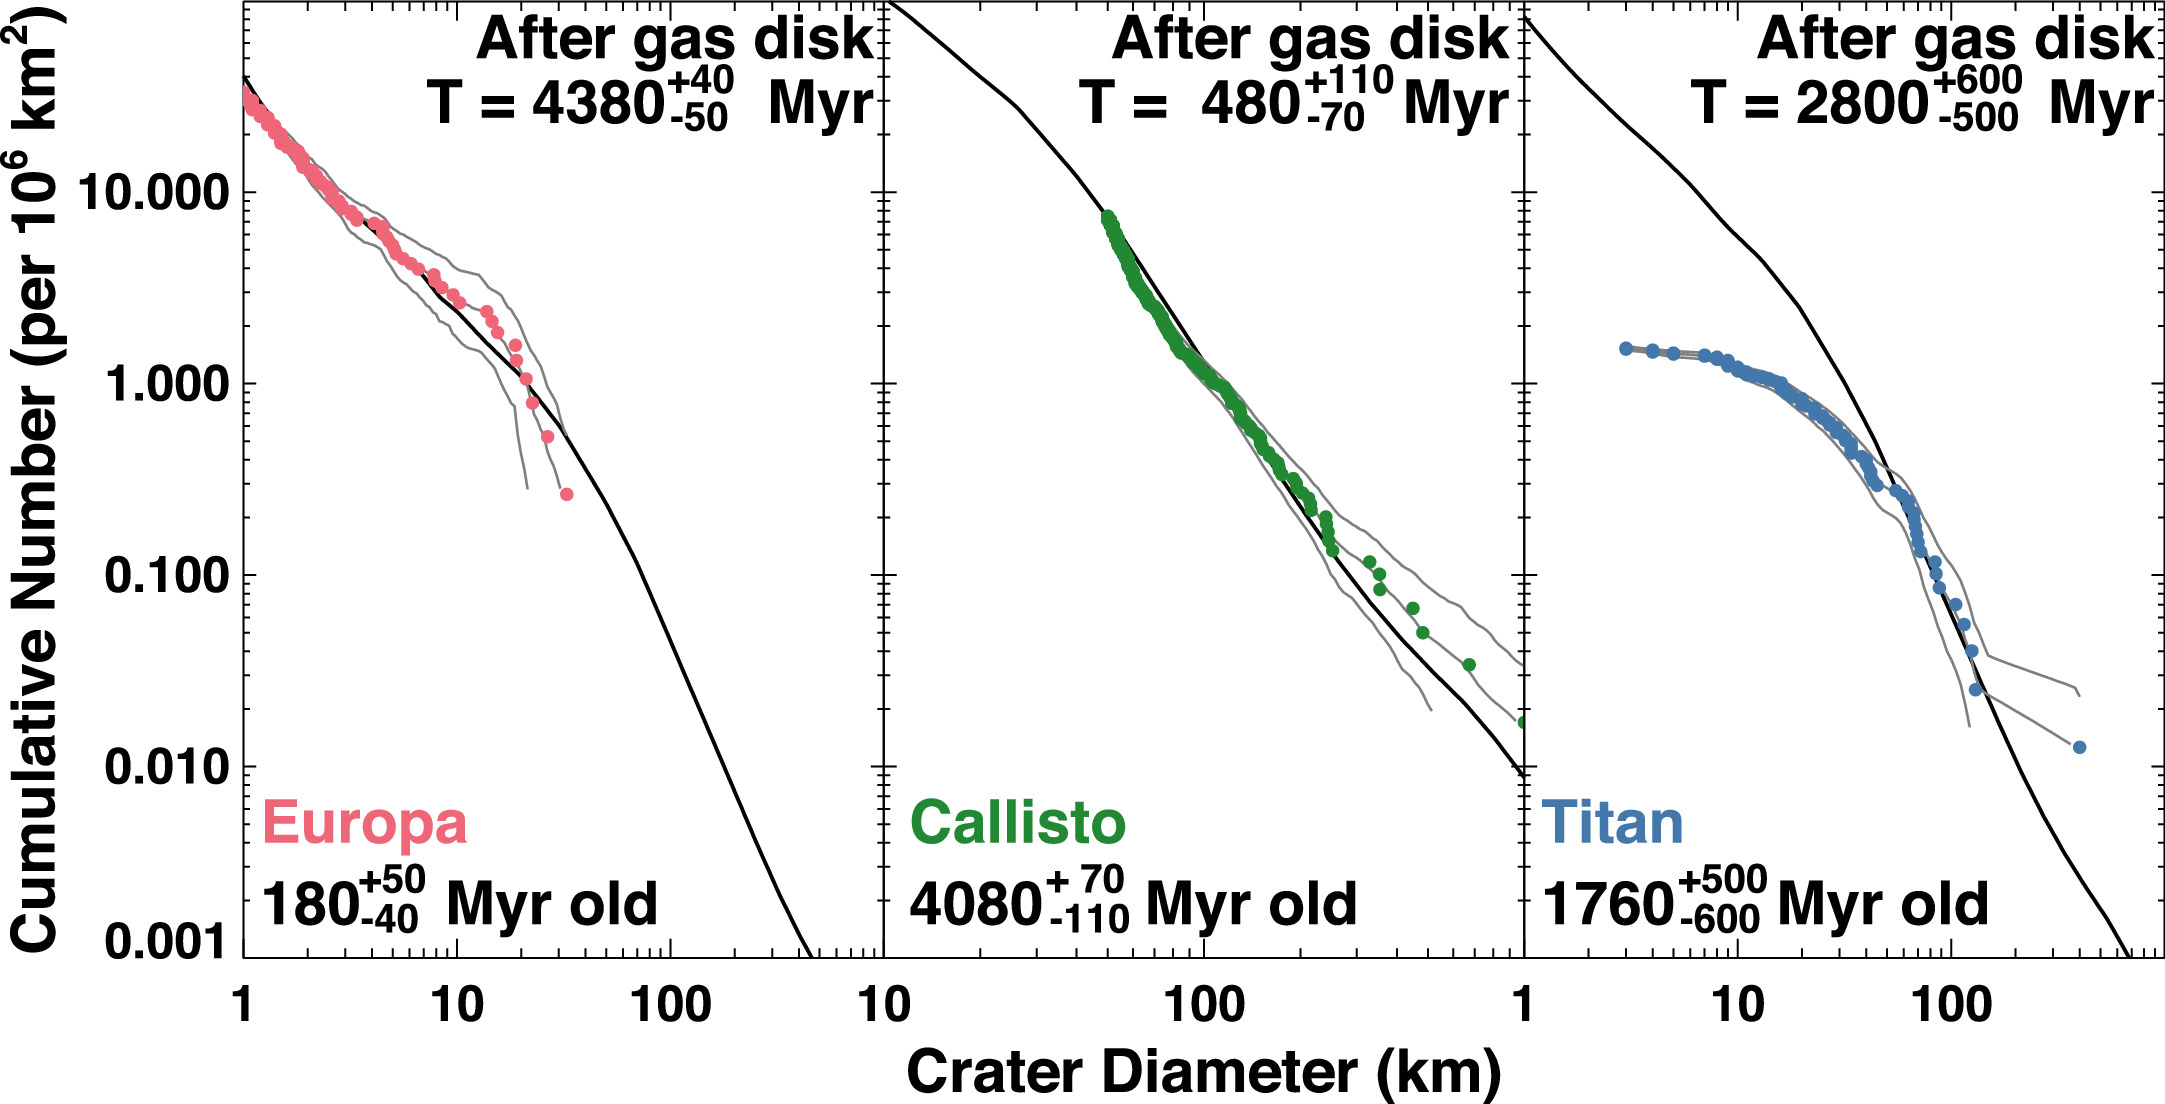
Figure 13. The oldest model surface ages of Europa, Callisto, and Titan. The observed crater SFDs come from Schenk et al. (2004; Europa, Ganymede, Callisto) and Hedgepeth et al. (2020; Titan). See Figure 6 for additional figure details. Here, we use the crater scaling law from Section 5.6 (also see Figure 3(d)). Europa has by far the youngest surface of the three, but Ganymede and Callisto are also younger than the oldest surfaces on many small and midsized satellites. Titan's surface age, determined using a fit to the largest craters, is 1.8 Ga. Smaller projectiles have an increasingly difficult time getting through Titan's atmosphere, explaining why Titan has a paucity of Dcrat < 40 km craters.
Download figure:
Standard image High-resolution imageFor reference, the Europa craters form the basis of the Case A crater production model from Zahnle et al. (2003). They follow a steep power-law slope for Dcrat > 20 km craters and a shallower branch for smaller craters. There are observed subkilometer craters on Europa, but studies of their distribution and geologic context indicate they are dominated by secondaries (Bierhaus et al. 2005). This confounding property makes it difficult to test our model's prediction that Europa's crater SFD should steepen again near Dcrat < 2 km. Only a small fraction of Europa's surface was imaged at high resolution by Galileo, however, so this issue will likely be solved by the upcoming Europa missions.
Overall, the fits between our revised crater production model and the crater SFDs for Europa, Callisto, and Titan are very good. The median surface age for Europa is T = 4380 Myr after solar nebula dissipation or 180 Myr old. We note that this value is about 2.6 times older than the 70 Myr old age given by Zahnle et al. (2003), with the difference mainly coming from our use of the revised impactor calibration provided by Dones et al. (2009).
As an aside, it should be noted that Cox et al. (2008) has argued that the chaos terrains across Europa were caused by impacts punching through the ice. For this hypothesis to be true, our crater production model would need to have a much steeper power-law slope for subkilometer projectiles than suggested by the work in Bottke et al. (2023). There would also need to be substantial crater erasure mechanisms at work on Europa that can get rid of sub-20 km craters. We are skeptical of both possibilities.
For Callisto, we get a median age of T = 480 Myr after solar nebula dissipation (Figure 13). This value is nearly 700 Myr older than Ganymede yet is it still younger than most of the midsized satellite surface ages calculated in the Saturn and Uranus systems (Table 1). This age difference indicates that Callisto was highly susceptible to having its early surface erased by major impact events, an issue we will revisit in Section 6.4.
Titan's crater history has been strongly influenced by its atmosphere. Like Venus, smaller impactors disrupt in the atmosphere and may not leave behind any prominent surface features (Korycansky & Zahnle 2005). Our crater production model yields a best fit to craters that are Dcrat > 40 km in size, with smaller craters increasingly depleted (Figure 13). Our median surface age for our modified crater production model is T = 2800 Myr after solar nebula dissipation, or 1760 Myr ago. This value is older than several previous ages found in the literature (i.e., ∼0.2–1 Gyr old; Artemieva & Lunine 2003; Neish & Lorenz 2012) but is arguably comparable to a recent estimate (Rossignoli et al. 2022).
The oldest surfaces of Ganymede and Callisto are many of hundreds of Myr younger than the surface ages of most midsized and smaller satellites. One could argue that their younger ages might be a byproduct of tidal dissipation, but this explanation does not explain Callisto's surface, which shows no sign of surface activity.
Using our model, we find that the largest median object to hit Callisto after T ∼ 480 Myr is D ∼ 60 km, while the projectile size striking Ganymede after T ∼ 1200 Myr is D ∼ 40 km. These projectile sizes should yield impact basins comparable in size to the largest observed basins on each world (i.e., Valhalla on Callisto, which is ∼1000 km, and Gilgamesh on Ganymede, which is 583 km; Schenk et al. 2004; Figure 3). Our prediction is that modestly larger impactors hitting each world at earlier times produced regional or global erasure events that reset the surface. We will discuss this issue further in Section 6.3.
5.7. Model Surface Ages from the Literature
As introduced in Section 2.1, many different groups have calculated model surface ages for the giant planet satellites. It is a challenging task because good results depend on the accuracy of the following components: (i) precise crater SFDs for ancient satellite surfaces, (ii) knowledge of the impacting SFD and how it changed over solar system history, (iii) collision probabilities and impact velocities between the projectiles and a satellite surface, and (iv) a reasonable crater scaling law that can convert projectiles into craters. Pioneering early works, like Smith et al. (1982), are at a disadvantage compared to more modern studies that can build on crater counts derived from Galileo and Cassini images, our increasing knowledge of various comet populations, and new models that account for the early migration and dynamical evolution of outer solar system bodies.
Here, we focus on work that is contemporaneous to or younger than that of Zahnle et al. (2003). Zahnle et al. (2003) derived an SFD and impact flux for the impacting population based on comet observations, young craters on satellite surfaces, and a variety of additional constraints. For younger surfaces like Europa, our surfaces' ages are essentially in agreement with their Case A work, except we employ a revised flux normalization provided by Dones et al. (2009). This change makes our model surface ages for Europa about 2.6 older than predicted by Zahnle et al. (2003).
For older surfaces, Zahnle et al. (2003) assumed the impact flux increased as the reciprocal of time, a reasonable yet somewhat inexact approximation compared to what is now known about the clearing of the PKB by Neptune's migration. This model was used by Kirchoff & Schenk (2009), Kirchoff et al. (2022), who calculated crater SFDs on ancient terrains for the satellites of Saturn and Uranus, respectively. For the former, they calculated ages by examining craters with Dcrat > 1, 2, 5, 10, and 20 km using Case A (i.e., their Table 3). If we focus on just their Dcrat > 20 km results, where craters from planetocentric debris have the least influence, their work shows surface ages as follows:
- 1.Mimas, Tethys, Dione, and Rhea are 3.3, 4.3, 4.5, and 4.5 Ga, respectively.
- 2.Miranda, Ariel, Umbriel, Titania, and Oberon have ages of 3.4 [−0.9, +1.1], 1.3 [−0.6, +2.0], 4.5 [−0.2, +0.0], 4.5 [−0.9, +0.0], and 4.5 [−0.0, +0.0] Ga, respectively.
Many of the older ages are broadly comparable to values calculated from our work (Table 1). For the younger ages, the reason for the difference could be Case A's use of a 1/time relationship to define how the impact flux changes.
A different method to derive the impact flux was employed by Di Sisto & Zanardi (2013, 2016). Using the number of encounters their model Centaurs had with Saturn over time, they calculated a time dependent impact flux that, when coupled to their estimate of the impactor SFD, yielded surface ages for Saturn's satellites. From their Table 3, for Dcrat > 20 km craters, Di Sisto & Zanardi (2016) found the following:
- 1.Mimas, Tethys, Dione, and Rhea had ages of 4.5, 4.4, 4.5, and 4.5 Ga, respectively.
These values are close to those from Kirchoff & Schenk (2009), and so they are in the same ballpark as our results as well (Table 1). Overall, we have modestly younger ages for all four of these satellites.
The most comparable model to our methodology comes from Wong et al. (2021, 2023). As discussed in Section 2.1, they calculated their impact flux based on an approximate model of how Neptune migrated through the PKB, thereby triggering a giant planet instability. They also recomputed the collision probabilities and impact velocities for heliocentric objects by direct numerical integration methods (Wong et al. 2019). Using an inferred projectile SFD, and crater scaling laws from the literature, they computed model surface ages for many major satellites of Jupiter, Saturn, and Uranus. From Table 3 in Wong et al. (2021), using two different crater scaling laws with an estimate of Dcrat > 20 km craters from various sources, they obtained the following ages:
- 1.Ganymede and Callisto of 4.28–4.37 and 4.39–4.40 Ga, respectively;
- 2.Mimas, Enceladus, Tethys, Dione, and Rhea of 3.96–4.01, 3.73–3.80, 4.06–4.12, 4.07–4.18, and 4.17–4.29 Ga, respectively;
- 3.Miranda, Ariel, Umbriel, Titania, and Oberon of 4.00–4.11, 4.03–4.21, 4.34–4.42, 4.41–4.46, and 4.43–4.48 Ga, respectively.
The largest differences between these model estimates and our ages in Table 1 are for Ganymede and Callisto, probably because of our use of a crater scaling law specifically designed for those surfaces (Section 5.6). For the Saturnian satellites, our ages are modestly older, while, for the Uranian satellites, our ages are generally comparable to one another.
The same group made several additional model updates in Wong et al. (2023), with crater isochrons calculated for the first time. Note that their model assumes that the crater SFDs found in Figure 7 for Mimas, Tethys, Dione, and Rhea represent a production population, with all of the small craters coming from heliocentric projectiles. We argue that the smaller craters are instead created by planetocentric projectiles. Their assumption, however, does not appear to meaningfully affect their surface age results, which are mainly based on the crater SFDs of larger craters. Focusing on the midsized Saturnian satellites, they compared their crater production model to craters found on these worlds from Kirchoff & Schenk (2009). The ages for their satellites, found in their Table 6, are as follows:
- 1.Mimas, Enceladus, Tethys, Dione, and Rhea have ages of 4.10, 4.08, 4.35, 4.37, and 4.42 Ga, respectively.
We find general agreement between these ages and ours provided in Table 1. There are real differences between their model and ours, so the similarity in results suggests there is some robustness in how both groups have approached the problem.
The synthesis takeaway from all these results, including our own, are that the surfaces of most giant planet satellites have ages that go back to the era when the destabilized population was relatively populous, although it declined by a factor of 100 before 4 Gyr ago. This assumes, of course, that most large craters were produced by heliocentric impactors, not planetocentric debris (Bell 2020; see Section 2.4).
While the accuracy of each age depends on the fidelity of the model used, it can be argued that the heliocentric impact flux decays so rapidly that nearly all models have no option but to calculate ancient ages for satellite surfaces (Figure 2). This result seems to be relatively independent of the model parameters used in calculating a surface age. The issue of whether it matters if Mimas is 3.3 Ga, 4.16 Ga (our value), or even 4.5 Ga strongly depends on the question asked. For example, do these ages describe when Mimas formed or the last time its surface was reset by some event, impact, or otherwise?
While we favor our crater production model and derived surface ages over those from previous works, the bottom line for every one is the same; the most ancient surfaces on the vast majority of giant planet satellites apparently go back to the earliest era of solar system history.
6. Stochastic Bombardment of the Giant Planet Satellites
6.1. What Is Stochastic Bombardment?
Up to now, we have assumed that all impacts onto the giant planet satellites track with the median (i.e., projectiles of a certain size hit at exactly the expected time according to their absolute numbers in the SFD, the impact decay curve in Figure 2, and the collision probabilities in Table 1). In reality, though, there is a stochastic component to impacts; at any given time, an object considerably bigger or much smaller than the median impactor might hit the target body (e.g., Tremaine & Dones 1993). This could affect the target body's evolution in unexpected ways.
We decided to explore this aspect of impact modeling using a Monte Carlo code. In each trial run, we use random deviates to select the 10,000 largest impacts to come from our projectile SFD. After 100 trials, we sorted the projectile sizes and created an envelope of possible impacts. An example of our results is shown for Tethys in Figure 14. The blue lines show the envelope for all impacts out of our 100 trial runs. The green dashed lines show the 10% and 90% values for the fraction of impactors out of the 100 trials that are smaller than a given size, while the red line shows the median impactor SFD. We also show the largest impactors that strike Tethys in the 100 trials using the inset histogram.
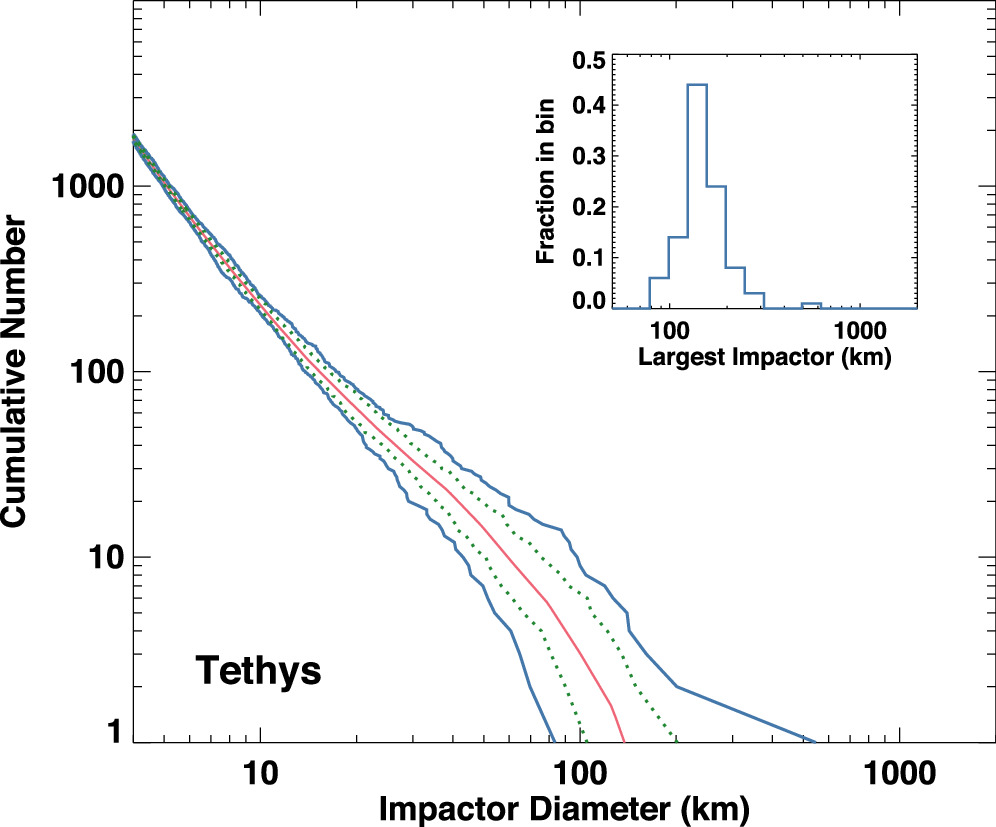
Figure 14. The range of stochastic impacts on Tethys. Using a Monte Carlo code, we ran 100 simulations where we tracked the top 10,000 projectiles striking Tethys. The blue curves represent the maximum range of impactor diameters found from these runs. The green dashed lines represent the 10% and 90% values from the ensemble, while the red curve represents the median impactor value. The inset figure shows the largest projectile to hit Tethys from each of the 100 runs. For most runs, the largest projectile to hit Tethys is modestly larger than 100 km, but on rare occasions, it can reach sizes larger than 200 km.
Download figure:
Standard image High-resolution imageWe see that the deviation from the median projectile size is most meaningful for the largest impactors, while the envelope shrinks as we move to smaller, more numerous impacts. Another interesting aspect of Figure 14 is that Tethys was struck in one trial by a projectile that was nearly 500 km in diameter. This megablast might be able to disrupt Tethys, according to the crater scaling laws in Movshovitz et al. (2016). One could imagine that comparable events on moons with subsurface oceans might lead the mixing of internal materials and substantial melting. Conversely, in another trial, the largest body to hit Tethys was only D ∼ 80 km. That size might be able to reset its crater history, but it would produce less internal mixing.
Using our model, we have created comparable plots for all the giant planet satellites. They all have similar behavior, with the top end of the envelope dependent on the shape of the impacting SFD and the collision probabilities from Table 1. Rather than show them for each satellite, we have instead created a single plot showing the largest median impact on each world, as well as the impactors from the 10% and 90% percentiles, which take the form of error bars. They are shown in the top two panels of Figure 15. In the top plot, we show the range of the largest impactor sizes hitting each world as a function of the impact velocity from Table 1, while, in the middle plot, we show the same data scaled by the mass of each world.
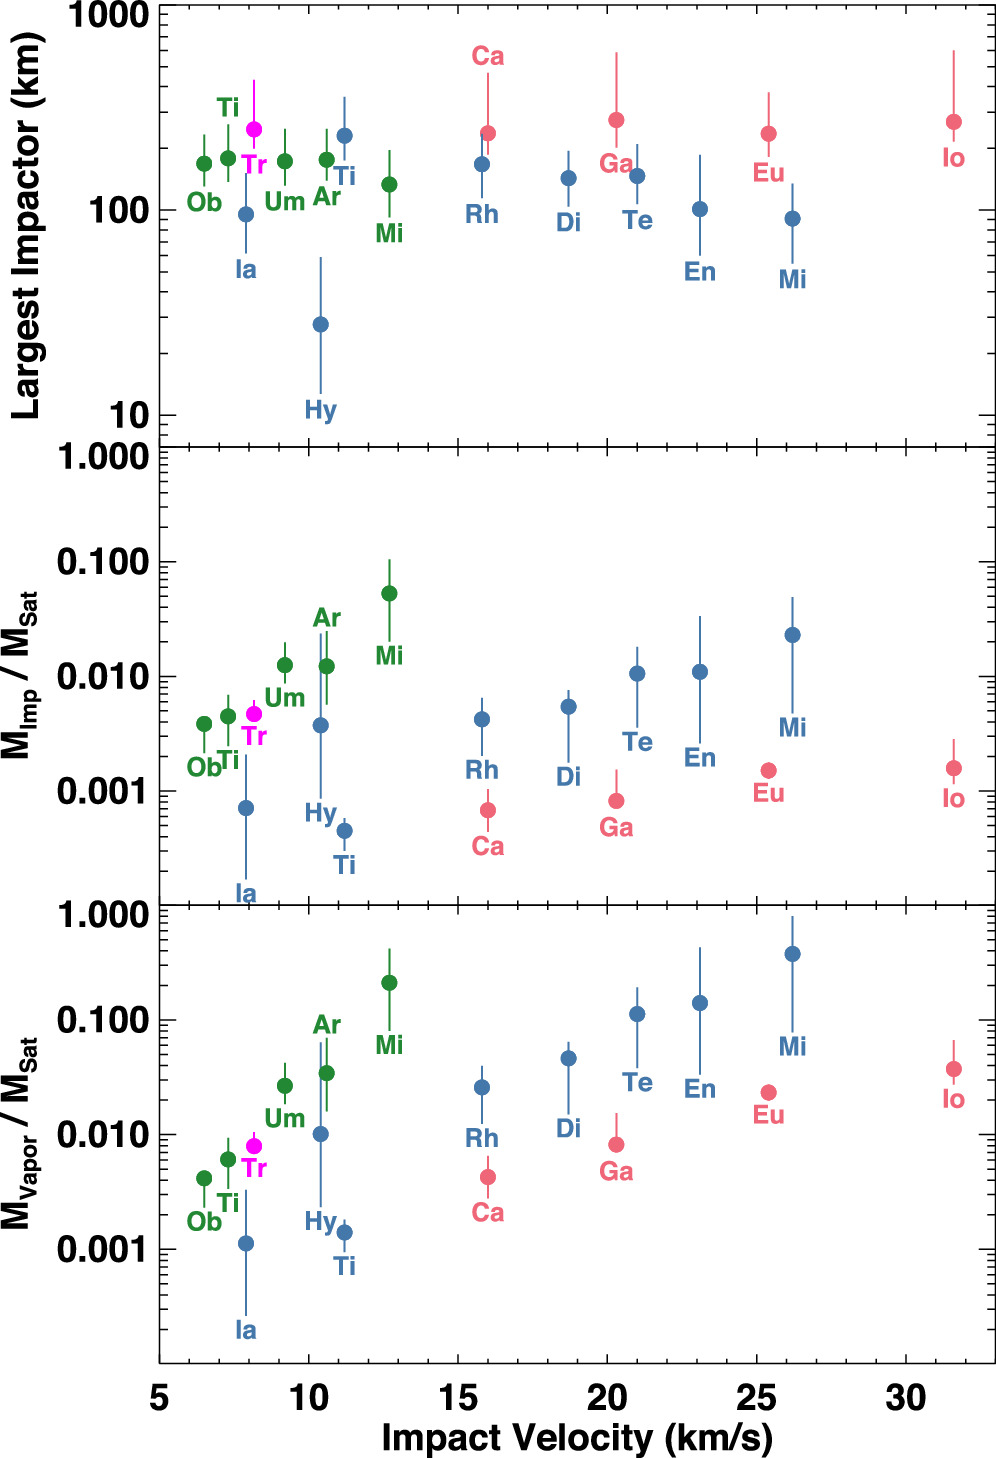
Figure 15. The largest impactors to strike the giant planet satellites since Neptune entered the PKB, based on our Monte Carlo model (see Figure 14 for details). The red, blue, green, and magenta colors are for moons in the Jupiter, Saturn, Uranus, and Neptune systems, respectively. The top plot shows the median largest impactor for each world, with the error bars corresponding to the 10% and 90% sizes from the distribution (see inset from Figure 14). The middle plot shows the median mass of the largest impactor over the mass of the satellite, with error bars again at the 10% and 90% values from our runs. The bottom plot shows the median mass of satellite material that becomes vaporized over the mass of the satellite, with error bars set to the 10% and 90% values from our runs. Mimas and Miranda show the strongest likelihood of losing substantial ice to impacts.
Download figure:
Standard image High-resolution imageAs expected, the biggest projectiles strike the worlds with the largest collision probabilities from Table 1. This means Ganymede is more likely to get hit by a large projectile than Callisto, although the nature of stochastic impacts means the reverse could also happen.
These results may give us insights into the origin of the Ganymede–Callisto dichotomy described in Section 5.6. Previous work suggested that impacts onto an initially undifferentiated Ganymede could lead to differentiation, while those affecting Callisto and Titan would leave them in a partially differentiated state (Barr & Canup 2010; Barr et al. 2010). Some differences between the bombardment models of Barr & Canup (2010) and ours are that (i) our impacting SFD is shallower for D < 100 km impactors, and (ii) some of our D > 100 km bodies are disrupted over time. As we will discuss in Section 6.2, our net flux is a factor of 5 lower in mass than predicted by Barr & Canup (2010), which in turn could lower the likelihood that either Ganymede or Callisto undergoes impact-generated differentiation.
The saving grace for the impact-generated differentiation scenario could be that Ganymede's higher collision probability increases the odds that it was hit by an anomalously large impactor. For example, as shown in Figure 15, there is a 10% probability that Ganymede was hit by a body with D > 400 km. Perhaps, such an anomalously large projectile struck Ganymede but not Callisto or Titan, thereby explaining the putative differences in their differentiation states (see also Hirata et al. 2020).
For the other worlds, the results tend to group based on satellite size. Hyperion, Mimas, Miranda, and Enceladus are hit by the largest impactors relative to their (smaller) sizes, and so they are the most likely to undergo a shattering, disruption, or vaporization event (e.g., Smith et al. 1982; Nimmo & Korycansky 2012; Movshovitz et al. 2015, 2016; Section 6.2). Conversely, the largest satellites, namely Io, Europa, Ganymede, Callisto, Titan, and Triton, get struck by the smallest impactors relative to their sizes, so disruption is unlikely.
The midsize satellites may be where stochastic effects play the biggest role. Other than Iapetus, nearly all of these bodies have a ∼10% probability to be hit by an object that is nearly ∼20% of their diameter. Given that seven satellites are found in this group, these odds are reasonably high that one of these bodies experienced an anomalously large impact. The issue is how to test this idea against what is known about the midsized satellites.
6.2. Stochastic Impacts and Ice Loss from the Giant Planet Satellites
In a provocative scenario put forward by Nimmo & Korycansky (2012), it was suggested that early impacts on the giant planet satellites might produce sufficient water vaporization to strip some of them of their ice. Their work was based on hydrodynamical impact simulations that estimated the production of water vapor by hypervelocity impacts on ice targets (Kraus et al. 2011) and the estimated bombardment flux suggested at that time by giant planet instability models (Charnoz et al. 2009; Barr & Canup 2010). For the latter, as a reference point, the net delivered mass to Callisto was assumed to be ∼3 × 10²⁰ kg (i.e., 0.03% of Callisto's mass).
When these components were put together, Nimmo & Korycansky (2012) found that early bombardment left Mimas, Enceladus, and Miranda virtually ice-free. This is not observed; for reference, the ice mass fractions of Mimas and Miranda are 82% and 77%, respectively (Hussmann et al. 2010). This led Nimmo & Korycansky (2012) to suggest several alternative explanations: (i) ice was added after early bombardment, (ii) the model impact velocities were too high and were therefore causing too much vaporization, (iii) most of the impactor mass was in the form of large bodies, and (iv) the moons were created after the early bombardment era. We would also add an additional item (v), namely that most of the vaporized materials reaccreted on the host satellite. Their favored explanation, however, was that (vi) the estimated bombardment mass was too high. They asserted that a factor of 10 reduction of mass could solve the problem (i.e., the upper bound on the mass delivered to Callisto was put at ∼3 × 10¹⁹ kg).
A related analysis that used the equatorial circumferential ridge on Iapetus as a bombardment constraint was made by Rivera-Valentin et al. (2014). They showed that the ridge should have become highly eroded if the impactor population used by Barr & Canup (2010), Nimmo & Korycansky (2012) had struck its surface. Instead, the ridge has long continuous stretches that avoid discontinuities from large craters, a triangular-shaped cross section that appears relatively intact, and steep-sloped sides that are nearly ∼40°. Rivera-Valentin et al. (2014) found that, to match the moon's crater SFD and for the ridge to survive, the accreted mass on Iapetus from the destabilized population had to be between 0.84 × 10¹⁸ and 2.4 × 10¹⁸ kg.
We put these different scenarios to the test using our updated bombardment flux model combined with the collision probabilities and impact velocities for the giant planet satellites provided by Table 1. We start with the easier of the two, namely the Iapetus ridge constraint from Rivera-Valentin et al. (2014). Using our Monte Carlo code on Iapetus and running 100 trials to determine likely variation in the results, we found that the median mass accreted was 1.7 × 10¹⁸ kg, right in the middle of the predicted range.
Using the same equations and input parameters as Nimmo & Korycansky (2012), we adopted Equation (13) of Kraus et al. (2011) to calculate the degree of water vaporization produced by impacts. Specifically, we calculated the ratio of vapor mass (Mvap) to the impactor mass (Mi ) for the impacting population. The specific energy of melting was assumed to be 8.2 × 10⁵ J kg−1, while the preimpact temperature was set to 150 K. The individual impactors were drawn from the Monte Carlo code as discussed above.
Our results are shown in the bottom panel of Figure 15. The median amount of ice lost to vaporization for each world are shown as dots, while the error bars show the outcomes where the amount of ice lost was in the bottom 10% and top 90% of all 100 trials. As a calibration check, we computed the median net mass to strike Callisto out of these 100 runs and obtained a value of 7.3 × 10¹⁹ kg. This value is only 2.4 times larger than the value suggested by Nimmo & Korycansky (2012) for their case (vi), namely the upper bound on impactor mass that would allow ice to survive on Mimas, Enceladus, and Miranda. In our situation, however, we are also using a different impactor SFD and modestly different collision probabilities and impact velocities, so they play a role as well.
We find that our median results are all below the threshold that would eliminate all ice from Mimas, Enceladus, and Miranda. The closest call comes from Mimas, but its top range does not exceed the 100% ice loss limit. Enceladus and Miranda are also below this limit, as are those of the other worlds. The bottom line is that our model passes the water vaporization test and is consistent with ample ice on the giant planet satellites.
We would also add this cautionary note to the Nimmo & Korycansky (2012) results. The Kraus et al. (2011) equations for impact-generated ice vaporization were based on numerical hydrocode simulations of cratering events taking place into a semi-infinite half-space. These results may not be well suited to approximate the fragmentation and disruption of a spherical target, nor the transfer of impact energy through the target and ejecta. One can imagine that large impacts on Mimas eject considerable mass away from the impact site. These kinds of events may prevent icy material from receiving enough energy to vaporize, with the fragments later coming back to reaccrete with the remnant target. A numerical exploration of what happens in such cases, using the Kraus et al. (2011) results as a starting point, would provide a fascinating addition to the literature.
6.3. On the Origin of Iapetus's Equatorial Ridge
These results may also give us new constraints to help us deduce the origin of the equatorial ridge on Iapetus. This singular feature extends more than 110° in longitude (Porco et al. 2005) and rises up to a height of 13 km (Giese et al. 2008). It is older than most basins, so after it formed, Iapetus could not have experienced any kind of global crater erasure event (e.g., Rivera-Valentin et al. 2014). Any model of ridge formation must also presumably account for its extremely slow 79 days spin period (Thomas 2010). Saturn is unable to tidally despin Iapetus at its current distance, so some other mechanism is needed.
One suggestion for the origin of the ridge is that Iapetus was hit early in its history by a large projectile, which created an impact-generated ring inside the Roche limit and a satellite outside this distance (Levison et al. 2011). The satellite not only helped push the ring onto the surface, creating the ridge, but also despun Iapetus. Eventually, the satellite evolved far enough from Iapetus to become unstable, but numerical simulations suggest it returned in short order to strike Iapetus, possibly explaining an observed basin or possibly why the ridge does not extend more than 110° in longitude (Levison et al. 2011).
Calculations suggest the amount of mass needed for the ring/satellite would have been the equivalent of a 260–420 km diameter body, assuming a bulk density of 1 g cm−3, or 310–500 km diameter for 0.6 g cm−3 (Levison et al. 2011). For reference, this size is similar to or larger than Hyperion (Table 1).
While no group has yet attempted to form a large satellite using numerical hydrocode impact simulations, it seems safe to say that the putative ring/ridge/satellite forming impactor was substantially larger than the resultant satellite. Using Figure 15, we find it unlikely that any such megaimpactor struck Iapetus from the PKB; 90% of the largest projectiles to hit are smaller than 200 km. Getting such an anomolously large impactor from the destabilized population would be a low probabiity event.
A hint to what may have happened comes from our Iapetus model surface age of T = 29 [+5, −3] Myr (Table 1; Figure 6). Note that, like Phoebe, Iapetus should have been hit by irregular satellites (Nesvorný et al. 2003, 2007), so we suspect its true surface age may be modestly younger than this value. Given that Neptune enters the PKB in our model at T = 20 Myr, and that the giant planet instability occurs near ∼28 Myr, this would place the timing of the ridge, the oldest structure on Iapetus, close in time to the giant planet instability. Moreover, it has been shown that encounters between Saturn and other ice giants could have pumped up the inclination of Iapetus to its current value of 8°, while keeping its eccentricity relatively low (Nesvorný et al. 2014).
We hypothesize that these encounters may have excited and destabilized other putative satellites of Saturn near Iapetus, some of which may have been larger than Hyperion, and that one of these moons hit Iapetus. Consider that the distance between Titan, Hyperion, and Iapetus is 20, 24, and 59 Saturn radii, which leaves plenty of room for additional satellites between Hyperion and Iapetus or even beyond Iapetus. Any extra destabilized satellites would have been eliminated by having them hit Titan, having them hit Iapetus before the ridge was formed, or having them be ejected from the Saturn system.
The impact of a putative Saturn satellite would explain the curious coincidence between the surface age/ridge age of Iapetus and the giant planet instability. While we can only speculate about the size of the impacting Saturn satellite, it does not seem outlandish to suggest it could have been large enough to produce both a ring/ridge and the hypothesized Iapetus satellite discussed above. An additional benefit to this scenario is that it avoids the problem of explaining why other giant planet satellites lack an Iapetus-like ridge. This issue comes up if one wants the ridge-forming impactor to come from the destabilized population.
Ultimately, additional numerical modeling work will be needed to test eitherscenario. While invoking a low probability impactor from the destabilized population is probably easier, we suspect the loss of a Saturn satellite may end up as the preferred option.
6.4. On the Projectile Sizes Needed to Resurface the Giant Planet Satellites
The ages in Table 1 describe the time intervals over which craters were retained on a given surface. Statistically, the largest craters on those terrains may have formed at any time within that interval, although earlier ages are favored if the impact rate is decreasing with time. Our analysis also shows that almost none of these ages go all the way back to when Neptune entered the PKB. The possible exception might be Phoebe, but we suspect Phoebe's age of T = 20 Myr after solar nebula dissipation was affected by irregular satellite impacts. This means each age either represents a satellite's formation time or when that terrain was resurfaced for the last time. In this section, we focus on implications for the latter.
Using our Monte Carlo model over 10,000 trials, we calculated the largest impactor to strike the satellites over the surface ages listed in Table 1. We opted to exclude those satellites where geologic processes had demonstrably influenced the ages of the oldest cratered surfaces, such as Io, Europa, Enceladus, and Ariel. Our results for the remaining satellites are plotted in Figure 16. The dots show the median largest impactor for each world, while the error bars correspond to the 10% and 90% sizes determined from the probability distribution of our results (i.e., see inset from Figure 14). The satellites have been color-coded as follows: the Trojans of Tethys and Dione are violet, the small inner satellites of Saturn are black, the large satellites of Jupiter are red, the midsized and large satellites of Saturn are blue, and the satellites of Uranus are green. For reference, the solid black line represents projectiles that are the same size as the satellite diameter, while the dashed line is ∼6% of that value.

Figure 16. The largest impactors to strike the giant planet satellites within the surface ages provided by Table 1, using our Monte Carlo model (see Figure 14 for details). The dots represent the median impactor size hitting each world, while the error bars correspond to the 10% and 90% sizes from the impactor distribution (see inset from Figure 14). The violet, black, red, blue, and green colors are for the Trojans of Tethys and Dione, the small inner satellites of Saturn, the large satellites of Jupiter, the midsized and larger satellites of Saturn, and the satellites of Uranus, respectively. The solid black line shows the largest projectiles set to the sizes of satellite diameters (SD). The dashed line, extending from the smallest to the midsized satellites, is 6% of the SD line. It reflects how larger bodies are harder to resurface and disrupt. The observed trend flattens from the midsized to the largest satellites, possibly because of a change in the resurfacing process.
Download figure:
Standard image High-resolution imageThe output data in Figure 16 provide us with insights into two issues: (i) the largest projectile to strike each satellite over its surface age, and (ii) the projectile size that erased all craters on the satellite terrain in question. For the latter issue, we define Derase as the projectile diameter capable of regionally or globally resurfacing a given satellite. At this time, Derase is unknown, but we postulate it is smaller than the projectile size needed to catastrophically disrupt the target satellite (e.g., a subcatastrophic disruption that ejects, say, 20%–50% of the target body's material away at escape velocity might be enough to globally erase all cratered terrains, particularly if most ejecta is reaccreted; see Section 6.5).
For large satellites that are nearly impossible to disrupt, resurfacing may take on other forms. For example, in Hirata et al. (2020), numerical hydrocode simulations show that the 100 and 300 km diameter projectiles striking Ganymede produce an outward flow of hot material capable of erasing icy features at large distances. Large satellites may also have subsurface oceans, which in turn may allow large-scale topography to viscously relax into undistinguished features. This kind of behavior likely explains the curious absence of very large impact structures on Ceres (Marchi et al. 2016).
Several features in Figure 16 are worth discussing in more detail. First, the dashed line shows that resurfacing follows the same trend as satellite diameter from the smallest to the midsized satellites. This characteristic is broadly consistent with the shape of the disruption scaling law for icy targets in the gravity regime, which describes how larger objects are more difficult to disrupt (e.g., Benz & Asphaug 1999; Leinhardt & Stewart 2009; Jutzi et al. 2010; Movshovitz et al. 2016; Bottke et al. 2023).
Second, the trend flattens from the midsized to the largest satellites. For Ganymede and Callisto, the values for resurfacing are nearly an order of magnitude below the trend set by the small and midsized satellites. This change in slope may indicate that resurfacing is no longer dominated by subcatastrophic disruption events, which shatter and disassemble the target, but instead are produced by impact-generated outflows of hot water/materials, as discussed above. Presumably, impact events capable of producing regional or global erasure on these large worlds have to be larger than some threshold combination of projectile size and impact velocity.
Third, Titan's surface is considerably younger than the oldest regions on like-sized worlds such as Ganymede and Callisto. We suggest several explanations for this age difference.
One possibility is that Titan was struck by a D ≥ Derase projectile late in its evolution, and it caused global resurfacing. While the size of Derase for Titan is unknown, we postulate it would be a low probability event; for reference, our Monte Carlo results suggest D ≥ 100 km impactors have a 1.7% change of hitting Titan at its estimated surface age. On the other hand, resurfacing may have been assisted by Titan's thick atmosphere, which would perhaps be heated enough to promote global melting. This effect might reduce the required size of Derase for Titan, although it has yet to be modeled.
A second possibility is that Titan was resurfaced as a byproduct of late internal evolution. For example, water liquid may be released from Titan's core when the dehydration temperature is reached, and this may happen billions of years after Titan's formation (e.g., Castillo-Rogez & Lunine 2010). While there is limited evidence for cryovolcanism that would presumably be associated with any kind of regional resurfacing event (Moore & Pappalardo 2011), this idea might be viable if the erasure was global in nature. It could also be that tidal dissipation produced late changes in Titan's interior. The issue here is that Titan's eccentricity would readily go to zero under the influence of a strong dynamical forcing mechanism.
Given these different options, we modestly favor Titan resurfacing via a large but low probability impact.
Fourth, Ganymede has a concentric pattern of tectonic troughs on its ancient dark terrains that has been interpreted to be the surviving remnant of a very large impact event (Hirata et al. 2020). The furrow system may extend between 1380 and 7800 km from its concentric center, which would make it considerably larger than the Valhalla ring system on Callisto. The impactor size needed to make such a feature is difficult to quantify, but Hirata et al. (2020) tested what would happen to Ganymede if it were hit by 100 and 300 km diameter projectiles. They showed that, for their chosen input parameters, the outward flow created by the 300 km impactor could readily resurface an entire hemisphere of Ganymede, while the 100 km impactor led to more limited erasure.
The problem, according to our Monte Carlo results, is that the probability of a D ≥ 300 km projectile striking Ganymede at its surface age (i.e., T ∼ 1 Gyr after gas disk dissipation) is 0.1%. An examination of Figure 16 suggests the projectile size needed for resurfacing on Ganymede and Callisto, D ≥ Derase, is probably the order of 100 km. We infer from this that Ganymede's furrows were probably created by a similar-sized impactor.
Fifth, the results in Figure 16 help to demonstrate why the small satellites are long-lived (Table 1). As an example, consider the median impactors to strike Telesto and Calypso, the small Trojans of Tethys. Their surface ages are nearly ∼4.5 Gyr old, but the largest bodies to hit them over that time are only ∼1–2 km, not enough to disrupt them. Instead, like most of the dots shown in Figure 16, the median projectile sizes are comparable to those needed to make the largest craters on the satellites in question.
The antiquity of the small satellites in Figure 16 is also assisted by the shallow power-law slopes of the projectile SFD for D < 1 km (Figure 1). Many craters on these small worlds come from the shallow branch (Figures 10 and 11). That means their surfaces take a long time to reach crater saturation, and they are less likely to have large craters removed via cookie cutter erasure. As we will discuss in Section 7, the ancient ages of these small moons potentially provide strong constraints on the origin of the giant planet satellites.
6.5. Satellite Disruption and the Fate of the Ejecta
The net bombardment flux on the giant planet satellites is high enough that some smaller inner satellites should have experienced multiple shattering or disruption events early in their histories (e.g., Smith et al. 1982; Movshovitz et al. 2015; see Section 2.2). The projectile size needed for such events varies as a function of target size, impact velocity, and the disruption law applicable to each world (e.g., Benz & Asphaug 1999; Leinhardt & Stewart 2012; Movshovitz et al. 2015, 2016), while the number of shattering/disruption events depends on the aforementioned quantities as well as the assumed bombardment flux.
Using our Monte Carlo code and a disruption scaling law, it is possible to make predictions about the evolutionary histories of satellites comparable to those of Charnoz et al. (2009), Movshovitz et al. (2015). The unsolved issue, however, is determining what happens to the ejecta. Most satellites are deep within the gravity wells of their parent planets, and that implies that much of the ejecta either will return to hit the target satellite or will hit some nearby satellite. Some material might also escape toward the giant planet in the form of submillimeter particles via Poynting-Roberson drag (Bottke et al. 2013). We predict that the ejecta will also undergo collisional evolution and/or reaccretion with each other prior to hitting a satellite, depending on their relative impact velocities.
Unfortunately, most of these issues have yet to be modeled, and there are no robust prescriptions in the literature describing the ejecta velocity distribution of fragments created by an icy satellite undergoing a shattering or disruption event. The closest may be the ejection velocities of spalls from large cratering events on Saturn's satellites (Alvarellos et al. 2005, 2017; see also Melosh 1984). These results suggest a limited amount of ejecta from large basin formation events can reach speeds of 1–2 km s−1. We note that higher velocities were achieved by Kegerreis et al. (2023) in a collision between a Rhea and Dione-sized moon. We discuss their results further in Section 7.3.
Given this paucity of information, we decided to apply what was known about ejection velocities from asteroid families in the main belt. An asteroid family is an observed orbital cluster of fragments created from a cratering or disruption event. They are identified by their similar proper semimajor axes, eccentricities, and inclinations. Observations and modeling work indicate the observed fragments from a family have ejection velocities comparable to the escape velocity of the parent body (e.g., Nesvorný et al. 2015).
An example of this behavior are fragments derived from the 530 km asteroid (4) Vesta located at ∼2.4 au. Kilometer-sized V-type asteroids, presumably ejected from the Rheasilvia and Veneneia basin formation events, are observed to span the inner main belt but apparently did not achieve semimajor axes larger than 2.5 au, the distance of the 3:1 MMR with Jupiter (Binzel & Xu 1993; Masiero et al. 2013). That limits their ejection velocities to values near 0.4 km s−1, with the escape velocity of Vesta being 0.36 km s−1. Vesta is comparable in size to Mimas, Enceladus, and Miranda, so it may be that disruption events for these bodies would behave in a similar fashion (though, the latter worlds have escape velocities of ∼0.2 km s−1).
With that said, there are major differences between asteroid collisions and those on the giant planet satellites. Vesta has a rocky surface, while the giant planet satellites are ice-rock. That means ice vaporization on the giant planet satellites might produce higher ejection velocities than rocky worlds. The other issue is that most observed families in the main belt formed from the collision of two bodies striking near ∼5 km s−1 (Bottke et al. 1994), while the impact velocities listed in Table 1 can be much higher than this value.
Given these limitations, we calculated what happens to ejecta if launched from the inner midsized satellites of Saturn and Uranus at 1, 2, and 3 times the target body's escape velocity (Vesc). To explore the range of possible values, we assumed each test body was hurled away at a given velocity in the planetocentric frame with a random trajectory that occurs at a random value of the target body's mean anomaly. Our results are shown in Figures 17 and 18. The dashed lines are the semimajor axis and eccentricity values needed to reach a crossing orbit with each satellite.

Figure 17. The orbits of ejecta launched from random orbital positions and trajectories from the inner Saturn satellites, Mimas (Mi), Enceladus (En), Tethys (Te), Dione (Di), and Rhea (Rh). The semimajor axes are scaled by the radius of Saturn (RSaturn). The green, red, and blue colors represent ejection velocities set to 1, 2, and 3 times the satellite's escape velocity, respectively. The dashed lines are the semimajor axis and eccentricity values needed to reach crossing orbits with each satellite. Even for the highest ejection velocities, most debris do not achieve orbits that cross that of the other satellites, and so will be reaccreted on the parent satellite within ∼102–∼103 yr.
Download figure:
Standard image High-resolution image
Figure 18. The orbits of ejecta launched from random orbital positions and trajectories from the inner Uranus satellites, Mimas (Mi), Ariel (Ar), Umbriel (Um), Titania (Ti), and Oberon (Ob). The semimajor axes are scaled by the radius of Uranus (RUranus). See Figure 17 for additional details. For this system, more modest ejection velocities allow debris to cross the orbits of other satellites, so there may be more mixing between the moons.
Download figure:
Standard image High-resolution imageWe find that the vast majority of the ejecta from the midsized satellites of Saturn and Uranus will return to be reaccreted by the remnant of the target body after a cratering or disruption event. Only a small fraction of the ejecta is thrown far enough away to reach nearby satellites, even for ∼3 Vesc. This outcome is consistent with the numerical simulation results of Alvarellos et al. (2005, 2017) for spall from a basin-forming event.
The likelihood that most satellite ejecta is reaccreted after an impact event muddies what it means for a satellite to undergo a catastrophic disruption event. Formally, disruptions are defined as collisions that send 50% of the target body's mass away at escape velocity. This metric is helpful for asteroids, whose largest ejected fragments can often still be found billions of years after a breakup event, but it is less useful for the midsized satellites, where there is little to no observational evidence that any satellite disruption events took place. This paucity of constraints means it is difficult to test disruption scaling laws in the literature (e.g., Benz & Asphaug 1999; Leinhardt & Stewart 2012; Movshovitz et al. 2016). We would simply note that, for satellites, the disruption scaling law needs to be consistent with the crater scaling law, and the threshold projectile size needed to produce a global resurfacing event.
Using the methodology of Bottke et al. (1994), we also estimated the timescale that it takes to reaccrete the ejecta. Taking the test bodies shown in Figures 17 and 18, we calculated their intrinsic collision probabilities with various target satellites and then multiplied this value by the square of the radius of the target satellite.
In general, for our ejection velocities, the mean lifetime of our test body ensemble against reaccretion was of the order of several tens of years to several thousands of years. The former values are most applicable to the innermost satellites (e.g., Mimas, Enceladus, Miranda), and they match the numerical predictions of Alvarellos et al. (2005, 2017). The largest timescales correspond to the outer satellites like Titania and Oberon when the largest ejection velocities are used (i.e., 3 Vesc).
When the large ejection velocities are used, there can be mass transfer of debris from some worlds to inner satellites (e.g., mass moving from Titania/Oberon to Miranda). While we are not advocates of such high ejection velocities, there is sufficient uncertainty on these matters that we are cautious about taking possibilities "off the table," at least for the time being (e.g., see the high ejection velocities suggested by Kegerreis et al. 2023). If high velocities are indeed possible, major collisions on large satellites could deliver a lot of mass to smaller inner satellites, possibly affecting their net mass and bulk density in a meaningful way. In such a scenario, it is plausible that the delivery of ice-rich ejecta from the exterior of the outer Uranian moons could help explain why Miranda's bulk density of 1.2 g cm−3 is modestly lower than the other Uranian moons (∼1.4–1.5 g cm−3).
6.6. Collisional Origin for the Trojans of Tethys and Dione
As discussed in Section 5.5, both Tethys and Dione have small Trojan bodies. Telesto and Calypso are coorbitals of Tethys, and reside near its L4 and L5 Lagrange points, respectively, while Helene and Polydeuces are the same for Dione, respectively. The origin of these bodies is unknown, but clues can be gleaned from the crater histories discussed above. Telesto, Calypso, and Helene have either median surface ages that go back to T = 50 to 70 Myr after solar nebula dispersal, making them older than the oldest surfaces on Tethys and Dione by ∼200 Myr (Figure 11 and Table 1), or have ages that are comparable to the oldest ages of their host planet, with ages of T = 260 to 280 Myr (see Section 5.5 for additional discussion). We note that the crater populations on these Trojans are close to or in saturation equilibrium, so their formation ages could be even older than this age range, depending on the size of body capable of disrupting them or resetting their surfaces.
Trojans are fascinating worlds because there is no dynamical pathway for planetocentric ejecta from a satellite to be launched into a stable orbit near Lagrange points L4 or L5 within the context of the three-body problem (e.g., Marzari et al. 2002). Either the Trojans had to form in situ, which is unlikely, or an extra perturbation is needed to capture them. We therefore find it intriguing that the Trojan surface ages correspond to the early bombardment era for both Tethys and Dione. Both midsized moons were struck by numerous large bodies at early times, with the median largest projectile near 150 km (Figure 4). Tethys and Dione are slightly over 1000 km in diameter, so such impacts would produce enormous amounts of ejecta, much of it remaining on crossing orbits with the largest remnants of the target worlds (Figure 17). It seems probable that this ejecta would interact with one another as they awaited reaccretion with these largest remnants, with collisions potentially damping the mutual eccentricities and inclinations of some ejecta.
Insights into what might happen to this system of debris can be found in the numerical results of Hyodo & Charnoz (2017). Using a combination of hydrocode models and N-body simulations, they tracked what happened to ejecta produced by the collision of two Rhea-sized bodies. Their results show the production of two comparable-sized bodies in different ejecta zones that eventually merge while surrounded by smaller debris. Reuniting these two bodies would be a dynamic process; we expect that multiple encounters would take place before the final collision, with the last event possibly jolting the reassembled target body into a new orbit. If any debris from the impact events were orbiting near the new Lagrange L4 and L5 zones during these events, they might easily be captured by having a dynamical net thrown over them. We argue this proposed capture mechanism is similar to the one that created Jupiter's Trojans. For the latter, during the giant planet instability, an ice giant had encounters with Jupiter while surrounded by objects from the destabilized population (Nesvorný et al. 2013). This led to the capture of KBOs that happened to be at the right place at the right time.
Inferences from the Jupiter Trojan capture work of Nesvorný et al. (2013) indicate the capture efficiency of Trojans near Tethys or Dione is probably low. To beat those odds, there needs to be an abundance of ejecta, such that a few objects happen to be orbiting near the coorbital zones by chance. This scenario would explain why Telesto, Calypso, Helene, and Polydeuces are only a few tens of kilometers or smaller. The stable Lagrange points L4 and L5 zones for Tethys and Dione are also likely to be small enough that captured objects within the same Lagrange point may eventually collide and merge into a single object (Izidoro et al. 2010).
Our hypothesized origin mechanism for these Trojans needs to be numerically modeled to determine if it is viable. Given that Tethys and Dione are hit by multiple large bodies, it is also possible that multiple generations of Trojans were captured and then lost via impact events on Tethys and Dione that jolt their orbits. This would imply that the observed Trojans come from the last impact capable of creating the Trojans. If so, the timing of that event might be constrained by the surface ages of Telesto, Calypso, and Helene, provided we understand both the planetocentic and heliocentric contributions to the projectile population.
6.7. Satellite Inclination Changes Produced by Early Bombardment
Most giant planet satellites have orbits that are slightly eccentric and/or inclined (Table 1). In the literature, it is generally assumed these values are a byproduct of tidal evolution with the giant planets, where outward migrating satellites interact with mean motion and/or secular resonances with other satellites (e.g., Burns 1986; Ćuk et al. 2020; Nakajima et al. 2020) or dynamical resonances with the internal oscillation modes of the giant planets (Fuller et al. 2016; Lainey et al. 2020). In fact, many satellites are in MMRs with each other today; for example, Io–Europa–Ganymede are in the 1:2:4 resonance; Enceladus and Dione are in a 2:1 resonance, etc. (Peale 1999). The eccentricities induced by interactions with these resonances can in turn lead to tidal damping that heats the interior of the moons. This behavior may explain past or present geologic activity on the satellites, such as volcanism on Io and water vapor plumes on Enceladus (e.g., Peale et al. 1979; Meyer & Wisdom 2007; Lainey et al. 2020).
The models making predictions of past tidal behavior for the satellites, however, must deal with several complicating issues (e.g., Neveu & Rhoden 2019). A key one is whether the tidal dissipation factor Q of a satellite remains constant or varies with time in response to dynamical tides (e.g., Fuller et al. 2016; Lainey et al. 2020). Another is the possibility that some satellites like Iapetus had their orbits modified by giant planet migration and/or encounters during the giant planet instability (e.g., Mosqueira & Estrada 2006; Deienno et al. 2011; Nesvorný et al. 2014).
Here, we propose a different possibility, namely that early bombardment has affected the eccentricities and inclinations of the moons. When a satellite is hit by a projectile, the momentum impulse should modify its orbit (Dell'Oro & Cellino 2007), as was recently seen when the DART spacecraft struck Dimorphos, the satellite of the near-Earth asteroid Didymos (Daly et al. 2023). While the giant planet satellites are very large compared to most projectiles from the destabilized population, it is still plausible that the biggest impacts push them onto modestly modified orbits. The magnitude and direction of the new orbit depend on several factors: the masses of satellite and projectile, their collision velocities and impact vectors, and the behavior of the ejecta. The latter issue can be complex, with satellite ejecta often returning for reaccretion (Figures 17 and 18).
Here, we investigate whether bombardment of the major satellites of Jupiter, Saturn, and Uranus could plausibly provide some aspects of their current orbits. In our computations, we focus on inclinations because they are more difficult to change by tidal dissipation than eccentricities (e.g., Downey et al. 2020). Our methodology is also designed to be simple; more sophisticated models can be employed later on if warranted.
Using the Monte Carlo code results described in Section 6.1, where we tabulated the top 10,000 impactors striking each moon over 100 trial runs, we sifted our results to identify the top 30 impactors from each trial. They were assumed to strike each moon in the order they were chosen from the impactor SFD, with the orbital change produced by each impactor derived by assuming the projectile and target undergo an inelastic collision (e.g., Levison et al. 2008). For reference, the biggest inclination change possible from a pole on impact is (Mimp/Mmoon) (V∞/Vorb), where Mimp and Mmoon are the masses of the impactor and moon, respectively, while V∞ is the encounter velocity, and Vorb is the moon's orbital velocity.
Given the size of some projectiles (Figures 3, 14, 15), it is expected that some impact events will shatter or disrupt the target satellite. The ejecta produced would normally invalidate our assumption of an inelastic collision. The complicating factor here is that we also know from Section 6.3 that most debris should readily reaccrete with the target moon. This means the net orbital effect on the reassembled body could approximate that obtained from the inelastic collision calculation, although it is also possible the debris hits the moon isotropically and imparts no net change in momentum. For simplicity, we have opted to assume an inelastic collision takes place but concede it may be inaccurate. To do better, we would need to track how the orbital (and rotational) angular momentum of the reassembled moon changes from impact/ejecta reaccretion using a combination of smoothed particle hydrodynamic (SPH) hydrocode/N-body codes (e.g., Hyodo & Charnoz 2017).
All satellites were assumed to start with their current semimajor axes, which allows us to use the collision probabilities and impact velocities in Table 1. We also placed the target satellites on circular orbits aligned with the Laplace plane of the host planet (i.e., they were given zero eccentricities and inclinations). As in Section 6.3, the velocity kick produced by an impactor was given a random orientation and was added to the satellite at a random value of its mean anomaly, which accounts for the possibility the satellite might have some previous eccentricity. A new semimajor axis, eccentricity, and inclination was then calculated from the modified velocity vector. Using this procedure, we dealt with each of the 30 impactors in sequence.
Additional caveats on our procedure are as follows. First, we do not account for the fact that many impactors are expected to prefer hitting near the apex of motion (Zahnle et al. 2001), which might increase the magnitude of orbital changes from bombardment. Second, we ignore the likelihood that eccentricity will decrease between impacts from tidal dissipation. Third, we did not run our model on Iapetus because its orbital parameters were plausibly affected by the giant planet instability (e.g., Nesvorný et al. 2014).
We find that the most substantial modifications to each satellite's orbit come from the impact of the largest projectiles; smaller projectiles are inconsequential. For this reason, we plot the largest projectile from each trial against the resultant net inclination from each set of impact events in Figure 19. The dashed lines represent the observed inclinations of the satellites as tabulated by Chen et al. (2014).

Figure 19. The net changes in satellite inclination produced by the largest 30 impactors to strike each moon out of 100 trials produced by our Monte Carlo code. See Figures 14 and 15 for additional details. Observed satellite inclinations are shown as dashed lines (Table 1). The biggest changes in inclination typically come from the largest impactor in each trial, so we plot the net inclination change against the size of the largest impactor. Overall, we find bombardment does not produce inclinations that violate the observed inclinations. Instead, in some cases, they could potentially explain the observed inclinations with reasonable probability (e.g., Mimas, Dione, all of the Uranian moons except Miranda).
Download figure:
Standard image High-resolution image
Not surprisingly, our results show it is difficult to move massive satellites like Europa, Ganymede, Callisto, and Titan unless you hit them with extremely large projectiles. The probability of obtaining their inclinations from bombardment are a few percent in our simulations. These are poor odds, but there are four satellites, so it is not impossible that one of them may have experienced a large stochastic impact event.
For the inner Saturnian satellites, we find a mix of possibilities. Mimas and Dione have inclinations that intersect the values of many trials, so bombardment could play an important role for these bodies, at least early on. Conversely, Enceladus has almost no current inclination, while our model suggests it should have values substantially higher than those observed. Given that collisions likely produced some early inclination, it seems probable that Enceladus has had its inclination damped by tidal dissipation. Finally, we find that obtaining the inclinations of Tethys and Rhea from bombardment alone is possible, but the odds are low.
For the major Uranian satellites, all but Miranda show inclinations in the middle of our cloud of possibilities. Accordingly, it is conceivable that Ariel, Umbriel, Titania, and Oberon had their orbits strongly affected by early bombardment. Obtaining Miranda's inclination is a relatively low probability event, but we caution that we are dealing with a body that was probably disrupted by impacts, so its resultant inclination may not be a good match with our model's assumption of inelastic collisions.
An alternative way to look at our results is that the magnitude of early bombardment predicted by our model is not violated by the inclinations of the satellites. As shown in Figure 19, our resultant inclinations occasionally reach the observed inclination, and rarely exceed it. This implies that some other mechanism is needed to explain the inclinations of many giant planet satellites.
One intriguing possibility not explored here is that the giant planet satellites were affected by close encounters between the largest objects in the destabilized population and the giant planet satellites (Deienno et al. 2011). Consider that, if 1%, 0.33%, 0.28%, and 0.33% of the destabilized population strikes Jupiter, Saturn, Uranus, and Neptune (Nesvorný et al. 2023), and the PKB once had ∼2000 Pluto-sized bodies, 99.9% that were lost during Neptune's outward migration, the giant planets should have been hit by the order of 20, 7, 6, and 7 Pluto-sized bodies, respectively. A larger number would have crossed the orbits of each satellite, potentially affecting their orbital parameters. Perhaps, these passing bodies modified the inclination of worlds like Miranda, explaining its curiously high value in Figure 19 (e.g., Deienno et al. 2011). A more thorough study of the effects of close encounters should be investigated in the future.
Ultimately, those modeling the orbital evolution of the giant planet satellites will likely need to include all potential modification mechanisms: tidal evolution/dissipation, how the satellites interact with resonances, impacts, and close encounters between satellites and large bodies in the destabilized population. The task for modelers will then be to determine which ones have played the dominant role in the orbital evolution of each satellite.
7. Discussion of Origin Models for Satellites and Rings
Over the last decade, there have been many different models proposed for the origin of the giant planet satellites. Most of the attention has been focused on the Saturn system, where the Cassini mission has provided data for a host of intriguing scenarios, including those that create the satellites and rings at the same time. Our calculated surface ages of the giant planet satellites provide constraints that can be used to test these models, provided that most larger craters come from heliocentric impactors. Here, we briefly review several origin scenarios from the literature and whether they are consistent with our results.
7.1. Satellite Formation from a Circumplanetary Disk
The classical scenario for satellite formation is that they accreted from small rock/ice particles entrained within a planetocentric disk of material fed by the solar nebula (e.g., Canup & Ward 2002, 2006; Batygin & Morbidelli 2020). Gas flowing onto the disk achieves circumplanetary orbit and spreads viscously both outward and inward onto the growing planet. The rock/ice particles grow into planetesimals large enough to become decoupled from the gas, and their accretion leads to the formation of the satellites. The satellites form quickly in this model and start to migrate toward the central body via gravitational interactions with the gas, such that some might be lost in this fashion. This process may allow tidal forces to strip off material from the exterior of a Titan-sized world, potentially explaining Saturn's ice-rich rings (Canup 2010).
Satellite and ring formation in this scenario occurs before Neptune's enters the PKB within our model (Δt0 = 20 Myr). It also seems likely that planetesimals residing within a giant planet system are relatively short-lived (see Section 6.5). We postulate that this would make most satellite surfaces clean slates shortly after the end of accretion, such that they would be capable of recording early bombardment processes. Unfortunately, our model results indicate no major satellites have surface ages that go back to the circumplanetary disk era. The oldest surfaces modeled in this paper, namely those on Hyperion, Iapetus, Phoebe, and Oberon, arguably fall short of such times (Figure 6, Table 1).
What we can say is that the formation of satellites during the circumplanetary disk era is consistent with the predictions of our bombardment model, which requires many midsized satellites to exist and be relatively close to their current orbits by the time Neptune enters the PKB. This origin model therefore serves as our baseline to consider other models.
7.2. Satellite Formation from a Massive Ring
A provocative scenario for the formation of many giant planet satellites comes from Crida & Charnoz (2012). They proposed that Saturn, Uranus, and Neptune may have had massive ring systems inside their Roche limit. From those initial conditions, the ring material viscously spreads to the Roche limit, where it can begin to spawn moonlets. In turn, the moonlets gravitationally interact with the ring, pushing it back from the Roche limit as they migrate outward. When the moonlets get far enough away, the ring can viscously spread again to the Roche limit. This process can repeat again and again, with moonlets eventually accreting into sizable satellites that evolve away from the giant planets by tidal forces.
The speed of this process at constructing the observed satellites depends on how fast tidal forces can move each satellite one away from the host giant planet. For tidal models that assume Saturn has a constant Q ∼ 104, numerical simulations indicate it takes roughly a billion years to reproduce the masses and semimajor axes of Mimas, Enceladus, and Tethys (Salmon & Canup 2017). For resonance locking models that allow the Q of Saturn to change, the timescales are more model dependent (Fuller et al. 2016; Lainey et al. 2020). Using Figure 3 from Lainey et al. (2020) as a guide, the time needed to make Mimas through Tethys or Mimas through Titan is ∼1 Gyr and 3.5 Gyr, respectively. Additional time would then be required for tidal evolution with Saturn to move the satellites to their current orbits.
Our surface age results present challenges for this satellite origin scenario. For example, this origin model predicts that the oldest moons should be the farthest away from the giant planet, while the younger ones should be closer. For the midsized Saturn satellites, this works to a degree, with Mimas, Tethys, Dione, and Rhea having ancient surface ages of T = 400 [+200, −100], 280 [+120, −70], 260 [+70, −50], and 130 [+30, −20] Myr after gas disk dispersal, respectively (Figure 7; Table 1). A potential issue is that the ages of Mimas, Tethys, Dione, and Rhea are only separated in time by, at best, the order of 100 Myr, assuming the age error bars produce an optimal spread in time. Of course, as we have shown above, these ages probably represent the time of the last surface reset event. If so, the true formation ages of the satellites could follow the correct pattern, and we would never know. The question is whether the surface ages above leave enough time for Mimas, Tethys, Dione, and Rhea to each form and tidally migrate far enough away from the massive ring that the next in sequence can start its formation.
A second issue is that Prometheus, Pandora, Epimetheus, and Janus, worlds located between the rings and Mimas, potentially have older ages than Mimas (i.e., median surface ages between T = 150 and 230 Myr after gas disk dispersal; Sections 5.5.1–5.5.2; Figure 10; Table 1). We caution, however, that if most of their craters were formed by ejecta from the last reset event on Mimas, their surfaces could be contemporaneous with Mimas (Section 5.5.4). Either way, the cratering record of these small satellites are not younger than Mimas, as would be predicted by the massive ring formation model.
This scenario also appears to have challenges for the Uranian satellites, with Miranda, Umbriel, Titania, and Oberon having ancient surface ages of T = 300 [+90, −60], 110 [+20, −10], 100 [+30, −20], and 40 [+4, −4] Myr after gas disk dissipation, respectively (Figures 6 and 9; Table 1). We remove Ariel from this sequence because it experienced resurfacing by geologic processes. We find that Umbriel and Titania have comparable sizes and ages. If they were made in the massive ring scenario, and the above ages are not surface reset ages, the two moons would have to form within tens of Myr of each other. On the other hand, one could argue that the Miranda, Ariel, and Umbriel were made by a massive ring, while Titania and Oberon were made in a circumplanetary disk. This scenario is more viable, but it arguably violates Occam's razor, with the need to explain why two different satellite formation mechanisms made similar-sized satellites next to one another.
Overall, the ancient surface ages of the satellites in the Saturn and Uranus systems imply that Crida & Charnoz (2012) scenario has to work more rapidly than suggested to date to make many of the midsized satellites. If that issue can be overcome, the next trial will be to explain the crater constraints provided by the surface ages of Prometheus, Pandora, Epimetheus, Janus, which appear to be as old or older than Mimas. It will be interesting to see if images of the small moons between Uranus's rings and Miranda from the Uranus flagship mission proposed in the latest Decadal survey will provide comparable model constraints.
For this discussion, we will assume that both conditions are met, namely that the midsized satellites formed early and migrated quickly, and that the crater constraints from small satellites can be dismissed. If so, the situation becomes more promising. Satellites that migrated large distances from tidal forces had higher collision probabilities in the past with objects from the destabilized population. These bodies would have also hit at higher impact velocities. We can crudely estimate the importance of migration by scaling the collision probabilities in Table 1 by the radius of the object squared and then transferring those values to other moons.
As a test case, we placed Dione at the current orbit of both Prometheus/Pandora and Enceladus. We find it would be hit 2 and 1.33 times as often at those distances as it is now, respectively, with impact velocities that would change from 18.7 to 29.6 and 23.1 km s−1, respectively. Inputting these values into our crater production model, the new age for Dione at those orbits would be T ∼ 700 and 390 Myr, respectively. These values are both younger than its estimated surface age of 260 Myr.
In a more realistic situation, however, Dione's collision probabilities and impact velocities would steadily change as it moved away from Saturn. Large impacts capable of resetting Dione's surface en route to its final orbit would also need to be considered. Dione's surface age would therefore depend on its migration rate from the last reset point to its current orbit. This more complicated situation provides some additional flexibility for the massive ring hypothesis, with satellites potentially being younger than they are now. The issue would be to find a model that can satisfy all observations.
7.3. Satellite Formation by a Recent Collision between Two Sizable Moons
Ćuk et al. (2016) proposed that Saturn's midsized inner satellites are surprisingly young, with formation ages on the order of 100 Myr. The basis for this provocative scenario comes from the inferred tidal migration rates of Tethys, Dione, and Rhea, which are currently moving away from Saturn. Going backward in time, Dione and Rhea would have crossed their 5:3 MMR, and Tethys and Dione would have then interacted through a secular resonance. These resonance crossings can potentially explain the inclinations of Tethys and Rhea. Further in the past, Tethys and Dione should have passed through a 3:2 MMR with each other. The 3:2 resonance crossing would have excited the inclinations of Tethys and Dione to values exceeding their observed values, so Ćuk et al. (2016) infer that the 3:2 MMR was never crossed. If one assumes the present migration rates inferred by Lainey et al. (2012) continue into the past, the 3:2 MMR crossing would have occurred during the past 100 Myr.
Ćuk et al. (2016) then deduced either that the tidal evolution rates of the satellites changed dramatically over time or that Tethys, Dione, and Rhea are as young as 100 Myr. Given that the Trojan moons of Tethys and Dione have similar inclinations to their host worlds, Ćuk et al. (2016) argued that the Trojans formed even more recently than Tethys and Dione, with their inclinations explained by their passage through the aforementioned secular resonance.
Such young ages for the inner satellites of Saturn require an alternative formation mechanism. Ćuk et al. (2016) hypothesized that the Sun's evection resonance triggered a collision between two sizable moons ∼100 Myr ago. The debris evolved into a disk of material that then accreted into new satellites, some of which later became unstable themselves and collided with one another (M. Ćuk 2024, personal communication). This cascade of destabilization, collision, and reaccretion events presumably created the inner satellites of Saturn, with their observed crater histories produced almost entirely by planetocentric debris. This putative sequence of disruption events, some at younger times, is needed to explain why certain features, like Ithaca Chasma on Tethys or the smooth plains on various satellites, have a lower spatial density of craters than the oldest terrains.
Indirect support for this hypothesis is drawn from the work of Iess et al. (2019), who calculated that Saturn's rings are only 41% ± 13% of Mimas's mass. They argue that this ice-rich mass of particles is readily darkened by meteoroid impacts. In this scenario, the fact the rings are bright today argues for a young age, while their low mass leaves little margin to hide the added dark materials (Cuzzi & Estrada 1998; Zhang et al. 2017). This led Iess et al. (2019) to postulate that the same event made both the rings and satellites 10–100 Myr ago. Similar arguments for the rings alone were made by Kempf et al. (2023), who measured the micrometeorite flux in the Saturn system with Cassini's Cosmic Dust Analyzer and argued the rings' brightness could not be older than a few hundreds of millions of years old.
To date, only a modest portion of this hypothesis has been directly modeled, with recent work focusing on the putative collision between two large satellites. Using a combination of SPH and N-body codes, Hyodo & Charnoz (2017) tracked what would happen to debris produced by a collision between a proto-Rhea and proto-Dione. They found that the material readily collided and reaccreted into a single body within ∼103 yr. Additional calculations by the same group, some analytical, indicated that a small disk of material might be created near such a large impact site, but that the disk would be unable to spread far enough to either create satellites of meaningful size or produce Saturn's rings. These results, if representative, would rule out the above scenario.
An alternative view has been proposed by Kegerreis et al. (2023). Using a different SPH code to model an impact between a proto-Rhea and proto-Dione, they found that substantial material was ejected at several kilometers per second from the impact site, with considerable mass reaching periapse distances inside Saturn's Roche limit. The collisional and dynamical fate of this material was not modeled, but the authors speculated an event of this nature could explain a recent origin for Saturn's rings and midsized moons. The reason these two comparable hydrocode simulations produce discordant results is not yet understood.
Crida et al. (2019) has disputed several aspects of the young rings and satellites scenario. For example, resonance locking mechanisms may give the moons time-varying tidal evolution rates (Fuller et al. 2016; Lainey et al. 2020). In a different example, they point out that Cassini measurements indicate that silicates and organic-rich materials are raining onto Saturn from the rings themselves (Hsu et al. 2018; Waite et al. 2018). The putative cleaning mechanisms for the rings, presumably driven by interactions with Saturn's magnetic field, may occur at a high enough rate to counteract the ring pollution by meteoroids. If true, the rings could easily have ages that go back to the circumplanetary disk era.
Concerning our own results, we find that all the inner Saturn satellites have ancient surface ages that approach the age of the solar system (Table 1). As discussed in Section 5.7, other groups have obtained comparable results for the Saturn satellites, so our results are not an outlier. The crater SFDs found on the small satellites near Saturn are also generally consistent with the shape of our crater production model, although see Section 5.5.4 for an alternative explanation. In the latter situation, the crater SFDs on the small satellites would be from planetocentric debris, possibly produced by the last surface reset event on Mimas. Even there, though, we have shown examples of crater SFDs on the younger surfaces on Enceladus that match our inferred crater production function (Section 5.3; Figure 8). This makes it more difficult to argue all of the inner satellites are young and have crater SFDs consistent with planetocentric debris.
For the recent collision/young satellite origin scenario to be considered viable, several unmodeled issues need to be tested. First, accretion models need to demonstrate that collisional debris from a large satellite collision can produce the sizes, orbits, and bulk densities of the observed satellites (Table 1).
Second, dynamical models need to show that a sequence of satellite instability/collision events can occur after the original collision event. These events are needed to explain younger surfaces with lower crater spatial densities. Presumably, the same model would also need to produce the right amount of ejecta from each impact. Alternatively, some ejecta in the aftermath of a satellite collision would need to reach barely noncrossing orbits with the new satellite (e.g., Hyodo & Charnoz 2017). This material could potentially come back to hit the resultant satellite over longer timescales.
Third, the crater SFDs formed from planetocentric debris need to be able to reproduce the crater SFDs found in Figures 7–11. This means the impactor populations must reproduce (i) the common shape of the crater SFD for Dcrat > 20 km craters found on the midsized satellites and (ii) the different crater SFDs found on the midsized satellites for Dcrat < 20 km (i.e., several terrains on satellites like Enceladus and Miranda have shapes that match our crater production function, while many others on a myriad of midsized satellites do not). Our expectation is that these putative planetocentric populations would also require some degree of collisional evolution to explain observations.
While it is possible a solution will be found for each of these components, Occam's razor would appear to favor a simpler solution, namely that a heliocentric impactor population from the destabilized population struck ancient giant planet satellites over the last 4.5 Gyr. Any differences between our crater production model and the observed crater SFD at smaller crater sizes are likely explained by craters produced by planetocentric debris, possibly from the last impact event capable of resurfacing each satellite. We concede that the latter issue also needs to be tested, but it follows naturally from our work.
Note that the age of Saturn's rings is not directly constrained by our work. Models of their origin, however, should arguably be consistent with the prediction that the inner Saturnian satellites have ancient surfaces, or they must face the issues discussed above. We further address the young ring issue in the next section.
7.4. Saturn Ring Formation by Satellite Disruption
We close this section by discussing two recent models proposing to explain why Saturn's rings could be relatively young. The first is Dubinski (2019), who considers whether the collision between a large comet and a proto-Mimas located on the edge of the Roche limit would allow ice-rich material to enter Saturn's Roche limit, thereby creating rings via viscous spreading and collisional damping. This model is a variant of the suggestion that a moon within Saturn's Roche limit disrupted long ago from an impact event to form the rings (e.g., Harris 1984).
To get recent rings, however, the Dubinski (2019) model is contingent on several conditions. First, given that there is roughly half a Mimas mass in Saturn's rings, Mimas had to be larger than its current mass prior to impact. Second, Mimas had to reside close to Saturn's Roche limit at impact, which would allow ejecta to easily reach the Roche limit. Keeping proto-Mimas in that location is difficult because Saturn's tidal forces want to push it outward. The proposed solution by Dubinski (2019) is to keep proto-Mimas trapped in an MMR with Enceladus and Dione. Third, Mimas would have to be differentiated enough that the ejecta would be dominated by ice-rich material. Fourth, Mimas had to be hit by a D > 20 km comet over recent times, which Dubinski (2019) estimated had a ∼1% chance of taking place.
A problem with the disruption of a proto-Mimas near the rings over recent times is that there is insufficient time to create Mimas's observed crater history from heliocentric impactors (Figure 7; Table 1). Mimas's craters would have to come almost entirely from its own ejecta, which in turn would need to have some SFD with a shape capable of reproducing that of the observed craters on Mimas. Mimas's outward migration would also take it past the orbits of Prometheus, Pandora, Janus, and Epimetheus. They could not survive this passage, so the only alternative would be to (i) make these satellites sequentially from the rings via the Crida & Charnoz (2012) mechanism, (ii) move them to their current orbits via a combination of gravitational interactions with the rings and tidal forces, and (iii) explain their crater SFDs by invoking an additional impacting population, such as very long-lived Mimas debris. This sequence of events needs to be modeled, but at face value seems unlikely to us.
An alternative young rings formation model was proposed by Wisdom et al. (2022). In their scenario, a hypothetical Rhea-sized moon called Chrysalis in the Saturn system was originally located between the orbits of Titan and Iapetus. Chrysalis became unstable when it crossed a resonance with Titan. Gravitational interactions between Chrysalis, Titan, Saturn, and Neptune went on to produce Saturn's obliquity of 267 and Titan's current eccentricity. Numerical simulations indicate these same interactions may have caused Chrysalis to pass within the Roche limit of Saturn, where tidal disruption would have stripped the body of ice-rich material. Most of this material would have eventually accreted with Saturn, but according to their calculations, 1% of it staying behind would have been enough to make young rings. Given Titan's current tidal migration rate (Lainey et al. 2020), Wisdom et al. (2022) predicted this event occurred 100 to 200 Myr ago.
As in the Dubinski (2019) scenario, this hypothesis has several obstacles to overcome. First, none of the midsized moons is pure enough ice to explain the composition of the rings, which presents a challenge to the putative composition of Chrysalis. Second, Chrysalis would have undergone tidal disruption while on an eccentric orbit that crossed the paths of Saturn's small inner satellites and several midsized moons. This would lead to an eccentric ring of debris that would presumably circularize itself by collisions. In the interim, the newly formed ejecta ring would thoroughly bombard any moon that happened to be on a crossing orbit. We find no obvious evidence from the crater histories of Prometheus, Pandora, Janus, Epimetheus, Mimas, Enceladus, Tethys, Calypso, Telesto, Dione, Helene, or Rhea that such an event took place over recent times. It also seems likely that Chrysalis and/or its disrupted remnants would gravitationally perturb some satellites prior to being eliminated from the Saturn system (e.g., Deienno et al. 2011). Numerical simulations are needed to determine whether this scenario is consistent with the observed orbital parameters of the satellites (Table 1).
We end this section by noting that both mechanisms would have an easier time matching crater constraints if they were pushed back to early times in solar system history. The high bombardment flux in that era would then provide each model with more options for dealing with constraints. On the other hand, there are many additional mechanisms to explain how Saturn's rings might have formed at the dawn of the Saturn system (e.g., Canup 2010) and fewer constraints to test which scenario might be correct.
8. Conclusions
We have used a model of outer solar system bombardment to calculate the oldest surface ages for the giant planet satellites. Our results build on a recent model of the collisional and dynamical evolution of the PKB (Bottke et al. 2023). They found that their best fit to constraints occurred when Neptune entered the PKB ∼ 20 Myr after the dissipation of the solar nebula. Neptune migrated across the PKB, pushing the vast majority of its population onto giant planet-crossing orbits. This so-called destabilized population initiated a giant planet instability, with encounters between giant planets and small bodies causing the giant planets to move to their current orbits. It also served as the primary source of satellite bombardment for the subsequent 4.5 Gyr, with the impact rate fading by orders of magnitude over this time.
A collisional cascade in the PKB and destabilized population produced a wavy SFD, with larger objects disrupting and creating fragments (Bottke et al. 2023). Objects smaller than 20 m grind themselves into a Dohnanyi SFD with a cumulative power-law slope of q ∼ −2.7. This steep SFD disrupts D > 20 m objects and leads to q ∼ −1 for 30 m < D < 1 km. In turn, this shallow branch of the SFD means fewer projectiles exist to disrupt D > 1 km bodies, making a bump near D ∼ 1 km. This shape continues to evolve over time, with collisions both steepening the slope between a few km < D < 10 km and advancing an inflection point in the slopes from D ∼ 1 km to D ∼ 2 km (Figure 1).
Using calculated collision probabilities and impact velocities between the giant planet satellites and the destabilized population from Nesvorný et al. (2023; Section 3.2), and crater scaling laws calibrated against the crater SFDs found on (1) Ceres (Section 3.3; see also Figure 3), we created a crater production model that can be used to estimate the surface ages on the small and midsized satellites. We also determined the net bombardment experienced by these worlds from the destabilized population (Section 4).
We found that most giant planet satellites were hit early on by very large projectiles. The lack of geological evidence for such events may indicate that large impactors produce global resurfacing via disruption, shattering, and/or the melting of surface ice. Accordingly, the giant planet satellites do not have terrains that go all the way back to their formative eras. A consequence is that any putative craters derived from the leftovers of accretion in the giant planet zone or from early satellite formation have been eliminated. Unfortunately, the giant planet satellites have few bombardment constraints left that can tell us what happened at primordial times (assuming, of course, that they existed prior to the giant planet instability).
Very large impacts from the destabilized population should mix surface and interior materials in ways that need further investigation. Evidence for this massive bombardment era might only be possible now via high-resolution gravity measurements taken from spacecraft.
The moons with the most ancient surfaces, Hyperion, Iapetus, Phoebe, and Oberon, are those that reside farthest from Saturn and Uranus (Section 5.1). Each one has an age within ∼20 Myr of the start of bombardment at T = 20 Myr, with T defined as the time after solar nebula dispersal. In that time, however, the impact flux decreases by a factor of several, enough to suggest even these ancient worlds are missing their earliest histories.
The inner midsized moons of Saturn (i.e., Mimas, Enceladus, Tethys, Dione, and Rhea) and Uranus (i.e., Miranda, Ariel, Umbriel, and Titania) have lost even more of their past, with their oldest surface ages being several tens to several hundreds of Myr younger than the start of bombardment (Sections 5.2 and 5.4).
Both Enceladus and Miranda have crater SFDs on some terrains that fit our crater production model for 1 < Dcrat < several tens of kilometers (Figures 8 and 9). Many others, however, have crater SFDs with an excess number of Dcrat < 20 km craters compared to our model predictions (e.g., Mimas, portions of Enceladus, Tethys, Dione, Ariel). We suspect these crater SFDs were produced by planetocentic impactors, with a likely source being the last impact on each world capable of producing a global resurfacing event (Section 5.3.1).
Many small Saturn satellites have crater SFDs amenable to investigation using our crater production model (Section 5.5). Some orbit between Saturn's rings and Mimas, namely Prometheus, Pandora, Epimetheus, and Janus. Other are Trojans of Tethys (Telesto, Calypso) and Dione (Helene). We find their nominal surface ages are older than the most ancient surfaces on Mimas, Tethys, and Dione (Sections 5.5.1–5.5.3). It is possible, however, that the majority of craters on these worlds were created by planetocentric debris produced by the last resurfacing event on a nearby midsized satellite (Section 5.5.4). If so, their ages should be comparable to the oldest ages on their host world.
Either way, we infer that these worlds were created and/or resurfaced during the heaviest phase of early bombardment. That timing is suggestive of a relationship. We postulate that Telesto, Calypso, and Helene originated as debris produced by large shattering events on Tethys and Dione (see also Section 6.6).
Our analysis of the shapes of the crater SFDs found on the largest satellite Ganymede leads us to favor a different crater scaling law for Europa, Ganymede, Callisto, and Titan (Section 5.6.2; Figure 3). Using it, we find the oldest surfaces on these worlds have median surface ages that are 180, 3360, 4080, and 1800 Myr older than the present day, respectively. That result implies that these worlds undergo global resurfacing events more readily than would be expected from trends deduced from the surface ages of the small and midsized satellites (Figure 16, Section 6.4).
We also looked into how the giant planet satellites were affected by stochastic bombardment, namely what happens when the largest projectiles striking a world have substantial variability from the expected median impactor. Given the missing early history identified for each world, the effects of such projectiles are difficult to deduce from existing data. Nevertheless, we were able to make several inferences. First, our production model does not produce severe enough bombardment to eliminate all ice from smaller worlds like Mimas, Enceladus, and Miranda (Sections 6.1–6.2). Second, very large impacts may shatter or disrupt the midsized satellites at Saturn or Uranus, but the ejecta is readily reaccreted unless ejection velocities are considerably larger than 3 times the escape velocity of the target satellite (Section 6.5). Early bombardment may also be responsible for some of the inclinations of the midsized satellites, with our model results reasonably consistent with many Uranian satellites (Section 6.7).
Most of the moons of Saturn and Uranus have surface ages within a few hundreds of Myr of solar nebula dispersal (Table 1). The small satellites of Saturn between its rings and Dione have ages older than or comparable to those on Mimas, Tethys, and Dione. Taken at face value, these results present challenges for satellite origin models where the moons were made in the last few hundreds of millions of years (Sections 7.3–7.4). Alternative origin models where those moons were made in succession from a massive ring can only reproduce our ancient model surface ages if (i) such simulations can make the moons over a few hundreds of Myr after the dissipation of the solar nebula, and (ii) they can explain the antiquity of the small inner satellites of Saturn, which presumably should be younger than Mimas (Section 7.3). At least so far, the satellite origin models that can most easily explain observations are those that assume the midsized and larger satellites formed from a planetocentric disk of gas and dust fed by the solar nebula (Section 7.1).
Acknowledgments
We thank Paul Schenk, Peter Thomas, Joshua Hedgepeth, and Catherine Neish for giving us access to their crater databases, which was essential for this project. We also thank Alyssa Rhoden and Sierra Ferguson for many useful conversations on the nature of Saturn's satellites and their crater records. Finally, we thank our reviewers, Romina P. Di Sisto and an anonymous referee, who provided many useful and constructive comments that improved our paper. The work in this paper was supported by NASA's Solar System Workings program through grant 80NSSC18K0186 and NASA's Lucy mission through contract NNM16AA08C. The work of David Vokrouhlický was partially funded by grant 21-11058S from the Czech Science Foundation.