


Abstract
Radar images of Venus's tallest mountain range, Maxwell Montes, show a sharp increase in radar reflectivity, a "snow line," at high elevation. This snow line has been inferred to represent a single common elevation (and thus temperature and pressure) above which metallic or semimetal compounds are present on the surface, either as direct precipitates from the atmosphere or from atmosphere–rock chemical reactions. Here, we show that Maxwell's snow line is not at a constant elevation—it is ∼3.5 km higher in the NW than the SE. The best explanation is that atmospheric composition is not constant across Maxwell. The higher snow line elevation to the NW can be interpreted as a snow shadow, produced as winds from the SE cross Maxwell and becomes progressively depleted in its snow-producing component.
Export citation and abstract BibTeX RIS

Original content from this work may be used under the terms of the Creative Commons Attribution 4.0 licence. Any further distribution of this work must maintain attribution to the author(s) and the title of the work, journal citation and DOI.
1. Introduction
Among Venus's most distinctive features are its highest mountain range, Maxwell Montes, and its unusual radar properties. The upper elevations of Maxwell have higher radar backscatter than elsewhere on Venus, which is evident in mosaics of synthetic aperture radar (SAR) returns from the Magellan spacecraft (Figure 1), in radar images from the earlier Pioneer Venus spacecraft, and from Earth-based observations (Campbell et al. 1976; Masursky et al. 1980b; Campbell & Burns 1980; Pettengill et al. 1982). This high radar backscatter also appears in Magellan maps of radar Fresnel reflectivity, and is represented as distinctively low values in Magellan radar emissivity (Klose et al. 1992).
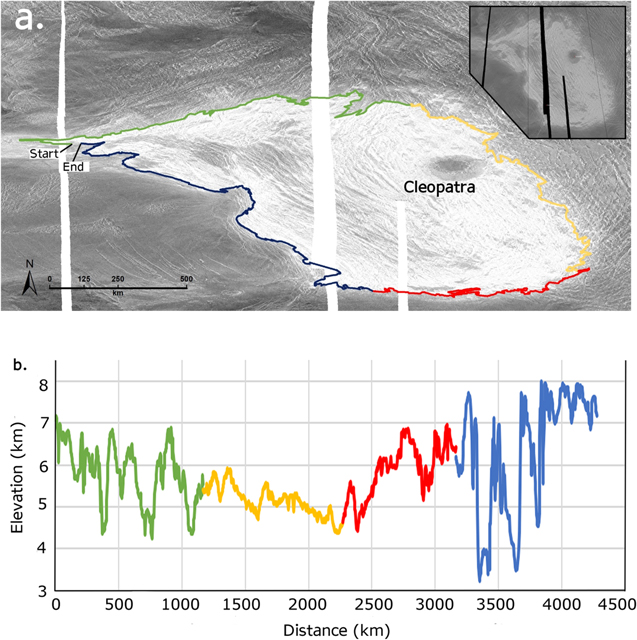
Figure 1. (a) Left-look SAR mosaic of Maxwell Montes, in Mercator projection (61–71.4°N; 351–13°E); the center of the image is at 66.2°N, 2.0°E, and the center of Cleopatra crater is at 65.90°N, 6.94°E. The snow line was drawn manually at the strong contrast in SAR backscatter; segments of the snow line colored for clarity. Inset shows equal area projection, centered on Maxwell Montes. (b) Profile graph of the snow line elevation on Maxwell Montes vs. distance along the snow line, clockwise from its NW corner. Each colored segment corresponds to the color outline in Figure 1(a). Distance is somewhat arbitrary, being dependent on the number of points chosen and the spacing between them (Kappraff 1986). The lowest snow line elevation, ∼4.5 km above the datum, is near the SE corner of Maxwell Montes, and the highest snow line elevation, near 8 km, is near the NW corner of Maxwell Montes. The extreme variations in snow line elevation on the west flank of Maxwell (blue line) are interpreted to represent elevation errors related to its steep and rough topography.
Download figure:
Standard image High-resolution imageThe origin of Maxwell's high radar backscatter (high reflectivity and low emissivity) has been controversial and contentious. The earliest explanations invoked an active process, a surface coating of an atmospheric precipitate with a high dielectric constant, like metallic tellurium (Pettengill et al. 1996). Other potential precipitates include semiconductor chalcogenide compounds (Schaefer & Fegley 2004; Port & Chevrier 2020; Port et al. 2020; Port & Chevrier 2021) and ferroelectric substances (Shepard et al. 1994; Pettengill et al. 1996). Ferroelectrics seem unlikely, as the backscatter-elevation profiles on Maxwell are not consistent with the signatures of ferroelectrics elsewhere on Venus (Arvidson et al. 1994; Treiman et al. 2016; Gilmore et al. 2017; Brossier & Gilmore 2021). Many of the suggested atmospheric precipitate compounds include geochemically uncommon elements (e.g., Te, Bi, Sn, As, Sb); they could have been concentrated on Maxwell Montes by volatilization from hot rock at low elevations, and precipitation onto the cooler surfaces at high elevations (Brackett et al. 1995).
On the other hand, Maxwell's high radar backscatter has also been ascribed to chemical reactions between rock and atmosphere that produce metallic or semimetal compounds (Ford & Pettengill 1983; Pettengill et al. 1996; Wood 1997). The most commonly invoked and geochemically reasonable reaction products are the iron sulfides pyrite and pyrrhotite, FeS2 and Fe1-xS (Klose et al. 1992; Port & Chevrier 2020), because iron is abundant in Venus rocks (Treiman 2007) and sulfur gases (including reduced species like S2) are abundant in its atmosphere. However, there is significant disagreement about whether pyrite could actually be stable at Venus's surface, depending primarily on the inferred oxidation state at the surface (Zolotov 2018). Some models suggest that pyrite is stable at high elevations (Klose et al. 1992; Wood 1997; Semprich et al. 2020), while others do not (Fegley et al. 1995, 1997, 1997; Zolotov 2018). As noted by Zolotov (2018), this dichotomy can only be resolved by direct measurements of the Venus atmosphere at low elevations, as will be taken by the DAVINCI spacecraft probe (Garvin et al. 2022).
All these models implicitly assume a "one-dimensional" Venus: that temperature and atmosphere composition across the planet vary only with elevation (Seiff et al. 1985; Johnson & de Oliveira 2019), and likewise that the elevation of Maxwell's snow line is at a constant elevation (i.e., an isohype). Here, we test the assumption that the elevation of Maxwell's snow line is constant (Carter et al. 2006), and find that it is not. Ignoring local effects of steep and rough topography, the snow line is ∼3.5 km higher at Maxwell's NW than at its SE.
2. Data and Methods
Data used here are from the Magellan spacecraft mission, which returned data from orbit from 1990 to 1994. Magellan had two radar instruments that operated at 2.4 Gigaherz (12 centimeter wavelength): a horn that returned altimetry, Fresnel reflectivity, and roughness data (footprints of ∼24 × 11 km at the latitude of Maxwell (Plaut 1993)) and a dish that returned synthetic aperture radar backscatter (∼75 m spatial resolution) and emissivity (∼40 km spatial resolution (Plaut 1993)). Note that emissivity values are sensitive to the surface's radar properties (i.e., permittivity) and relatively insensitive to surface roughness and orientation (Plaut 1993). On the other hand, SAR and Fresnel reflectivity are sensitive to both material properties and the roughness and slope orientation of their target footprint.
Map backgrounds and radar backscatter values used here are from left-look mosaics of synthetic aperture radar (SAR) returns, taken from the F-MIDR global mosaic. Elevations and Fresnel reflectivity values are from the global topography data record (GTDR) and global reflectivity data record (GREDR), and radar emissivity data are from the Magellan global emissivity data record (GEDR). These data for the study area were accessed through the USGS Map-a-Planet web interface (http://astrogeology.usgs.gov/search) and the JMARS web interface (https://jmars.asu.edu), and downloaded for local use.
Once in hand, Magellan radar data were imported into ArcGIS/ArcMAP, where they were mapped and analyzed. Other standard computer codes were used to produce the graphs and texts.
3. Results
3.1. Snow Line Elevation—SAR
Our main result is the inconstancy of the GTDR elevations at which radar properties on Maxwell Montes change, i.e., its snow line (Figures 1, S1). The location of the snow line was mapped manually onto the SAR FMIDR mosaic, following the sharp contrast in SAR reflectivity (Figure 1). The snow line is approximately at a Magellan SAR reflectivity of 0.35, consistent with its appearance at an emissivity of ∼0.6 (Klose et al. 1992) and Fresnel reflectivity of ∼0.35 (Appendix A). The elevation of the snow line varies by ∼3.5 km, with lowest elevations to the SE and highest elevations to the NW, with some significant short-range variations on the west flank of Maxwell. This result can be separated into a systematic, SE to NW long-range variation (thousands of km), and localized short-range variations (< hundreds of km). The short-range variations could have several causes, including errors in altimetry in the GTDR over rapidly changing topography (Campbell et al. 1999; Campbell & Whitten 2022), misregistration of measurement of altimetry compared with SAR and emissivity measurements (see (Plaut 1993) but not a factor for Fresnel reflectivity), and local variations in rock type (Basilevsky & Head 1995). The first, errors in the GTDR altimetry, could be responsible for the wild swings in apparent snow line elevation on the west side of Maxwell, where the slopes are steepest and elevation changes greatest. The last, variation in rock types, could be the cause of the smaller but more regular variations along the south, east, and north sides of Maxwell—this idea cannot be tested with current data, but may be testable with data from upcoming spacecraft missions (Ghail et al. 2017; Smrekar et al. 2022).
Some support for a systematic variation in snow line elevation comes from Carter et al. (2006), who reported Earth-based (Arecibo) interferometric altimetry for Maxwell and compared it with the snow line location. Their Figure 2, derived interferometric fringes of elevation, appears to show that the snow line on Maxwell's NW is at a higher elevation than on its SE. However, elevation differences were not quantified, and their work has not been brought to publication in a peer-reviewed publication.
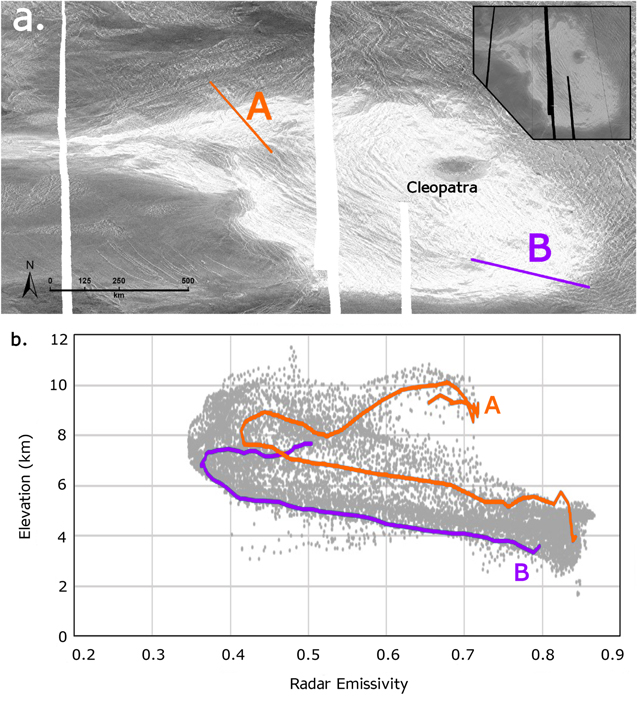
Figure 2. (a). Locations of emissivity profiles on left-look SAR image of Maxwell Montes, Mercator projection (61–71.4°N; 351–13°E); the center of the image is at 66.2°N, 2.0°E, and the center of Cleopatra crater is at 65.90°N, 6.94°E. Inset shows equal area projection, centered on Maxwell Montes. Profiles A (orange) and B (purple) to compare emissivity vs. elevation. (b) Profile graphs of elevation vs. emissivity overlain on a recreation of Figure 2(a) of Klose et al. (1992), their data shown as gray dots. Traverses A and B show that emissivity is systematically lower at Maxwell's SE than its NW.
Download figure:
Standard image High-resolution image3.2. Emissivity Variations
The unusual radar properties of Maxwell Montes were first analyzed using Magellan radar emissivity data (Klose et al. 1992), which is relatively insensitive to surface slope and roughness (Plaut 1993). Klose et al. (1992) found that emissivity across Maxwell Montes decreased sharply above ∼4–6 km elevation (Figure 2(b)), and then increased again at elevations above ∼9 km. Of specific interest for this study is that Figure 2(a) of Klose et al. (1992) shows the emissivity changes across Maxwell are not at a single specific elevation but rather a range of elevations.
To explore the elevation range of emissivity variations shown in Klose et al. (1992), and to compare emissivity with SAR backscatter (Figure 1), we examined Magellan emissivity along traverses on SE and NW Maxwell, Figure 2(a). Those results (Figure 2(b)) show that radar emissivities vary with location on Maxwell, similarly to the variation in SAR snow line elevation (Figure 1). The traverse across SE Maxwell shows a transition from high to low emissivity at ∼4.5 km elevation (Figure 2(b)), which is comparable to the elevation of the SAR snow line in that area (Figure 1(b)). The traverse in NW Maxwell shows a transition from high to low emissivity at ∼6.5 km elevation, which is similarly consistent with the SAR snow line in that area. From these traverses, we infer that radar emissivity and SAR backscatter exhibit similar (albeit inverted) variation around Maxwell, and that the elevation ranges that Klose et al. (1992) and others report (Treiman et al. 2016; Brossier & Gilmore 2021)for transitions in emissivity actually represent SE-NW variation in the snow line location.
3.3. Radar Properties and Topography
To gain additional insight into the variations in radar properties of Maxwell, we examined two east–west transects, nearly perpendicular to the regional trend of snow line elevation variation (Figure 3). These transects cross the highest elevations and steepest scarps on Maxwell.
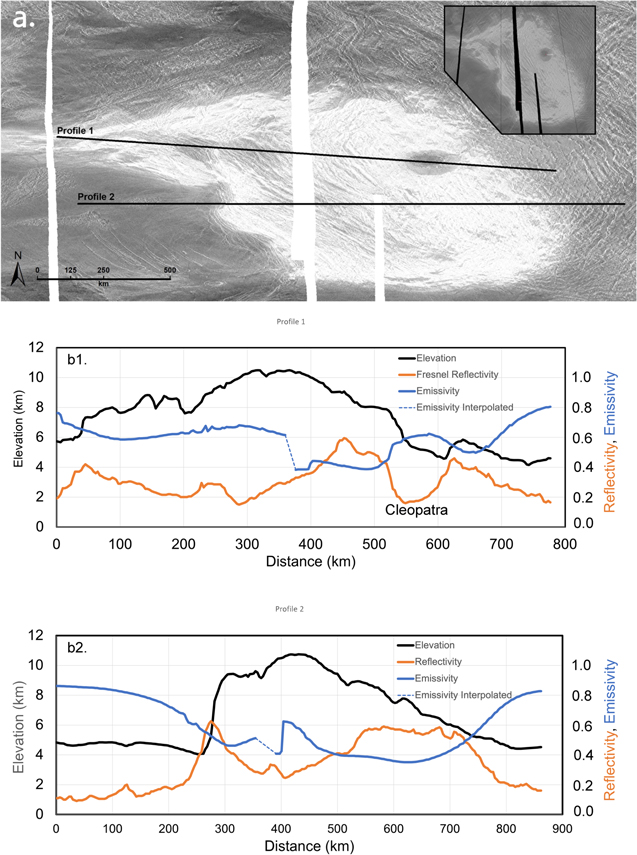
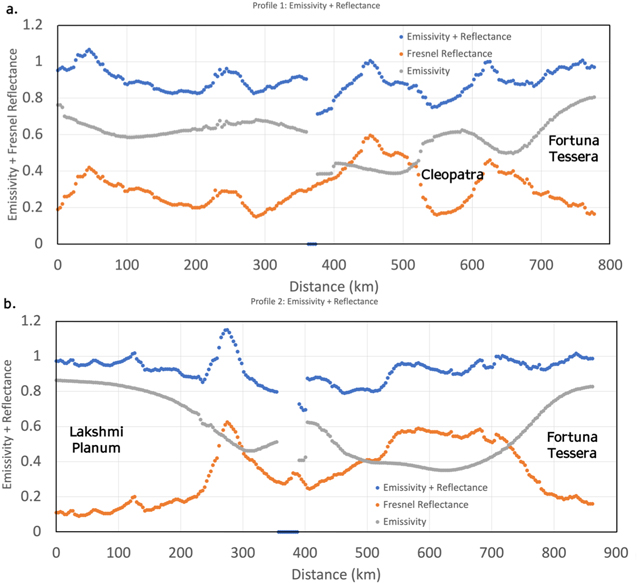
Figure 3. (a). Locations of emissivity-reflectivity profile lines 1 and 2. b. Radar emissivity, Fresnel reflectivity, and elevation vs. distance along the profile lines. Data for the profiles was obtained from the JMARS web interface, and is at lower spatial resolution than the original data. Emissivity and Fresnel reflectivity are from JMARS (both ranging from 0.0 to 1.0) are multiplied by 10 to show them on the same scale as the topography (in km). The western gap in SAR radar data (Figure 3(a), left white stripe) is also a gap in the emissivity data, and is filled by interpolation (dashed lines). The eastern gap in SAR radar data (Figure 3(a), right white stripe) is not a gap in emissivity data; its coverage is continuous.
Download figure:
Standard image High-resolution imageFirst, we note that radar emissivity and Fresnel reflectivity are generally anticorrelated, Figure 3, as expected (Plaut 1993), although radar reflectivities include contributions from surface roughness and orientation. This anticorrelation is seen best in the data here for the Lakshmi Planum plains at the west (low elevation) portion of profile 2, and for the Fortuna Tessera highlands at the east ends of both profiles. In both these areas, emissivity and reflectivity vary smoothly, are clearly anticorrelated, and their sum is approximately unity (see Appendix B). The most prominent exceptions to the expected anticorrelation are on the profiles at the steepest scarp on the western edge of Maxwell (Figure 3(b1), ∼50 km; Figure 3(b2), ∼275 km). These cases likely represent specular reflections from the scarp surfaces rather than a difference in material properties. Another exception is on profile 1 at ∼250 km (Figure 3(b1)), where an increase in reflectivity is not mirrored in the emissivity. This might represent misregistration of the footprints of emissivity and reflectivity measurements (which were of different dimensions, acquired by different instruments on different orbits). That portion of profile 1 skirts an area of higher reflectivity, and one could easily imagine that the larger emissivity footprint includes some of that area.
Emissivity and reflectivity are poorly anticorrelated across the Cleopatra impact crater and its ejecta (Figure 3(b1), ∼525–625 km). In that area, Fresnel reflectivity is low, as is SAR backscatter (Figure 3(a)); emissivity increases, but only about half as much as reflectivity decreases; therefore, the sum of emissivity and reflectivity is only around 0.8, significantly below the expected sum of 0.90–0.95 (see Appendix B). The source of the discrepancy on Cleopatra is currently not well understood, and data to be acquired by future missions could help explain the discrepancy (Ghail et al. 2017; Smrekar et al. 2022).
In our Figure 3(b1), the floor of Cleopatra crater appears tilted down to the east at ∼1/70 km, or just under 1°. However, this slope is not apparent in the stereo DEM, in which the floors of Cleopatra's innermost basin and the ring between its rim and peak ring are essentially flat; see Figure 13 of Herrick & Rumpf (2011), The apparent slope of Cleopatra's floor in Figure 3(b1) is likely also an artifact, likely related to a low altimeter reading at the WNW edge of Cleopatra.
4. Discussion
The observed regional variation in snow line elevation, low to the SE and high to the NW, could have several causes. We separate the various hypotheses into those that primarily involve surface materials, and those that primarily involve atmospheric influences.
4.1. Solid Surface
First, it is possible that the snow line is at a constant elevation, and that the Magellan GTDR altimetry is systematically erroneous. Magellan altimetry in the GTDR includes anomalous values in locally steep terrain (Campbell et al. 1999), such as the flanks of Maxwell. For Maxwell, altimetry data from Pioneer Venus are consistent with those of Magellan (Pettengill et al. 1979; Masursky et al. 1980a), which would support the observed ∼3.5 km difference between the SE and NW snow line elevation. Earth-based (Arecibo) interferometric altimetry for Maxwell may also show that the snow line is at higher elevation to Maxwell's NW (Carter et al. (2006), but that result is only presented in an unreviewed abstract. We provisionally accept that the GTDR altimetry is essentially correct.
Another possibility is that the snow line represents an isotherm, which is at a higher elevation on the NW side of Maxwell than the SE. This also seems unlikely—it would imply that surface temperatures at a given altitude are ∼30 K greater in NW Maxwell than in the SE. Data from all the Venus landers and probes are consistent with relatively constant surface temperatures (for a given elevation) and a constant near-surface lapse rate (Seiff et al. 1985); these inferences include results from the Pioneer-Venus-North probe, which impacted just south of Maxwell. Temperatures from nighttime infrared emission viewed from orbit (Singh 2019), though noisy, do not suggest such a large temperature difference across Maxwell. There have been no probes or landers so far north as northern Maxwell, but it seems a priori unlikely that there should be such a significant change in surface temperatures just outside the measured latitudes.
It is nearly certain that Maxwell Montes includes a variety of rock types (Basilevsky & Head 1995)—if nothing else, impact melt from the Cleopatra crater is distinguishable from the rest of the Montes (Herrick 2014; Campbell & Whitten 2021). Although variations in rock type could account for local variations in the elevation of Maxwell's snow line, it seems unlikely that the SE-NW difference in snow line elevation relates to lithology. We infer this because Maxwell is structurally complex—its surface shows with rock layers that are commonly interpreted as thrust-fault plates, cut by lineations inferred to be normal faults and/or graben, see Figure 2 (Hansen & Phillips 1995; Basilevsky & Head 1995; Ansan et al. 1996). Across such a complex terrain, it seems unlikely that a lithologic boundary would be consistently present and vary only ∼3.5 km in elevation (the difference in snow line elevation) over the ∼950 km from Maxwell's SE to NW.
Finally, it is conceivable that Maxwell's snow line does not represent an active process, but is the relic of some ancient activity. For example, the snow line could have developed on an isotherm and isohype in the past, and was subsequently tilted (along with all of Maxwell Montes) to yield the current regional variation in snow line elevation. If so, the tilt would have been slight, only ∼0 2, which is not unreasonable for tilting of crustal blocks on a tectonically active planet, e.g., Shephard et al. (2010).
4.2. Atmosphere
If the regional variation in the elevation of Maxwell's snow line cannot be explained by variations in rock types or by issues with Magellan altimetry, one must consider variations in Venus's atmosphere (Treiman et al. 2016; Brossier & Gilmore 2021). The composition of Venus's lower atmosphere, below the cloud deck, is known to vary with elevation but otherwise has been considered uniform in latitude and longitude (Seiff et al. 1985). Recent studies have demonstrated latitudinal gradients in atmosphere composition (De Bergh et al. 2006; Marcq et al. 2018; Johnson & de Oliveira 2019). Likewise, winds at the surface have been inferred to be gentle (Schubert et al. 1980; Sánchez-Lavega et al. 2017). However, Akatsuki observations of cloud-top gravity waves (∼70 km elevation) over the mountains of Aphrodite Terra and elsewhere (Kouyama et al. 2017; Kitahara et al. 2019; Fukuya et al. 2022) are consistent with significant wind speeds near the mountains' surfaces.
4.2.1. Latitudinal Gradients
A possible cause of the N-S variation in snow line elevation is that it is a response to latitudinal variations in atmosphere composition (Marcq et al. 2018), which could be caused by vertical transport (as by Hadley cells), photochemistry, and/or equilibration and disequilibrium among gas species. Most of the detectable compositional variations, from Earth-based spectroscopy, are for the ∼35–45 km elevation range. The abundance of CO at those levels increases from equator to ∼60° N (Bézard & de Bergh 2007; Marcq et al. 2008; Cotton et al. 2012; Marcq et al. 2021). Abundances of SO2 correlate well with those of CO, and thus increase away from the equator to at least 40° N (Marcq et al. 2021). The abundance of OCS is inversely correlated with that of CO, decreasing from the equator to north and south (Bézard & de Bergh 2007; Marcq et al. 2008). There is little data for latitudes greater than 60°, but Cotton et al. (2012) noted a decrease in CO abundance north of ∼60°N (Maxwell's center is at ∼66°N, 2°E), and Tsang et al. (2008) and Haus et al. (2015) noted a similar decrease south of ∼60°S. These decreases could be consistent with Hadley-like circulation cells, perhaps related to Venus's polar collar.
If the snow line represents precipitation from the atmosphere, changing atmospheric composition would have little effect if the precipitate were volatilized as itself, e.g., metallic tellurium (Te0) vapor. Atmospheric composition could affect the distribution of a precipitate if it is volatilized by a reaction with the atmosphere, e.g., iron transported as FeCl3 (Krasnopolsky 2017), or bismuth transported as Bi2S3 (Port et al. 2020). If the snow line represents atmosphere-surface interactions, varying atmospheric composition would also control the reaction products. For instance, at low OCS abundance (i.e., higher proportion of SO2), iron in surface rocks might react to form hematite, while high OCS abundance might induce the formation of pyrite (Semprich et al. 2020).
4.2.2. Winds over Maxwell
Another possibility is that the regional slope of Maxwell's snow line represents chemical interactions between near-surface winds and the solid surface. Although surface winds are generally considered to be weak, modeling by Lebonnois et al. (2018) indicates that strong winds may prevail near mountain ranges, e.g., Maxwell Montes. In fact, Lebonnois et al. (2018) found that winds on Maxwell include a strong component from SE to NW (∼3 m s−1, their Figure 14). In this case, the regional variation in snow line elevation could represent a "snow shadow" effect—parcels of atmospheric gas that had passed over Maxwell would be less capable of producing high-radar-backscatter material than gas parcels that had recently arrived from Venus's lowlands. This scenario would tend to disfavor the hypothesis of atmosphere–rock chemical reactions, because they (if carried on for significant time) would eventually saturate rocks surfaces with the high-radar backscatter material in the SE, leaving more atmospheric reactant to react with the surface downwind (NW). On the other hand, this scenario would tend to favor the atmospheric precipitate hypothesis, in which parcels of gas that had passed over Maxwell would contain less precipitable material and become exhausted at a higher altitude.
The snow shadow scenario, attractive as it might be, does not explain all the radar features of Maxwell. In particular, it does not explain why radar reflectivities decline (and emissivities increase) at Maxwell's highest elevations (Figure 2(b)). The hypothesis of atmosphere–rock chemical reaction provides a possible answer, e.g., that hematite is formed at the highest elevations, and pyrite elsewhere (Semprich et al. 2020). It is not clear whether the atmosphere precipitate model can accommodate a change in precipitate like this. Again, it is to be hoped that data from future spacecraft missions can help solve this problem (Ghail et al. 2017; Garvin et al. 2022; Smrekar et al. 2022).
5. Conclusions
The sharp change in radar properties on Maxwell Montes, its snow line, is apparent in SAR backscatter, radar emissivity, and radar Fresnel reflectivity. The elevation of the snow line (defined by Magellan SAR backscatter and global altimetry, GTDR) is not constant around Maxwell, but varies from ∼4.5 km above the datum in the SE to ∼8 km in the NW. Assuming that the altimetry is fundamentally correct, the variation in snow line elevation can be ascribed to regional winds across Maxwell, SE to NW, and varying composition of the atmosphere as it crosses Maxwell. Simply, the variation in snow line elevation is a snow shadow, where the atmosphere becomes progressively depleted in precipitable material as it crosses Maxwell. This snow shadow scenario is most consistent with the high-backscatter material being precipitated from the atmosphere, rather than as a reaction product between atmosphere and rock. If the high-backscatter material were from chemical reaction, one might expect that it would consume near-surface, readily available elements from the rock, and eventually saturate the surface, leaving abundant atmospheric reactant available at Maxwell's NW side. Available data do no constrain the nature of the snow, beyond it being an electrically conductive or semiconductor material; suggested snow materials include native semi-metals like Te (Pettengill et al. 1996). and a range of chalcogenide compounds (Klose et al. 1992; Wood 1997; Schaefer & Fegley 2004; Port & Chevrier 2020; Port et al. 2020; Port & Chevrier 2021).
This snow shadow scenario implies dynamic interactions between Venus's atmosphere and surface, more so than has previously been inferred, e.g., Seiff et al. (1985), Klose et al. (1992), and Brackett et al. (1995). The idea of a dynamic Venus atmosphere is consistent with spectroscopic data on atmospheric compositions (Tsang et al. 2008; Cotton et al. 2012; Haus et al. 2015; Johnson & de Oliveira 2019; Marcq et al. 2021), models of near-surface atmospheric circulation (Lebonnois et al. 2018), and cloud-level disturbances tied to surface topographic features (Kouyama et al. 2017; Kitahara et al. 2019; Fukuya et al. 2022). It is important that the snow line described here is only found on Maxwell Montes and the mountain ranges surrounding Ishtar Terra (Brossier & Gilmore 2021), even though other more equatorial mountains on Venus are taller than the ∼4.5 km elevation the snow line on SE Maxwell (Brossier & Gilmore 2021). This difference between the radar properties of near-polar (Maxwell) and near-equatorial (e.g., Ovda) mountains suggests a latitudinal influence, which can be ascribed (though not uniquely) to variations in atmosphere composition (Treiman et al. 2016; Brossier & Gilmore 2021). These data imply that Venus's near-surface atmosphere is more dynamic and complex than previously inferred. Upcoming spacecraft missions, including VERITAS, DAVINCI, and EnVision, should acquire data to help resolve these questions about Venus's surface mineralogy and near-surface atmosphere (Ghail et al. 2017; Garvin et al. 2022; Smrekar et al. 2022).
This research was conducted by the first author during a LPI Summer Internship, mentored by the second author. We are grateful to the LPI and to Universities Space Research for supporting the program. The Lunar and Planetary Institute (LPI) is operated by Universities Space Research Association (USRA) under a cooperative agreement with the Science Mission Directorate of NASA. Additional work was supported by NASA Science Mission Directorate (SMD) grants 80NSSC17K0766 and 80NSSC19K0549. We are grateful for corrections and comments from two anonymous reviewers. LPI Contribution #2865.
Appendix A: Snow Line Viewed in Fresnel Reflectivity
Figures 1(a) and b of the main text show the elevation of Maxwell's snow line, as recognized by Magellan SAR backscatter. However, Magellan's SAR backscatter and altimetry are made by different instruments on different orbits (Ford 1993), so there is always concern about misregistration. To investigate possible misregistration, we examined the snow line in Fresnel reflectivity, which is taken at the same time and of the same footprint as the altimetry (Bischoff et al. 1993). We estimated that the SAR-visible snow line corresponds to a Fresnel reflectivity of ∼0.35, and so we graphed the elevation of that contour around Maxwell, following the pattern of Figure 1(b) of the main text. Elevation and Fresnel reflectivity data were downloaded from JMARS, at a spatial resolution of 16 pixels per degree. From the grid of reflectivity data, we selected the points at values closest to 0.35 that are on the margin of Maxwell (and ignored similar points toward the center of Maxwell). Point-to-point distances were calculated from latitude and longitude using the Haversine formula; and elevation versus distance, clockwise around the 0.35 contour, are shown in Figure A1 with the same color code as in Figure 1(b) of the main text. Note that the snow line contour in Fresnel reflectivity shows the same general elevations as that of SAR backscatter (Figure 1(b) of main text).
Note that Figures A1 and 1(b) (main text) use the same data set for elevation—Magellan altimetry. Comparison of these two figures does not prove that the Magellan altimetry is correct (see Campbell & Whitten 2022), but does indicate that if the altimetry data are inaccurate, the inaccuracy is not merely of a few pixels, but is more regional in extent.
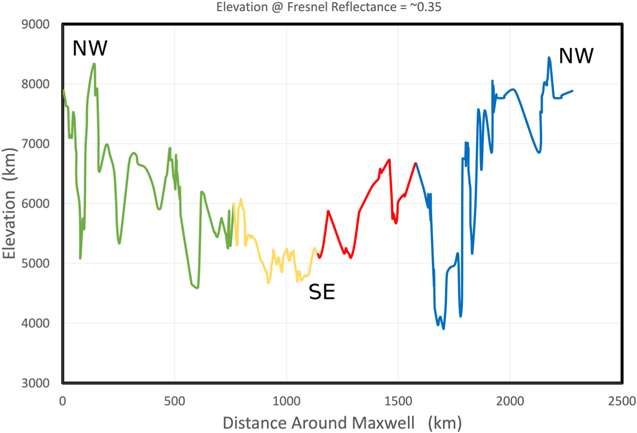
Figure A1. Maxwell's snow line using Magellan's Fresnel reflectivity data. Graph shows elevations (from Magellan GTDR) at which the Fresnel reflectivity = ∼0.35, moving around the snow line as in Figure 1 of the main text. Color coding is the same as in Figure 1 (main text), with the SE corner of Maxwell at approximately the transition from yellow to red. Note that the pattern of elevation follows closely to that of Figure 1. Distances are not the same as in Figure 1, because the Fresnel reflectivity data have a greater pixel size than the SAR reflectivity, see Kappraff (1986).
Download figure:
Standard image High-resolution imageAppendix B: Radar Emissivity & Reflectivity: E-W Traverses Across Maxwell
As noted by others, the radar properties of Maxwell Montes' surface are anomalous in several respects: high SAR backscatter and Fresnel reflectivity, and low emissivity (Klose et al. 1992; Brossier & Gilmore 2021). Another peculiar property is that the sum of reflectivity and emissivity, e + r, is significantly lower than expected. Ideally, e + r should equal unity if both measurements are full hemispherical values. The Magellan values are biconic, measuring properties in a small solid angle above each target area. The Magellan e + r is usually close to unity, typically 0.90–0.95 (Plaut 1993). Across Maxwell, however, there are significant regions where e + r is closer to 0.8 than 0.9, suggesting anomalous behavior compared with the rest of Venus.
Figures B1(a) and (b) show emissivity and reflectivity values, and their sums e + r for the E-W traverses across Maxwell in Figure 2(a) of the main text. The e + r is in the 0.90–0.95 range for "normal" Venus topography, as is also the case for Lakshmi Planum on the west (left side) and for Fortuna Tessera on the east (right) sides of Figures B1 and 2(b). The highest, central, portions of Maxwell have e + r closer to 0.8, which seems to derive mostly from lower reflectivity values; perhaps these portions of Maxwell have abundant specular surfaces that are not randomly oriented, and direct much of the incoming altimeter horn beam away from the spacecraft.
Figure B1. Emissivity, Fresnel reflectivity, and their sums on traverses across Maxwell (See Figure 2, main text). Gaps and irregularities near the centers of the profiles (∼350 km) reflect a gap in the emissivity data. Some other irregularities and sums greater than unity likely represent misregistration of emissivity and Fresnel reflectivity footprints, errors associated with extremely steep slopes (profile 2, ∼275 km), and that reflectivity represents partially the orientations of slope facets with respect to the incoming radar beam. Note that the sum is near 0.95 (Plaut 1993) for the flat plains of Lakshmi Planum (left side, profile 2) and the rough highlands of Fortuna Tessera (right sides, both profiles).
Download figure:
Standard image High-resolution image
The Cleopatra crater is distinctly anomalous. The floor of Cleopatra crater is at elevations below the snow line, and so should have SAR backscatter and Fresnel reflectivity values comparable to those of "normal" Venusian terrain, e.g., Fresnel reflectivity values near 0.2. However, emissivity values are significantly lower than would be expected if e + r were "normal." For reflectivity near 0.2 (Figure B1(a)), one would expect emissivity near 0.70–0.75, but the measured emissivity is near 0.6. Conversely, if the emissivity data are proper, one would expect Fresnel reflectivity near 0.35 rather than the measured 0.2.