


Abstract
The surfaces of airless bodies like the Moon are bombarded by a steady stream of small impactors that lead to erosion of the topography over time. However, the rate of degradation from small impacts, a key parameter in interpreting the ages of present-day lunar surface features, is not well constrained. Here we demonstrate, using a numerical mass transport model, that impact erosion is a nonlinear diffusion process, in contrast to past studies of crater degradation that have assumed that the downslope mass flux of ejecta is linearly proportional to hillslope gradient. Nonlinearity is a consequence of the asymmetric shape of ejecta blankets on sloped surfaces, and as a result, the degradation rate on steep slopes is over 40% greater than on nearly flat surfaces. Using measurements of the morphology and formation rate of small primary and secondary craters, the kilometer-scale lunar landscape diffusivity is computed and compared to the value inferred from topographic profiles of degraded craters. We show that the abundance of decameter-scale craters forming on the Moon over the past decade is consistent with small impacts dominating the erosion of the lunar landscape, but only if the primary size−frequency distribution remains steep down to the submillimeter scale.
Export citation and abstract BibTeX RIS

Original content from this work may be used under the terms of the Creative Commons Attribution 4.0 licence. Any further distribution of this work must maintain attribution to the author(s) and the title of the work, journal citation and DOI.
1. Introduction
On planetary bodies lacking an atmosphere, such as the Moon, surface evolution is driven by a limited number of physical processes that shape the landscape over time. Large craters overprint existing surface features and bury others in their ejecta blankets (Woronow 1977a, 1977b; Minton et al. 2015). In addition to forming new craters, large impacts can erode the surface through widespread seismic shaking (Richardson 2009) and ballistic sedimentation of distal ejecta (Minton et al. 2019). More numerous smaller impacts mobilize loose, unconsolidated regolith, preferentially redistributing material to gravitational lows (Ross 1968; Soderblom 1970). Rocks and boulders on the lunar surface are destroyed over timescales of tens to hundreds of Myr by impacts (Hörz et al. 1975b; Basilevsky et al. 2013; Watkins et al. 2019; Hörz et al. 2020) and thermal stresses (Molaro & Byrne 2012; Molaro et al. 2017). In concert, these mechanisms set the overall topographic roughness and control the onset of cratering equilibrium through the gradual erasure of existing craters. The rate of landscape degradation also determines the lifetime of individual surface features. Estimating this quantity, as well as how it varies with scale, is therefore imperative for crater age dating.
Degradation from small impacts, also known as "sandblasting," has long been hypothesized to be the dominant erosive mechanism on airless bodies (Heacock et al. 1966; Ross 1968), but the relative contribution of various processes to the overall landscape degradation is not well constrained. In this work, we develop a first-principles numerical model of mass transport from impacts on a sloped surface. Incorporating empirical constraints on the morphology and production rate of lunar craters, we investigate whether small impacts alone can explain the observed degradation of kilometer-scale craters on the Moon. Understanding the combination of physical processes that give rise to landscape erosion is critical to interpreting the present-day lunar surface.
Seminal work by Soderblom (1970) demonstrated that ejecta deposition from small impacts gives rise to slope-dependent mass transport that can be modeled as topographic diffusion, where the elevation of the landscape changes over time according to

with κ being the rate of diffusion, or diffusivity. The diffusive erosion model was initially used to obtain relative ages of lunar mare units (Soderblom & Lebofsky 1972) and has subsequently been applied to additional age dating investigations and studies of cratering saturation/equilibrium (e.g., Craddock & Howard 2000; Hirabayashi et al. 2017; Xie et al. 2017). Key to these studies is understanding how rapidly diffusion progresses on the lunar surface, and efforts have been made to directly measure the lunar landscape diffusivity, κ, using degraded surface features. The prevailing assumption is that diffusion from small impacts is linear, that is, the the downslope volume flux of material, q, is directly proportional to the topographic gradient, resulting in a constant value for the diffusivity:

Fassett & Thomson (2014) analyzed a population of craters between 800 m and 5 km in diameter on the maria and determined the erosion rate needed to reproduce their present-day topographic profiles. Linear diffusion was applied to pristine topographic profiles, and a value of 5.5 m2 Myr−1 was obtained for the average diffusivity over the past 3 Gyr. This degradation rate represents the cumulative effect of all erosive processes operating on the Moon over the past few billion years (not just small impacts). To date, these crater profiles offer the strongest constraint on the overall lunar landscape diffusivity. The objective of the present study is to test whether small impacts are the dominant mechanism shaping craters into their present-day degraded states. The Fassett & Thomson (2014) study population (diameters between 800 m and 5 km) therefore motivates the choice of modeling the degradation of 1 km diameter craters. The choice of scale in turn restricts the size range of craters contributing to diffusion, i.e., the precise definition of "small" impacts. It is typically assumed that a crater is diffusively degraded by impacts forming craters smaller than 10% of its diameter (Minton & Fassett 2016; Du et al. 2019; Bugiolacchi & Wöhler 2020). By that metric, we will model erosion from impacts forming craters from 100 m down to the diameter where impacts cease to form bowl-shaped craters in loose, unconsolidated regolith, the size range that diffusively degrades a 1 km diameter crater.
The rate of erosion from small impacts will depend primarily on the volume of ejecta transported downslope by the formation of a crater of a given size and the number of craters of that size forming on the lunar surface. Measurements of morphometric parameters such as depth and rim height for small lunar craters (Stopar et al. 2017) allow for estimation of the former, and the latter is constrained by crater counts or surveys of near-Earth objects. Lunar production functions (e.g., Neukum et al. 2001; Marchi et al. 2009) are commonly referenced for the cumulative size−frequency distribution (SFD) of craters forming on the Moon. However, the number of newly formed craters observed during the Lunar Reconnaissance Orbiter (LRO) mission lifetime is larger than predicted by these production functions (Speyerer et al. 2016). The SFD of craters 10–20 m in diameter is also significantly steeper than that of either Neukum et al. (2001) or Marchi et al. (2009) over the same size range, suggesting the presence of a steeper branch in the lunar primary SFD at smaller sizes. Secondaries likely play a significant role in the overturn of the upper meter of lunar regolith (Costello et al. 2018, 2020) and may similarly contribute to topographic degradation of macroscopic features.
2. Methodology
2.1. Background
Craters on airless bodies are diffusively degraded by the accumulation of many smaller craters. The effect of each crater-forming impact is small relative to the size of the crater being eroded, but the net effect of many small impacts is a gradual redistribution of material from topographic highs to topographic lows. Small impacts erode a pristine crater by diminishing the sharp rim and steep walls and infilling the interior with loose regolith. Modeling this process can provide insights into the physical parameters that control how effective small impacts are at eroding landscapes on airless bodies. Here we focus on the degradation of kilometer-scale craters on the Moon. To that end, we start with the mechanics of ejecta transport (Section 2.2) and the morphology of craters forming on a sloped surface (Section 2.3). In Section 2.4, we compute the mass transported downslope by the formation of a single crater. Finally, after discussing the scale dependence of impact erosion (Section 2.5), we derive the rate of diffusion degradation under the lunar impact flux (Section 2.6).
For impacts occurring on slopes, ejecta will travel farther in the downslope direction than in the upslope direction. This preferential downslope transport of ejecta from many impacts leads to a net flux of material from topographic highs to lows and a gradual erosion of the landscape. Asymmetric ejecta transport has been experimentally demonstrated in the laboratory for low-velocity impacts on sloped granular surfaces (Omura et al. 2021). The analytical erosion model of Soderblom (1970) makes a number of simplifying assumptions about the distribution of ejecta on sloped surfaces. The displacement of the ejecta blanket center of mass is stated to be  , where R is crater radius and α is the surface slope angle. Additionally, the total mass of ejecta is a fixed fraction of the crater volume, Mej = C1
ρ
R3, where C1 is taken to be approximately 1/2. Combining these two relations with a single power law for the cumulative cratering flux, N(>D) = AD−λ
, produces an expression for the diffusivity, which has units of m2 yr−1 (Equation (14) from Soderblom 1970; note that the factor of λ in the numerator was omitted in the original publication and has been corrected here),
, where R is crater radius and α is the surface slope angle. Additionally, the total mass of ejecta is a fixed fraction of the crater volume, Mej = C1
ρ
R3, where C1 is taken to be approximately 1/2. Combining these two relations with a single power law for the cumulative cratering flux, N(>D) = AD−λ
, produces an expression for the diffusivity, which has units of m2 yr−1 (Equation (14) from Soderblom 1970; note that the factor of λ in the numerator was omitted in the original publication and has been corrected here),

where Dmax is the diameter of the largest crater contributing to diffusive erosion. In Section 2.5, we discuss this parameter in the context of the scale dependence of the landscape diffusivity. The advantage of this mathematical model is that the key parameter, the rate of diffusion, can be calculated with only a few quantities relating to the crater morphology and impact flux. However, the linear ejecta thickness profiles used in this original model are simplistic and likely overestimate the mass of ejecta and the center-of-mass displacement.
Xie et al. (2017) updated the small impact erosion model in a study examining the effects of topographic degradation on observed crater SFDs. Diffusion from small impacts enlarges craters over time by increasing their apparent diameter. Xie et al. (2017) quantified this effect with a linear diffusion model that included new measurements of lunar simple crater morphologies, specifically, the size-dependent depth found by Stopar et al. (2017). Their revised diffusion constant is (Equation (S12) from Xie et al. 2017)

In that work, the relation for the center-of-mass displacement of the ejecta blanket,  , was retained. Crucially, this assumption leads to linear diffusion, where volume flux is directly proportional to the slope and the diffusivity is therefore independent of slope (Equation (2)). In the present study, we aim to test whether linear diffusion is a valid representation for impact erosion on the Moon. Rather than presuming an analytical form for the center-of-mass displacement of ejecta blankets on slopes, we use a 2D ejecta thickness model to numerically compute the flux of regolith transported downslope for a range of surface gradients.
2.2. Modeling Crater Mass Transport
Here we build on the impact erosion framework of Soderblom (1970) and develop a model for crater mass transport on airless bodies. In doing so, we first must characterize how ejecta is distributed during the crater formation process. Consider a vertical impact occurring on a flat surface and forming a crater with radius R. The majority of material is ejected at a constant angle with respect to the surface normal for all but the most oblique impacts (Cintala et al. 1999; Durda et al. 2012), and we set the ejection angle, θej, to be 45°, independent of crater size (Maxwell 1977). At present, we do not model the effect of impact angle on ejecta transport. Within the ejecta cone, there is a ring of particles that will have the highest ejection velocity and travel farthest from the impact point to form the boundary of the continuous ejecta blanket. Assuming that these most energetic particles are launched from the impact point and that the extent of the continuous ejecta blanket is some fixed number of crater radii, rej = η R, the ejection velocity can be solved for using the ballistic range equation. Nearly all of the ejecta from small, simple craters are observed to fall within a few crater radii of the rim (Melosh 1989). The remainder is distributed in discontinuous ejecta that lies beyond the smooth continuous ejecta region. Here we do not model spatially heterogeneous distal ejecta and assume that all ejecta is contained within the continuous blanket. For a crater with a smoothly attenuating ejecta blanket, positive elevation approaches zero as radial distance approaches infinity. While this is the mathematically ideal approach, we must choose a finite value for the extent of the continuous ejecta blanket, rej = η R, for practical computation. The ejection velocity of material that lands at the edge of the continuous ejecta blanket is

where g is gravitational acceleration. On a flat surface, all particles launched at this velocity will have the same range, η R, so the continuous ejecta blanket is circular. Rings of particles with velocity less than the maximum value (Equation (5)) will land interior to the edge of the ejecta blanket formed by the most energetic ring. Symmetry holds for all rings of particles within the ejecta cone having a constant ejection velocity, and so the entire ejecta thickness distribution is also symmetric about the impact point.
Now consider an impact occurring on a planar surface tilted at some angle, α. For the same impact energy as in the flat slope case, the velocity of particles within the ejecta cone will be equivalent, and the ring of particles launched with velocity given by Equation (5) will again form the boundary of the continuous ejecta blanket. However, due to the slope of the local topography, the range of each particle will no longer be a constant. Particles launched in the downslope direction will travel farther before landing compared to those launched in the upslope direction. From elementary ballistic trajectories, the range of a particle ejected directly downslope is

and the range of a particle ejected directly upslope is

More generally, the range of material ejected at any azimuth can be calculated using the effective slope,  , where ϕ is the azimuth angle. Material launched directly upslope or directly downslope has an azimuth of ϕ = 0° or ϕ = 180° (material "sees" the full slope). Material launched in the across-slope direction has an azimuth of ϕ = ±90° and has a range equal to the radius of the ejecta blanket on a flat surface (material "sees" no slope). As a result of this variation in ballistic range with azimuth, the extent of the continuous ejecta blanket is asymmetric for craters forming on a slope. In Figure 1, the planform shape of the ejecta blanket is shown as the surface slope is increased from a flat surface to the angle of repose for lunar regolith (∼30°–40°; Carrier et al. 1991; Kreslavsky & Head 2016). On the steepest slopes, the downslope extent of the ejecta blanket is more than double the radius of the circular blanket on a flat slope.

Figure 1. Radial extent of the continuous ejecta blanket for a 100 m diameter crater on a range of surface slopes. Ejecta blankets become elongated in the downslope direction with increasing topographic gradient (downslope is toward the bottom of the figure).
Download figure:
Standard image High-resolution image2.3. Ejecta Thickness Distribution
The spatial distribution of ejecta is determined using 2D digital elevation models (DTMs) of pristine simple craters. We adopt a volume-neutral profile for the entire crater, with a parabolic interior and an exterior that falls off with distance as r−3 (Equation (8)). We choose a cutoff value for the proximal ejecta blanket that extends to five radii from the crater center for craters forming on a flat surface (η = 5). A finite ejecta blanket with this radius would contain 80% of the volume of the ideal η = ∞ case. A minor linear term is also included for the crater exterior, forcing the total elevation to decrease to exactly zero at rej, the edge of the ejecta blanket. Including this term in the crater profile allows us to encapsulate the entire ejecta volume within a finite surface area and with the choice of η = 5 (rather than, e.g., η = 100); the restricted domain allows us to fully resolve the 2D ejecta thickness distribution using a sufficiently high resolution digital terrain model. For craters forming on a sloped surface, rej is azimuth dependent and the extent of the positive crater topography becomes less than η R in the upslope direction and greater than η R in the downslope direction. The size of the model DTM is set to fully contain the asymmetric ejecta blanket in the steepest slope case modeled, α = 30°.
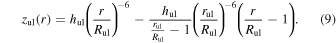
Positive topography is a combination of ejecta deposition and uplift of local materials, but uplift decays much more rapidly than ejecta thickness (∝r−6), contributing little to the positive crater topography beyond about one crater radius from the rim (Melosh 1989; Xie et al. 2017). For consistency, we include also a minor linear term that forces the uplift to reach zero elevation at a fixed distance from the crater center,  , equal to half the continuous ejecta blanket radius on a flat surface. Uplift elevation is assumed to be symmetric about the crater center for all slopes since the uplift process is less affected by the ballistic inequality that influences ejecta transport range in the upslope and downslope directions:
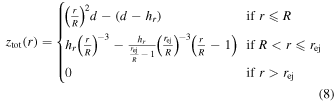
The crater depth, d, is measured relative to the crater rim and is calculated using a diameter-dependent power law from measurements made by Stopar et al. (2017) for simple lunar craters. Small craters are relatively shallower than larger craters, so taking the depth-to-diameter ratio to be a constant, e.g., d/D = 0.2, would overestimate the volume of ejecta produced by small craters. Conversely, extrapolating measurements of decameter-scale craters to very small sizes might produce erroneously shallow craters, so we enforce a minimum d/D of 0.1. For a given diameter and depth, the rim height, hr , is found by applying volume conservation within infinitesimally thin azimuthal slices.
The maximum uplift elevation reached prior to the crater collapse and infill stage, hul, is comparable to the final rim height and occurs interior to the final crater rim, at a radial distance of Rul, equal to the transient crater radius ( Melosh 1989). Choosing a value of hul = 0.925hr
produces final profiles for which the uplift and ejecta thickness are approximately equal at the final (post-collapse) rim (Figure 2), in agreement with observations that uplift makes up roughly half of the total rim height of simple lunar craters (Melosh 1989; Poelchau et al. 2009; Sturm et al. 2016; Krüger et al. 2017). Definitions and equations for all crater morphological parameters are given in Table 1.
Melosh 1989). Choosing a value of hul = 0.925hr
produces final profiles for which the uplift and ejecta thickness are approximately equal at the final (post-collapse) rim (Figure 2), in agreement with observations that uplift makes up roughly half of the total rim height of simple lunar craters (Melosh 1989; Poelchau et al. 2009; Sturm et al. 2016; Krüger et al. 2017). Definitions and equations for all crater morphological parameters are given in Table 1.

Figure 2. Positive crater topography is a combination of structural uplift and ejecta deposition. While the maximum ejecta thickness occurs at the crater rim, R, the maximum uplift height, hul, occurs closer to the crater center, at the transient crater radius, Rtr. The maximum uplift expressed in the final crater profile is taken to be half of the total rim height.
Download figure:
Standard image High-resolution imageTable 1. Model Parameters
| Parameter | Value | Reference |
|---|---|---|
| Planetary body | ||
| Surface gravity | g = 1.62 m s−2 | |
| Regolith density | ρ = 1500 kg m−3 | Carrier et al. (1991) |
| Cratering | ||
| Crater diameter and radius | D, R | |
| Surface slope | α | |
| Continuous ejecta blanket radius (α = 0) | rej,0 = η R, η = 5 | Melosh (1989) |
| Crater depth (rim crest to floor, primaries) | d = 0.08D1.13 | Stopar et al. (2017); Xie et al. (2017) |
| Crater rim height (α = 0, primaries) |
hr,0 = 
| This work (Section 2) |
| Ejection angle | θej = 45° | |
| Ejection velocity |

| |
| Azimuth-dependent effective slope |

| |
| Continuous ejecta blanket radius (α > 0) |
![${r}_{\mathrm{ej}}(\phi )=\tfrac{{v}_{\mathrm{ej}}^{2}}{g{\cos }^{2}{\alpha }_{\mathrm{eff}}(\phi )}[\sin (2{\theta }_{\mathrm{ej}}\pm {\alpha }_{\mathrm{eff}}(\phi ))\pm \sin {\alpha }_{\mathrm{eff}}(\phi )]$](https://content.cld.iop.org/journals/2632-3338/3/10/235/revision1/psjac9130ieqn9.gif)
| |
| Crater rim height (α > 0) |

| |
| Transient crater radius |

| Melosh (1989) |
| Maximum uplift radius |

| |
| Maximum uplift height | hul = 0.925hr,0 | |
| Radial uplift extent |

| |
| Crater SFD | ||
| Primary SFD coefficient and slope (D ≥ Dbreak) | Ap = 5.02 × 10⁻⁹, λp = 3.11 | Neukum et al. (2001) |
| Primary SFD coefficient and slope (D < Dbreak) | Ap0 = 2.10 × 10⁻⁷, λp0 = 4.64 | This work (Section 3) |
| Secondary SFD coefficient and slope | As = 4.40 × 10⁻⁸, λs = 4.00 | O'Brien & Byrne (2021) |
Download table as: ASCIITypeset image
This crater morphology applies only to small lunar primary craters. Larger complex craters (D > 15 km; Croft 1985; Melosh 1989) have additional features such as flat floors, central peaks, and wall terraces and form on terrain that is flat on length scales comparable to their size. Due to the lower energy of secondary crater formation compared to hypervelocity impacts, secondaries tend to be shallower than their primary counterparts (Pike & Wilhelms 1978; Melosh 1989; Stopar et al. 2017). Although distant secondaries can be morphologically similar to primaries (McEwen & Bierhaus 2006), the majority of secondaries produced by an impact will form close to the primary and have depth-to-diameter ratios roughly half that of primaries of the same size. To reflect this distinction in our mass transport model, we assign a scaling factor of 0.5 to the depth of all secondary craters. Volume conservation requires that the rim height also be scaled by a factor of 0.5, and therefore the volume of ejecta produced by a secondary in our model is half that produced by a primary of the same diameter. Uncertainty in this depth reduction parameter will affect the net downslope flux of regolith by at most a factor of two, depending on the production rate of primaries and secondaries. If secondaries dominate primaries by number and are, on average, deeper than we assume, the regolith flux would be at most twice as large. See Appendix A for sensitivity tests of this parameter under the cratering rates considered in our model.
With equations describing the spatial extent of ejecta, i.e., the planform shape of the asymmetric continuous ejecta blanket (Equations (6) and (7)), we can also characterize the full two-dimensional ejecta thickness distribution for craters on sloped surfaces. First, we assume that the final crater rim will be roughly parallel to the local slope. In the terminology of Howard (2007), this is equivalent to using an inheritance parameter of unity to describe how new craters are blended into the preexisting topography. As a result of the asymmetry in the ejecta blanket extent for craters on slopes, the rim height needed to conserve volume also varies with azimuth, with the thinnest part of the rim height occurring in the downslope direction where the ejecta blanket is longest and the thickest part in the upslope direction where the ejecta blanket is shortest. Equation (8) is modified to include an azimuth-dependent rim height and continuous ejecta blanket extent, which defines the crater elevation profile on any slope. A full summary of model parameters can be found in Table 1. The symmetric uplift profile (Equation (9)) is subtracted from the asymmetric total exterior elevation profile (Equation (8)), resulting in the 2D ejecta thickness profile in the slope-subtracted coordinate system. Because small impact erosion progresses from craters forming on inclined surfaces, these elevation profiles allow us to characterize the ejecta transport mechanics that lead to topographic degradation on the lunar surface.
2.4. Mass Transport on Slopes
The lunar surface is exposed to a steady stream of impactors that preferentially transport material downslope, eroding high standing features and infilling gravitational lows. To understand how this gives rise to topographic diffusion, we consider a small segment of a hillslope (Figure 3). Impacts along the slope eject regolith in all directions, and some amount of material is transported across an imaginary vertical plane bisecting the slope (y = 0). Impacts centered at points offset from the plane in the upslope direction (negative offset) transport material across the plane in the downslope direction (positive mass transport) and vice versa for impacts centered at points offset in the downslope direction. The amount of ejecta ejected upslope and downslope by a single impact is the same (half of the total ejecta mass). Because the downslope range is greater, there are more craters capable of launching material across the y = 0 plane in the downward direction than the upslope direction. The mass transported across the plane for a single crater, dM, is a function of the size of the crater, the topographic gradient, and the position of the crater center relative to the plane. Figure 4 shows how dM varies with the offset of the crater center for primary craters of different diameters and on surfaces with different slopes.

Figure 3. Diagram of hillslope section with gradient, α, describing the geometry outlined in Section 2.4. We embed a crater profile in the digital terrain model at a range of positions (xc , yc ) and for each case compute the mass of the ejecta blanket that lies downslope of the plane at y = 0. The number of impacts of a given size occurring per unit time is found by applying the lunar crater production rate within the area element dxdy centered on (xc , yc ).
Download figure:
Standard image High-resolution image
Figure 4. Ejecta mass, dM, transported across the plane at y = 0 as a function of yc , the position of the crater center in the along-slope direction. Left: mass transport by craters of different diameters on a 20° slope. Right: mass transported by a 100 m crater on slopes with varying gradients. Masses are shown for primary craters (transport by secondaries would be uniformly reduced by half).
Download figure:
Standard image High-resolution imageNext, consider the number of impacts occurring in a small patch of the hillslope with area dxdy. The cumulative SFD of craters forming on the Moon can be expressed as a power law of the form

where N has units of number per area per time. The exponent λ is the slope of the SFD on a  versus
  plot, and A is a constant with units of mλ–2 yr−1. The number of craters forming with diameters D → D + dD is
  . Assuming that impacts occur uniformly across the hillslope, the volume rate of regolith transported across the plane by craters in this size range forming in any area dxdy is then
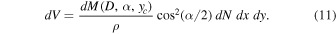
Compared to flat surfaces, inclined slopes see a reduced fraction of the sky and receive fewer impacts from an isotropic flux of impactors (Liu & Jordan 1961). An additional factor of  is applied to reduce the number of craters forming as a function of slope. We can now define dVx
, the volume rate per unit width in the across-slope direction:
is applied to reduce the number of craters forming as a function of slope. We can now define dVx
, the volume rate per unit width in the across-slope direction:

Next, we sum over all possible crater positions in the along-slope direction by integrating from yc = −∞ to yc = ∞ . In reality, because of the finite extent of the proximal ejecta blanket, only craters forming at relatively small offsets from y = 0 will transport mass across the plane. Figure 4 shows that even for slopes nearing the angle of repose, craters centered more than 10 crater radii upslope of y = 0 transport no mass across the plane. The maximum offset is reduced for craters offset in the downslope direction due to the asymmetry in ballistic range. The volume flux contributed by craters in the size range D → D + dD is
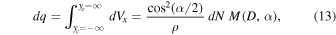
where we define M(D, α) as the net mass transported downslope from craters of size D on slopes with gradient α, integrated over all possible crater positions, yc , in the along-slope direction. Finally, we integrate this expression with respect to crater diameter to obtain the net volume flux of material across the plane from all craters:
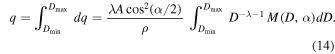
The bounds of integration are Dmin and Dmax, the diameters of the smallest and largest crater contributing to diffusive erosion of the hillslope, respectively. Table 2 contains a description of key equations in our mass transport model and their corresponding units, outlining the derivation of downslope regolith flux (q) from the ejecta mass transported downslope by a single crater (dM(D, α, yc )).
Table 2. Summary of Important Equations in Mass Transport Model
| Description of Term | Equation | Equation No. | Units |
|---|---|---|---|
| Mass transported across y = 0 by a single crater | dM(D, α, yc ) | kg | |
| Cumulative crater SFD | N(>D) = AD−λ | (10) | m−2 yr−1 |
| Number of craters forming in diameter range D → D + dD |

| m−2 yr−1 | |
| Volume rate of regolith crossing across a plane at y = 0 | |||
| by craters forming in area dx dy |

| (11) | m3 yr−1 |
| Volume rate of regolith per unit width | |||
| in the across-slope direction |

| (12) | m3 yr−1 m−1 |
| Differential volume flux per unit crater diameter |

| (13) | m2 yr−1 |
| Mass transported by a single crater | |||
| integrated over along-slope crater position |

| kg m | |
| Downslope volume flux of regolith |

| (14) | m2 yr−1 |
Download table as: ASCIITypeset image
2.5. Scale Dependence of Impact Erosion
Diffusion is a scale-dependent process by which smaller features are eroded more quickly than larger ones. Additionally, there is evidence that impact erosion is an anomalous diffusive process, meaning that diffusivity itself varies with scale (Minton & Fassett 2016). In this work, we apply our erosion model to the degradation of kilometer-scale lunar craters. The scale of interest determines the range of crater sizes contributing to diffusion (Dmin and Dmax), and the choice of 1 km facilitates direct comparison to the estimate of the lunar diffusivity made by Fassett & Thomson (2014).
The smallest crater diffusively eroding the lunar surface, Dmin, is commonly taken to be zero in analytical erosion models (Soderblom 1970; Xie et al. 2017). However, there is likely a physical lower limit to the size of a crater capable of transporting regolith down slopes. All craters in our model are assumed to form parabolic bowls and have smooth, quasi-circular ejecta blankets as described in Section 2.3. Extensive mapping of simple craters shows consistent morphological trends from diameters of ∼10 km down to decameter scales (Stopar et al. 2017), with craters maintaining the characteristic parabolic bowl shape but becoming increasingly shallow at smaller sizes. Craters between 40 and 100 m in diameter were found to have depth-to-diameter (d/D) ratios between 0.11 and 0.17 compared to ∼0.2 for craters larger than a few hundred meters. High-resolution digital terrain models suggest that this trend continues to the submeter scale, as a population of craters with diameter >10 cm in the vicinity of the Chang'e-4 landing site has an average depth-to-diameter ratio of 0.061 (Wu et al. 2021). As many of these small craters are likely to be in advanced stages of degradation and therefore shallower than their initial morphology, our minimum d/D of 0.1 for fresh craters appears to be a reasonable cutoff. Laboratory-based experiments have long demonstrated that impacts into weakly cohesive target materials produce ejecta cones and bowl-shaped craters at centimeter scales (Gault 1970; Shohet et al. 2021). Although the applicability of these low-velocity impacts to planetary surfaces is limited, they support the assumption that small craters forming in lunar regolith are capable of initiating downslope ejecta transport. This assumption breaks down, however, as the diameter of a crater approaches the size of individual regolith grains. Microcraters formed on the surfaces of rocks or glasses have distinct morphology (e.g., central glass-lined pits, spallation zones, and high-albedo "halos") that distinguish them from larger craters forming in regolith (Fechtig et al. 1972; Hörz et al. 1975a). Because of the dense target material (e.g., solid rock), the formation of microcraters is typically associated with abrasion, spallation, and melting rather than ejection of loose, unconsolidated material. These impacts play an important role in regolith production but likely contribute a negligible amount of material to the total downslope regolith flux. The smallest crater capable of producing an ejecta blanket in weakly coherent regolith is, however, uncertain, so Dmin remains a free parameter in our model, and we test the sensitivity of our results to this minimum cutoff diameter (Section 4 and Appendix A).
While the minimum crater size is independent of scale, Dmax, the largest crater diffusively eroding the lunar surface, depends on the size of the surface feature being eroded since impact erosion occurs from the cumulative effect of many craters that are much smaller than the feature itself. Craters with diameter comparable to the feature scale will overprint, catastrophically disrupt, or otherwise nondiffusively degrade the feature. For a given scale, the size range of craters contributing to diffusion is restricted to craters small enough to be meaningfully averaged over the surface. Dmax is therefore the diameter below which craters can be considered to form in a spatially continuous manner. A rule of the thumb asserts that diffusion occurs from impacts forming craters smaller than ∼10% of the size of the feature being eroded (Minton & Fassett 2016; Du et al. 2019; Bugiolacchi & Wöhler 2020). By this metric, Dmax is 100 m for our chosen scale of 1 km.
2.6. Lunar Cratering Rates
Both primary and secondary craters are included in the cratering rate in our model, and the volume flux generated by each population is determined separately. The lunar primary crater SFD for large craters is obtained using the Neukum production function (NPF; Neukum et al. 2001), which is in good agreement with estimates of the lunar cratering rate derived from dynamical models of near-Earth objects (Marchi et al. 2009). Over the range covering our scale of interest (Dmax = 100 m), the NPF can be approximated by a power law of the form in Equation (10), and a fit over the diameter range D < 100 m yields a coefficient of Ap = 5.02 × 10⁻⁹ and a slope of λp = 3.11. Although the NPF and the Marchi et al. (2009) production function are expressly valid down to craters 10 m in diameter, the formation rate of the smallest craters from these sources should be taken with caution. In the original formulation of the NPF, the 11th-order polynomial SFD was extended down to 10 m using crater counts from Apollo photographs at a limited number of sites (Neukum 1984; Robbins 2014). Only now are orbital imagery data sufficient to resolve the accumulation rate of craters as small as 10 m, and these modern observations differ substantially from commonly cited lunar production functions.
The number of fresh impacts detected by the LRO is higher than that predicted by either Neukum et al. (2001) or Marchi et al. (2009). Change detection in temporal pairs of 0.5 m pixel−1 images has revealed the formation of 222 craters during the LRO mission lifetime and 33% more craters with D > 10 m than predicted by the NPF over the same time period (Speyerer et al. 2016). Moreover, the cumulative SFD of fresh craters also appears to be quite steep. The power-law SFD slope over the 10–20 m diameter range is λ = 4.64 (95% confidence interval of 4.15–5.14), significantly steeper than the NPF primary SFD over the same size range (λ ∼ 3.11). Additionally, tens of thousands of new "splotches" were detected and presumed to be the result of clusters of secondary fragments impacting the surface. The slope of the splotch SFD was found to be λ = 4.14, but the relationship between splotch size and the diameter of an equivalent secondary crater or cluster of secondary craters has not yet been determined. Because of the uncertainty in the nature and origin of these impacts, splotches are not used to characterize either the primary or secondary crater SFDs in our model. We use only statistics of fully resolved, primary craters from Speyerer et al. (2016).
The production rate of secondaries on the Moon remains uncertain below diameters of ∼100 m, where image resolution limits crater counting statistics and erosion rapidly removes craters (Hirata & Nakamura 2006; Dundas & McEwen 2007). However, the SFD slopes of secondary fields around multiple lunar craters are broadly consistent, e.g., Tycho (λ = 3.3–4; Hirata & Nakamura 2006; Dundas & McEwen 2007) and Censorinus (λ ≈ 4; Krishna & Kumar 2016). We assume that the slope of the secondary production function for each secondary field is λs ≈ 4 at all diameters. It should be noted that the analytical diffusion models of Soderblom (1970) and Xie et al. (2017) (Equations (3) and (4)) are undefined when the crater SFD slope is greater than 4 and 4.13, respectively. One advantage of the numerical mass transport model presented in this work is the ability to characterize the topographic degradation rate under any crater SFD.
Given the LRO observations of a potentially steeper cumulative SFD slope at small diameters, we will consider two cases for the lunar primary crater production function.
Case 1: The primary cratering rate at all sizes is given by a power-law fit to the NPF. This production function underpredicts the observed number of craters with D > 10 m, but it serves as the simplest possible demonstration of our method for deriving the small impact diffusivity. Additionally, this will allow us to compare our results with the analytical diffusion model of Xie et al. (2017), which is incompatible with recent LRO measurements of the small crater production rate, as the high SFD slope yields a negative diffusivity.
Case 2: The primary cratering rate is given by a broken power law with a steeper branch at small diameters. We assume that the NPF is valid down to some diameter, Dbreak, and turns up to become steeper at smaller sizes in order to match the number density of small craters, N(> 10 m), measured by LRO. Speyerer et al. (2016) report a relatively wide confidence interval for the slope of the SFD fit to observed crater counts, 4.15 ≤ λp0 ≤ 5.14. These two constraints, the number of craters forming with diameter greater than 10 m and the slope of the steep branch, allow us to calculate the steep branch SFD coefficient according to the equation Ap0 = N(>10 m)(10 m) . The location of Dbreak is determined by the intersection of the steep branch and the NPF power law and therefore depends on the value of λp0.
Following empirical constraints on secondary production on airless bodies, the number and size of secondaries generated by the primary SFD (for both Case 1 and Case 2) are determined using the method outlined in O'Brien & Byrne (2021). Key assumptions of this method are as follows:
(1) The largest secondary produced by an impact is 5% of the primary crater diameter (Bierhaus et al. 2018) and occurs just outside the continuous ejecta blanket of the primary (r = η Rprimary).
(2) The size of the largest secondary decreases with increasing distance from the primary since larger secondary-producing fragments are ejected with lower velocities (Vickery 1987; Bart & Melosh 2010; Singer et al. 2020).
(3) The population of secondaries from any primary has an SFD slope of 4, consistent with observations of multiple lunar secondary fields (Hirata & Nakamura 2006; Krishna & Kumar 2016; Bierhaus et al. 2018).
(4) Secondary craters are only produced by primary impacts large enough to excavate coherent bedrock. Assuming an excavation depth of 10% of the final primary crater diameter (Melosh 1989), only primary craters larger than ∼50 m in diameter eject secondary-producing fragments on the present-day maria, which has an average regolith thickness of about 5 m (McKay et al. 1991). Therefore, the presence of a steep branch in the primary SFD at D < 50 m will have no effect on the present-day secondary production rate in our model, and the secondary SFD will be identical in both cratering rate cases.
We developed a Monte Carlo model that uses the NPF large primary crater flux as input and incorporates the assumptions described above to completely define the time-averaged flux of secondaries impacting a given area of the Moon per unit time (O'Brien & Byrne 2021). The model considers secondary craters forming on a small patch of the lunar surface over a single time step, e.g., 1 Myr. Primary craters forming during that time period over the entire lunar surface are generated from the input SFD using Poisson sampling. We then randomly sample the secondary craters that would form on the patch based on the secondary field SFD of each primary crater, which is a function of the primary crater diameter and its distance from the central patch. This process is repeated for thousands of time steps. The population of secondary craters formed on the patch is binned by diameter and normalized by the area of the patch and the timescale. A power law is fit to the cumulative secondary SFD to give the globally averaged secondary production rate, with parameters As = 4.40 × 10⁻⁸ and λs = 4.0. It is important to note that the global secondary SFD was not forced to have a slope of 4. If the SFD slope of individual secondary fields is constant, a global SFD with the same slope emerges, regardless of the slope of the primary crater production function (Appendix B).
The abundance of fresh craters discovered by LRO lends credence to the hypothesis that small impacts play an important role in degrading lunar landscapes. A previous study by Fassett & Thomson (2014) deduced that an average diffusivity of κFT = 5.5 m2 Myr−1 best reproduced the present-day topographic profiles of a population of craters 800–5 km in diameter, assuming that the craters were eroded by linear diffusion (Equation (2)). In the following section, we directly test whether this diffusion rate is consistent with degradation by small impacts by computing ejecta mass transport under both of the lunar cratering rate cases outlined above. For Case 2, we will vary λp0, the slope of the small primary crater SFD, along with Dmin, the other free parameter in our model, and evaluate whether the impact diffusivity matches the Fassett & Thomson (2014) results under any primary SFD consistent with LRO observations of the present-day cratering rate (Speyerer et al. 2016).
3. Results
3.1. Tuning the Model to the NPF
Following the method described in Section 2.4, regolith transport is computed for craters between 50 μm and 100 m in diameter spanning the range of sizes that diffusively degrade a 1 km crater. As a simple demonstration of our model, we first consider cratering rate Case 1, where the cumulative SFD at all sizes is given by a single power-law approximation to the NPF (extrapolated below 10 m) and a single power law for the derived secondary SFD. The choice of Dmin is somewhat arbitrary, but, looking ahead, 50 μm is our preferred value for Dmin in Case 2, so the choice allows for direct comparison of the diffusivity under each crater production rate. Due to the relatively steep slopes of the crater SFDs, the overall volume flux of material is dominated by the formation of small craters rather than the more efficient but less numerous large craters. Equation (14) is numerically integrated over crater diameter to produce net volume flux as a function of surface slope, and we find that this relationship is nonlinear as can be seen in Figure 5. Previous studies using similar erosion models have assumed that mass flux is linear (Soderblom 1970; Xie et al. 2017), leading to a diffusivity that is constant with slope (Equation (2)). However, our results show that the effective diffusivity increases by almost 50% between surfaces with near-zero slopes and those approaching the angle of repose. Terrestrial studies of hillslope diffusion have parameterized nonlinear flux using equations of the following form (Pelletier 2008):

where κ0 is the "zero-slope" diffusivity (diffusivity in the limit of slope approaching a flat surface) and Sc
is the critical slope. The exponent, n, is typically reported as either 1 (Andrews & Hanks 1985) or 2 (Andrews & Bucknam 1987; Roering et al. 1999; Mattson & Bruhn 2001). In the lunar case, the underlying erosion mechanism and target properties are different, but the nonlinear relationship between ejecta volume flux and slope is analogous to these previous studies. We use the general parameterization of Equation (15) to characterize our model results with no a priori assumption that the values of κ0, Sc
, and n will be the same as in the terrestrial case. The least-squares best-fit parameters for the flux shown in Figure 5 are κ0 = 2.05 × 10⁻² m2 Myr−1, Sc
= 47 66, and n = 1.89. The critical slope is distinct from the angle of repose, the maximum slope that a material can be piled to before slumping occurs (∼30°–40° for lunar regolith; Carrier et al. 1991; Kreslavsky & Head 2016). Above the angle of repose, mass movement is dominated by nondiffusive processes like landsliding. Mathematically, the nonlinear flux of Equation (15) becomes infinite at the critical slope, so this value should be higher than the angle of repose and should not be observable, as any slopes near Sc
would rapidly decrease to the angle of repose.
66, and n = 1.89. The critical slope is distinct from the angle of repose, the maximum slope that a material can be piled to before slumping occurs (∼30°–40° for lunar regolith; Carrier et al. 1991; Kreslavsky & Head 2016). Above the angle of repose, mass movement is dominated by nondiffusive processes like landsliding. Mathematically, the nonlinear flux of Equation (15) becomes infinite at the critical slope, so this value should be higher than the angle of repose and should not be observable, as any slopes near Sc
would rapidly decrease to the angle of repose.

Figure 5. Volume flux (left) and diffusivity (right) as a function of slope under the Neukum primary crater production function (Neukum et al. 2001) and subsequent secondary production function. The dashed line indicates the value predicted by the analytical linear diffusion model of Xie et al. (2017) (Equation (4)) for the same cratering rate.
Download figure:
Standard image High-resolution imageIn a series of experiments by Omura et al. (2021) where projectiles were impacted onto inclined dry-sand layers, the centroid of the final 3D crater profile was observed to migrate downslope from the impact point. The normalized centroid migration distance increased nonlinearly with increasing surface slope and was fit by an equation similar in form to Equation (15). In these experiments, the "divergent" slope, where centroid migration distance approaches infinity, was empirically determined to be ∼40° and the exponent, n, was assumed to be 2. Although centroid migration was attributed to landsliding within the crater interior (not included in our model of small hypervelocity impacts) in addition to asymmetric ejecta transport, the agreement with our best-fit nonlinear flux parameters is noteworthy and suggests that nonlinearity is a natural consequence of the mechanics of impact processes on sloped surfaces.
The simple test of mass transport under the extrapolated NPF with no steep branch at small diameters (cratering rate Case 1) demonstrates the slope dependence of the small impact diffusivity, but the quantitative diffusion rate (κ0 = 0.021 m2 Myr−1) is orders of magnitude lower than the value obtained by Fassett & Thomson (2014; κFT = 5.5 m2 Myr−1). For the same primary and secondary cratering rates, the Xie et al. (2017) analytical model yields a value of 0.029 m2 Myr−1, within 50% of our estimate (note that for this comparison, Equation (4) has been modified to include a Dmin of 0.05 mm rather than being integrated from zero to Dmax). We find that there is no value of Dmin that can reproduce the diffusivity observed by Fassett & Thomson (2014). Additionally, making secondaries as efficient as primaries at transporting mass, i.e., by having identical morphology, would only increase the zero-slope diffusivity by 50%. Under cratering rate Case 2, the diffusivity (κ0) will scale with the number of small impacts forming on the surface. However, the critical slope, Sc , and nonlinear exponent, n, are insensitive to changes in the SFD parameters and remain unchanged even under a broken power-law crater production function. Thus, we adopt the Sc and n values above when changing the impact rate.
The nonlinear nature of impact erosion raises the question, what zero-slope diffusivity, κ0, corresponds to the linear diffusivity inferred from degraded mare crater profiles, κFT = 5.5 m2 Myr−1? For a given linear diffusivity, there is an equivalent nonlinear diffusivity that produces the same amount of degradation in the same time period. Here we derive this mapping between linear and nonlinear diffusivity, which allows us to compare our results to those of Fassett & Thomson (2014). Because nonlinear diffusivity increases on steep slopes, the zero-slope diffusivity must be lower than κFT to produce the same net degradation. To determine the equivalent κ0, we created DEMs of pristine 1 km craters and analyzed how their shapes changed over time under the effects of topographic diffusion. A 1 km diameter crater was first instantiated on a 10 m pixel−1 grid with an initial bowl-shaped morphology identical to that described in Section 2.3 (Equation (8)). Linear diffusion with κFT = 5.5 m2 Myr−1 was applied by solving the 2D diffusion equation (Pelletier 2008), and the depth of the crater (rim crest to floor) was determined after a period of 3 Gyr. Over that time period, linear diffusion with κFT reduces a 1 km crater to ∼55% of its original depth. Nonlinear diffusion was then applied to the same initial pristine crater using nonlinear flux parameters Sc
= 4766, n = 1.89, and a range of values for κ0. Interpolation of the final depth versus κ0 curve yields a value of κ0 = 5.20 m2 Myr−1 (94% of κFT) to reduce the crater to the same depth as the linear case after 3 Gyr. This equivalent zero-slope diffusivity is nearly 250 times greater than that under the nominal NPF and resulting secondary SFD, meaning that the extrapolation of the NPF is inconsistent with the findings of Fassett & Thomson (2014). As shown in Figure 6, a 1 km crater subject to diffusion under the NPF would be virtually pristine after 3 Gyr of erosion with only minor smoothing of the rim and negligible infilling of the interior. This is in contrast to what is observed on the lunar maria, where kilometer-scale craters can be found in advanced stages of degradation (Fassett & Thomson 2014). A significantly higher erosion rate (from small impacts or other processes) is required to explain the present-day state of the lunar surface. We next investigate whether the high value of κ0 required to match the observed maria diffusion rate might be consistent with the enhanced small crater production rate suggested by LRO observations (Case 2).

Figure 6. Cross section of a 1 km crater under linear and nonlinear diffusive degradation with different rates. The average linear diffusivity inferred from degraded kilometer-scale craters on the lunar maria, κFT (Fassett & Thomson 2014), reduces the crater to 55% of its original depth after 3 Gyr. Nonlinear diffusion from impacts occurring under the Neukum et al. (2001) production function reduces the crater's depth by less than 1% of its original depth over the same timescale. A nonlinear diffusion rate that is roughly 250 times greater (κLRO) would be required to match the degradation observed within the Fassett & Thomson (2014) crater population.
Download figure:
Standard image High-resolution image3.2. Tuning the Model to LRO Observations
As discussed in Section 2.6, the findings of Speyerer et al. (2016) indicate that rather than extrapolating the NPF to arbitrarily small sizes, the lunar primary crater SFD is better represented by a broken power law that turns up below some diameter, Dbreak, to a steeper slope, λp0. The steep-slope SFD coefficient, Ap0, is completely defined by the LRO-observed crater density, N(>10 m), and SFD slope, λp0, via the equation Ap0 = N(>10 m)(10 m) . Dbreak is calculated from the intersection of the NPF and a power law with parameters Ap0 and λp0. The steep SFD slope revealed by LRO observations suggests that small craters could be abundant enough to dominate landscape degradation on the Moon, in which case the smallest diameter contributing to diffusion (Dmin) becomes an important control on ejecta mass transport. Here we explore what combinations of λp0 and Dmin, if any, produce a zero-slope diffusivity of 5.20 m2 Myr−1, corresponding to the linear diffusivity measured by Fassett & Thomson (2014) on the lunar maria. Figure 7 shows a contour plot of the kilometer-scale diffusivity as a function of these two free parameters in our model. We find that under certain combinations of λp0 and Dmin, the regolith volume flux from small impacts is high enough to produce the observed diffusion rate.

Figure 7. Kilometer-scale diffusivity (Dmax = 100 m) from small impacts under a broken power-law cratering rate where the steep branch of the primary SFD has slope λp0 and diffusive mass transport extends down to a crater diameter of Dmin. The solid black contour line represents a zero-slope diffusivity of 5.20 m2 Myr−1, equivalent to the linear diffusivity measured by Fassett & Thomson (2014). The dashed line shows the SFD slope for fresh craters detected by LRO (shaded region is the 95% confidence interval; Speyerer et al. 2016).
Download figure:
Standard image High-resolution imageWith a broken power law, it is possible to match both the NPF crater frequencies at large sizes and the LRO fresh crater SFD at diameters of 10–20 m. Moreover, under a cratering rate consistent with both of these observational constraints, the diffusivity from small impacts is in line with the kilometer-scale degradation rate on the lunar maria (Fassett & Thomson 2014). For the Case 2 cratering rate in our model, we selected λp0 = 4.64, the best-fit value for the LRO SFD slope (Speyerer et al. 2016). The SFD with that slope passes through the observed crater density N(>10 m) with coefficient Ap0 = 2.10 × 10⁻⁷ and intersects the NPF at a diameter of Dbreak = 11.81 m. As seen in Figure 7, the Dmin required to produce the observed maria diffusivity under this cratering rate is ∼50 μm. Impact experiments do not exist at such small scales, but the most relevant experiments support a Dmin of this approximate scale, with craters at millimeter to centimeter scales producing ejecta cones and bowl-shaped final profiles (Gault et al. 1972; Shohet et al. 2021). The 95% confidence interval of LRO slopes (4.15–5.14) corresponds to a required Dmin ranging from effectively zero to a few millimeters.
Figure 8 shows our Case 2 cumulative SFDs for primary and secondary craters. Because diffusive mass transport extends to very small crater sizes, our model necessitates an extrapolation of the LRO primary SFD below the ∼10 m diameter completeness limit. Though it is possible to reproduce the observed maria diffusivity with small impacts alone, doing so requires a potentially unreasonable number of small craters. Due to the steep primary SFD branch, the Case 2 cratering rate predicts many more craters with D < 10 m than previous estimates of the small lunar crater flux extrapolated from the NPF, as well as a higher number density than the model-derived secondary SFD at all sizes. At Dmin = 50 μm, the extrapolated LRO steep branch gives a number density, N( ), that is almost 3000 times greater than the cumulative number density of secondaries at the same scale and ∼5 × 10⁸ times greater than the cumulative number density predicted by the NPF extrapolation (Case 1). The production rate of craters at the millimeter scale and below remains uncertain but is a vital constraint on the magnitude of the small impact diffusion rate. A synthesis of microcrater populations (Fechtig et al. 1972; Hörz et al. 1975a, 2020), bolide flash observations (Brown et al. 2002; Suggs et al. 2014), and observations of present-day decameter-scale crater production, along with higher-resolution crater counts in secondary fields, will likely be necessary to produce a self-consistent lunar cratering rate at all sizes.

Figure 8. Crater fluxes required to achieve a small impact erosion rate consistent with the observed maria diffusivity (Fassett & Thomson 2014). The primary crater SFD is given by the NPF (Neukum et al. 2001) down to a diameter of 12 m. For smaller primaries, a steeper-sloped power law is used following LRO observations of fresh craters (Speyerer et al. 2016). The global secondary crater SFD produced by this cratering rate is generated from a Monte Carlo model according to observations of secondary production on airless bodies (O'Brien & Byrne 2021).
Download figure:
Standard image High-resolution image4. Discussion
4.1. Slope Dependence of Diffusive Degradation
Mass transport under the combined primary and secondary cratering rate was computed for craters between 50 μm and 100 m in diameter using the Case 2 cratering rate (Figure 8), confirming the nonlinearity of the regolith volume flux driven by small impacts. Figure 9 shows the slope dependence of the kilometer-scale effective diffusion rate, which has best-fit flux parameters (Equation (15)) κ0 = 5.20 m2 Myr−1, Sc
= 4766, and n = 1.89. Although steep slopes are comparatively rarer on the Moon, the diffusion rate on slopes nearing the angle of repose is over 40% higher than on slopes of only a few degrees. The average linear diffusivity measured by Fassett & Thomson (2014), 5.5 m2 Myr−1, corresponds to the nonlinear degradation rate on slopes of ∼14° (typical of the interior of fresh bowl-shaped craters).

Figure 9. The small impact diffusion rate, shown here for Dmax = 100 m, is nonlinear, increasing with topographic gradient. Over 3 Gyr, nonlinear topographic diffusion with a zero-slope diffusivity of 5.20 m2 Myr−1 would degrade a 1 km crater to the same depth as linear diffusion with a diffusivity of 5.5 m2 Myr−1, the average diffusivity measured on the lunar maria (Fassett & Thomson 2014).
Download figure:
Standard image High-resolution imageThe nonlinearity of small impact erosion is a product of ballistic ejecta transport from craters forming on sloped surfaces and is not related to the presence of the steep branch in the LRO primary SFD. The diffusion rate varies with slope under both the cratering rates considered in our model (Section 2.6) as can be seen in Figures 5 and 9. In fact, the best-fit critical slope, Sc , and nonlinear exponent, n, (Equation (15)) are identical under the two cratering rate cases. Further sensitivity tests show that these nonlinear flux parameters are independent of the cratering rate and remain unchanged for any scaling of the cratering rate or variation in SFD slope (see Appendix A). Varying parameters that determine the spatial distribution of ejecta do, however, influence the nonlinearity of diffusive degradation. For example, changing how rapidly structural uplift attenuates with radial distance affects not only the zero-slope diffusivity but also how diffusivity increases with slope. See Appendix A for a detailed analysis of how the various parameters in our model influence the retrieved diffusion rate.
4.2. Scale Dependence of Diffusive Degradation
Subject to diffusive erosion, smaller features will be degraded faster than larger features since the characteristic diffusion timescale is proportional to the square of the length scale. For impact-driven landscape diffusion, there is an additional scale dependence owing to the fact that larger features are subject to a wider size range of impactors. Consider two lunar craters with diameters of 100 m and 1 km. Each crater is diffusively degraded by impacts forming craters significantly smaller than the crater itself. Using the rule of the thumb that diffusion occurs from impacts forming craters smaller than ∼10% of the diameter of the given crater (Minton & Fassett 2016; Du et al. 2019; Bugiolacchi & Wöhler 2020), the 100 m diameter crater is degraded by craters up to 10 m in diameter, while the 1 km crater is degraded by craters up to 10 m, as well as craters from 10 m to 100 m in diameter. Because more craters contribute to the degradation of the larger crater, the diffusivity experienced by the larger crater must be higher. The scale dependence of diffusivity is therefore closely linked to the formation rate of craters at different sizes, i.e., the slope of the cumulative crater SFD (Equation (10)). By changing the value of Dmax, our model can easily be applied to derive the degradation rate for craters smaller or larger than 1 km in diameter.
Over the size range containing simple craters on the Moon (D < 15 km; Croft 1985; Melosh & Ivanov 1999), diffusivity varies relatively weakly with the maximum crater diameter contributing to diffusion up to Dmax of a few kilometers (Figure 10). As Dmax is increased to larger than 1 km (applicable to the degradation of craters 10 km and larger), diffusivity begins to increase, but this trend cannot be extrapolated to arbitrarily large scales. Because our model assumes simple crater morphology, it is only valid for  15 km and therefore only applicable to the degradation of craters smaller than 150 km in diameter. However, the scale dependence of diffusive degradation over the full diameter range of simple craters is relatively weak. The smallest craters, not the largest, dominate diffusive degradation at all scales, and as a result, changing Dmax from 1 m to 15 km leads to an increase in the zero-slope diffusivity of less than a factor of two.

Figure 10. The small impact diffusion rate is weakly scale dependent. Larger surface features are eroded by a wider range of crater diameters (larger Dmax) and therefore experience a higher diffusivity. Over the diameter range where eroding impacts produce simple crater morphologies ( 15 km), the zero-slope diffusivity varies by ∼35%.
Download figure:
Standard image High-resolution image
Varying Dmin, the smallest crater contributing to diffusion, has a much stronger effect on the landscape diffusion rate. At the kilometer scale (Dmax = 100 m), increasing Dmin from 50 μm to 5 mm causes the zero-slope diffusivity to decrease by a factor of ∼18. If ejecta transport extends down to the micron scale (decreasing Dmin from 50 to 5 μm), the zero-slope diffusivity would increase by a factor of 4. The scale at which small impacts no longer degrade the landscape diffusively is not well constrained, but evidence from lunar topography, impact experiments, and microcrater morphology suggests that impacts into granular materials produce cones of ejecta and bowl-shaped craters down to scales on the order of millimeters to centimeters. In reality, there is likely a gradual roll-off in diffusive efficiency rather than a hard cutoff as is assumed in our numerical model. A choice of Dmin = 50 μm is a reasonable approximation and forms a self-consistent link between the LRO crater SFD and the Fassett & Thomson (2014) diffusivity. More work is needed to quantify ballistic ejecta transport and crater morphology at the smallest sizes.
4.3. Implications of Extrapolating the Lunar Crater Flux
The cratering rate required to reproduce the observed maria degradation rate challenges long-standing assumptions about the production of small lunar craters. In order to match the Fassett & Thomson (2014) diffusivity, a power law of slope b > 4.15 must be extrapolated from diameters of 10–20 m down to less than a centimeter. For the Case 2 crater SFDs (Figure 8), primaries exceed secondaries (SFD slope b = 4.0) at all sizes, though the two production functions are comparable at diameters of ≈10 m. Under such a cratering rate, topographic degradation is dominated by primary cratering processes at all scales. It is possible that our method for generating secondaries from a primary crater population underpredicts the true number of secondaries forming on the lunar surface or that the primary SFD rolls over at very small sizes. If so, secondaries could outnumber primaries at the smallest scales. The enigmatic splotches may further elucidate the relative contribution of primary versus secondary cratering to regolith processes at small scales. Currently, these features are not included in the crater production rate for our mass transport model due to ambiguity regarding their origin and morphology. At sizes of 10 m, splotches are ∼600 times more numerous than primary craters. However, splotches are thought to originate from clusters of secondary fragments where individual craters are much smaller than the splotch. Splotches also lack well-defined rims and likely excavate to relatively small depths. Impact experiments have shown that clustered impactors produce shallow depressions with depth-to-diameter ratios of 1/30 and displace up to an order of magnitude less ejecta than a single impactor of the same mass (Schultz & Gault 1985). Additional measurements of splotch morphology are necessary to characterize ejecta transport from these clustered secondary impacts.
A second issue with extrapolating the Speyerer et al. (2016) observations to very small crater sizes is that the steep SFD slope could significantly overestimate the number of small impacts forming on the lunar surface. One of the most directly relevant constraints is the Surveyor 3 TV camera, which resided on the lunar surface for 942 days before it was returned to Earth by astronauts during the Apollo 12 mission. A section of aluminum tubing from one of the radar antenna support struts was analyzed and found to contain no micrometeorite craters, placing an upper limit on the meteroid flux the camera had been exposed to during its time on the Moon (Cour-Palais et al. 1971). Given assumptions about the microcrater detection limit and the penetration depth of hypervelocity impacts into solid aluminum, we can infer that no impacts occurred that would have produced a crater larger than roughly 1 mm in lunar regolith. Along with the surface area of the tube and the exposure time of 942 days, the upper limit on the flux of craters larger than 1 mm is 10−4.51 m−2 s−1, or 974.6 m−2 yr−1. For comparison, the primary crater SFD required to match the Fassett & Thomson (2014) maria diffusivity (Figure 8) yields a flux of 1.75 × 10⁷ m−2 yr−1 at the same size, an overestimate of a factor of ∼18,000.
If the primary SFD rolls over to a slope as shallow as that of the NPF (or shallower), it would not be possible to reproduce the observed maria diffusivity using micrometeorite bombardment alone. Small impacts would be too infrequent, and the small impact diffusivity would approach the value obtained under the extrapolated NPF (Case 1), orders of magnitude lower than the Fassett & Thomson (2014) value. The discrepancy between the small impact diffusivity predicted by our model and the observed degradation of kilometer-scale craters could then be explained in a number of ways. First, it is possible that for most of the past few Gyr, the flux of dust in near-Earth space was much higher than it is today. The Fassett & Thomson (2014) diffusivity represents an average degradation rate over the past ∼3 Gyr, and using dust impact rates from Surveyor 3 may underpredict the total amount of ejecta mass transport driven by small (and large) impacts over that time period. Since the smallest craters dominate diffusive degradation, this would not require a corresponding increase in the number of large impactors, which would be apparent in the lunar cratering record.
Second, it is possible that other erosive processes contribute significantly to the degradation of simple lunar craters. By applying a linear diffusion model to match present-day degraded crater profiles, Fassett & Thomson (2014) obtained a diffusivity that includes the cumulative effect of all erosive processes acting over the past 3 Gyr. The interiors of fresh kilometer-scale craters are some of the steepest locations on the Moon (Kreslavsky & Head 2012) and therefore are more sensitive to degradation from processes such as seismic shaking and ballistic sedimentation. Crater interiors are also susceptible to advective mass movement, i.e., landsliding. The erosion rate inferred from simple crater interiors, which have slopes approaching the angle of repose, may be significantly higher than that on typical lunar terrain (the median slope on the maria at 17 m baselines is 2°; Rosenburg et al. 2011). Under this paradigm, the steady stream of micrometeorites impacting the Moon contributes a background degradation rate with magnitude comparable to the diffusivity found by our model using the extrapolated NPF only (Section 3.1), and other processes dominate small impact erosion in magnitude but are localized in time and space. Minton et al. (2019) used a landscape evolution model to study the onset of cratering equilibrium under various forms of diffusive degradation and found that the strongest control on the equilibrium SFD of small crater populations was not "sandblasting" from micrometeorites but the energetic deposition of distal ejecta concentrated in spatially heterogeneous rays (Elliott et al. 2018). Our model includes diffusive erosion from secondary-forming ejecta fragments, but these impacts are assumed to be both spatially and temporally uniform, and it is unclear whether the two methods yield similar amounts of net degradation. Integrating our approach to diffusion from secondaries with the apparent importance of concentrated rays to equilibrium crater SFDs is beyond the scope of this work, but the work of Minton et al. (2019) suggests that small impacts may not be the dominant erosive mechanism on the lunar surface.
5. Conclusions
In this study, we have developed a novel numerical model of mass transport on airless bodies to test the hypothesis that small impacts are the dominant erosive mechanism on the lunar surface. This model demonstrates that crater ejecta deposition gives rise to a topographic diffusion process as shown in seminal work by Soderblom (1970). However, a key assumption in this and many subsequent models of small impact erosion (Craddock & Howard 2000; Fassett & Thomson 2014; Xie et al. 2017) is invalid, namely, that the downslope flux of material is linear with respect to surface slope and consequently that diffusivity is a constant. We instead find that the regolith volume flux varies nonlinearly with surface slope. Under this framework for small impact erosion, the diffusion rate is both anomalous, i.e., scale dependent, and nonlinear, i.e., slope dependent. This result is supported by recent experiments of impacts onto inclined surfaces in which nonlinear transport arises from asymmetric ejecta deposition (Omura et al. 2021).
The number of craters detected by the LRO is higher than predicted by common production functions, suggesting an abundance of small craters forming on the present-day lunar surface (Speyerer et al. 2016). A broken power-law SFD is capable of reproducing both the steep slope and cumulative number of craters in the 10–20 m diameter range seen by LRO, as well as the SFD of larger craters given by the NPF (Neukum et al. 2001). Under reasonable assumptions about the smallest crater contributing to diffusion and extrapolation of LRO observations, mass transport from small impacts in our model is consistent with the high degradation rate inferred from topographic profiles of kilometer-scale craters on the lunar maria (Fassett & Thomson 2014). Therefore, it is plausible that small impact erosion has been the dominant erosive mechanism on the Moon over the past few billion years. Our results show that the smallest craters, rather than the more effective but comparatively rarer large craters, dominate mass transport.
Our quantitative estimate of the small impact diffusion rate identifies measurements that can improve and constrain erosion models. Characterization of very small crater morphology is necessary to better understand the scale at which impacts into lunar regolith cease to create ejecta blankets. Additional observations of fresh craters and secondary splotches will constrain the present-day lunar cratering rate and elucidate whether primary or secondary craters are the main driver of diffusive erosion. Incorporating estimates of the lunar micrometeoroid flux obtained from impact flashes (Suggs et al. 2014), orbital dust measurements (Horányi et al. 2014), and dynamical models (Pokorný et al. 2019) can minimize potential errors in extrapolating the lunar crater SFD below the LRO detection limit. While small impact erosion alone is shown here to be consistent with the degradation of kilometer-scale craters, agreement requires an impact flux orders of magnitude higher than the upper limit determined by nearly 3 yr of lunar surface exposure by the Surveyor 3 lander (Cour-Palais et al. 1971). Other mechanisms, both diffusive and nondiffusive, likely contribute to erosion of the lunar surface. Similar first-principles estimates of the degradation rate from seismic shaking, thermal creep, and ballistic sedimentation are necessary to fully unravel the overall degradation of landscapes on airless bodies.
Appendix A: Sensitivity Tests of Model Parameters
Our numerical model of impact erosion contains several parameters whose values were selected using the best available observational data. To determine the relative importance of these constraints to the lunar diffusivity, we varied each parameter from its nominal value and measured the resulting effect on the diffusion rate and nonlinear flux parameters (critical slope, Sc , and exponent, n) by rerunning our mass transport model and varying a single parameter each time. Where applicable, we discuss the influence of a parameter under each of the two impact fluxes considered in our model: Case 1, NPF (Neukum et al. 2001); and Case 2, NPF plus a steep branch from LRO fresh craters (Speyerer et al. 2016).
A.1. Parameters That Influence Magnitude of Diffusion Rate
Parameters tested in this section influence the magnitude of the small impact diffusivity but have no effect on the nonlinearity of small impact diffusion (Equation (15). Varying these parameters causes the zero-slope diffusivity, κ0, to change, but the critical slope, Sc , and exponent, n, remain unchanged from their reported values of 47.66° and 1.89, respectively.
A.1.1. Secondary Reduction Factor
Secondary craters are assumed to be half as deep as primaries of the same size and therefore less efficient at transporting mass downslope. Varying this reduction factor changes the relative importance of secondaries to impact erosion. Under impact flux Case 1 (NPF only), secondaries dominate over primaries by number below diameters of ∼12 m and contribute significantly to the overall landscape diffusion. If secondaries are equal in depth to primaries of a given size, the zero-slope diffusivity would increase by approximately 50% from the value obtained using a depth reduction factor of 0.5. Likewise, if secondaries transport zero mass downslope (no contribution from secondaries), the zero-slope diffusivity is roughly halved.
Observations from the LRO's Narrow Angle Camera revealed that the present-day production rate of primary craters 10–20 m in diameter is greater than predicted by the NPF. The SFD over this size range is well described by a power law with a best-fit slope of 4.64, significantly steeper than the NPF over the same range (∼3.11) and steeper even than the commonly cited SFD slope of 4 for lunar secondaries. Incorporating this result into our model cratering flux (Case 2) reduces the importance of small secondaries relative to primaries. In fact, in our preferred impact rate primaries exceed secondaries by number at all sizes considered (Figure 8 in the main text). Under this cratering rate, secondary craters have a relatively minor effect on the overall diffusion rate, and varying the secondary depth reduction factor between 0 (no contribution from secondaries) and 1 (secondaries equal to primaries in depth) changes the zero-slope diffusivity by less than 1%.
A.1.2. Minimum Crater Diameter, Dmin
The smallest crater contributing to diffusion is a free parameter in our model. A detailed explanation of this parameter and how we selected a value for Dmin is found in Sections 2.5 and 3.2 of the main text. Because impact erosion is controlled by the smallest craters, not the largest, Dmin has a large effect on the diffusion rate. Our preferred value of 50 μm was selected, in combination with an SFD slope of 4.64 for the LRO steep primary branch, to reproduce the observed maria diffusivity from Fassett & Thomson (2014). If Dmin is decreased by an order of magnitude to the micron scale, the zero-slope diffusivity in our model would increase by a factor of ∼4. If Dmin is increased by two orders of magnitude to the millimeter scale, the zero-slope diffusivity would decrease by a factor of ∼18. In either case, it would still be possible to reproduce the observed maria diffusivity by varying another free parameter in our model, namely, the slope of the steep primary branch. The 95% confidence interval of best-fit SFD slopes (4.155.14) permits Dmin values from effectively 0 to ∼1 cm (see Figure 7).
Under the shallower primary SFD in impact cratering flux Case 1 (NPF only), the size of the smallest crater in our model has a less significant effect on the overall diffusion rate. Increasing Dmin by three orders of magnitude (to the centimeter scale) decreases the zero-slope diffusivity by 20%. It should be noted that with impact erosion occurring under the NPF, there is no value of Dmin that results in a diffusivity as high as the value measured on the lunar maria by Fassett & Thomson (2014). Even at a Dmin of effectively zero, the small impact erosion rate is too low by roughly two orders of magnitude.
A.1.3. Maximum Crater Diameter, Dmax
As discussed in Section 2.5, the largest crater contributing to diffusive erosion is a function of the scale of the surface feature being eroded. We follow the common assumption that a crater of size D is diffusively degraded by the formation of craters smaller than 0.1D. Because impact erosion is dominated by the smallest craters, the diffusion rate is only weakly dependent on this assumption and the curve of zero-slope diffusivity versus Dmax (Figure 10) is nearly flat for Dmax less than 100 m. If the largest crater that diffusively degrades a 1 km crater is 1 m rather than 100 m (as would be expected using the Dmax = 0.1D assumption), the zero-slope diffusivity would be virtually unchanged (<1% decrease). To estimate the scale dependence of diffusivity, increasing Dmax by an order of magnitude, from 100 m to 1 km (changing the applicable scale from 1 to 10 km), only increases the zero-slope diffusivity by ∼2%.
A.1.4. Crater Depth
Analysis of a population of lunar craters by Stopar et al. (2017) demonstrated that the ratio of depth (rim height to floor) to diameter (d/D) of fresh simple craters is size dependent. Xie et al. (2017) characterized this size dependence using a power law,

which predicts that a 1 km crater has a depth-to-diameter ratio of ∼0.2 and a 10 m crater has a depth-to-diameter ratio of ∼0.1. Wu et al. (2021) analyzed a population of 310 craters near the ChangE 4 landing site (diameters 0.1 m1 km) using a high-resolution digital terrain model. The average d/D of the population was 0.061, but the freshest crater in the smallest diameter bin was found to have d/D = 0.12. We enforce a minimum d/D of 0.1 to prevent anomalously shallow small craters. The equation above applies only to primary craters, and all secondaries are assumed to be half as deep as a primary of the same size. In our model, crater depth controls the total volume of ejecta transported downslope, and here we consider the effect of using a constant value for d/D instead of the Stopar et al. (2017) diameter-dependent power law. Fixing d/D at our minimum value of 0.1 and keeping the rim height measured by Stopar et al. (2017) fixed at hr = 0.04D would decrease the zero-slope diffusivity by less than 0.1% because impact erosion is dominated by the smallest (and shallowest) craters. Decreasing the depth of the comparatively rarer large craters does not significantly decrease the total downslope volume of ejecta. Alternatively, increasing the depth of the smallest craters by fixing d/D at 0.2 would make the dominant small craters more efficient at transporting mass downslope and would cause the diffusion rate to nearly triple.
A.1.5. SFD Coefficients
The diffusion rate from small impacts is proportional to the number of craters forming on the lunar surface, where the cumulative number of craters forming with diameters larger than D is given by

Scaling the crater production SFDs of both primary and secondaries by a constant factor therefore scales the diffusion rate by the same factor. That is, if both SFD coefficients, Ap and As , are multiplied by a factor of C, the resulting zero-slope diffusivity will be scaled by C. Scaling one of the two populations individually has a variable effect on the magnitude of diffusion depending on its relative importance. Under cratering rate Case 1 (NPF only), scaling the NPF down by an order of magnitude decreases the zero-slope diffusivity by a factor of ∼2, and scaling it up by an order of magnitude increases the zero-slope diffusivity by a factor of ∼6. Under cratering rate Case 2 (NPF + LRO), where diffusion is controlled predominantly by primaries, the same order-of-magnitude variation in the primary production function changes the zero-slope diffusivity by approximately a factor of 10.
We also consider the effect of scaling the secondary flux in our model, which is derived from a numerical model outlined in O'Brien & Byrne (2021) and summarized in Section 2.6. There are a number of assumptions in this model, and it is possible that we are either underestimating or overestimating the number of secondaries forming on the lunar surface. As described in the main text, we only consider bowl-shaped secondary craters produced by impacts that excavate coherent bedrock and do not include the flux of unresolved splotches measured by Speyerer et al. (2016) anywhere in our model. Our model-derived, globally averaged secondary crater production flux has a constant SFD slope of 4 and is lower than the LRO-corrected primary flux at all sizes (Figure 7), in contrast to long-standing assumptions about the abundance of small secondaries. Increasing the production rate of secondaries by a factor of 10 would lead to secondaries exceeding primaries at diameters between ∼30 cm and 180 m but would only increase the overall diffusion rate by ∼2%. To force secondaries to exceed primaries by number at the smallest crater diameter considered in our model (Dmin = 0.05 mm), the secondary flux must be 5000 times greater than our model-derived secondary flux. Such a scenario is unrealistic, as secondaries would then exceed primaries at all diameters and the diffusion rate would be larger than the observed maria value (Fassett & Thomson 2014) by a factor of ∼11.
Under cratering rate Case 1 (NPF only), scaling the secondary SFD by a factor of ∼600 produces a zero-slope diffusivity consistent with the value observed on the lunar maria. It is unlikely, however, that our Monte Carlo model underpredicts the production rate of secondaries by nearly three orders of magnitude. Such a significant error is also unreasonable on the basis that under such a high secondary production rate secondary craters would exceed NPF primaries by number at all diameters below 10 km.
A.2. Parameters That Influence Nonlinearity of Diffusion Rate
Parameters tested in this section affect both the magnitude of the diffusion rate and how the diffusion rate varies with slope. Varying these parameters causes the zero-slope diffusivity, κ0, to change, as well as the critical slope, Sc , and exponent, n.
A.2.1. Uplift Exponent
Positive crater topography is a combination of ejecta deposition and structural uplift of local materials. It is commonly assumed that uplift decays very rapidly (∝r−6), adding negligible positive elevation to the crater profile beyond approximately 1–2 radii from the rim (Melosh 1989; Xie et al. 2017). However, Sharpton (2014) argued that uplift plays a more important role in distal crater elevation construction and remains important out to greater radial distances. Here we consider the implications of a more gradual rapid uplift attenuation (∝r−3) on the ejecta thickness distribution in our model and the resulting nonlinear diffusion rate.
The uplift attenuation exponent suggested by Melosh (1989; ∝r−6) is used in the analysis presented in the main text (Equation (10)) and the nonlinear flux parameters reported in Sections 3.1 and 3.2. With this uplift profile, the critical slope, Sc
, is 4766 and the nonlinear exponent, n, is 1.89. Diffusivity increases by ∼40% between flat slopes and those near the angle of repose. With this degree of nonlinearity, a zero-slope diffusivity of 5.20 m2 Myr−1 reduces a 1 km crater to the same depth as the linear Fassett & Thomson (2014) value (5.5 m2 Myr−1).
Altering the uplift elevation profile to fall off as r−3 changes the 2D distribution of ejecta around each crater. Since uplift now decays more rapidly with increasing distance, ejecta thickness increases toward the edge of the continuous ejecta blanket compared to the r−3 case. This directly affects how ejecta is distributed along slopes by asymmetric ejecta blankets, leading to changes in the nonlinear downslope flux of regolith. The critical slope decreases to 4304, and the nonlinear exponent, n, decreases to 1.45. Diffusivity now roughly doubles from flat surfaces to the angle of repose.
A.2.2. Uplift Height
The crater profile in our model is designed such that uplift and ejecta thicknesses are equivalent at the crater rim. Total rim heights have been measured for a population of simple lunar craters (Stopar et al. 2017), but the relative contribution of ejecta and uplift is not well constrained. Sharpton (2014) argued that uplift constitutes as much as 75% of the total rim height. Here we vary the thickness of the uplift at the final crater rim (maximum uplift occurs at the transient crater rim before the crater collapse stage) from 0% (no uplift) to 75% of the total rim height, hr . As in the previous section, varying this parameter changes the 2D ejecta thickness distribution of craters on slopes and alters the form of the nonlinear regolith flux (Table 3).
Table 3. The Nonlinear Flux Parameters, Sc and n, Vary with the Choice of Maximum Uplift Height
| Maximum Uplift Height | Sc | n |
|---|---|---|
| 0hr | 5598 | 3.60 |
| 0.5hr | 5003 | 2.04 |
| 0.925hr | 4766 | 1.89 |
| 1.5hr | 4621 | 1.77 |
Download table as: ASCIITypeset image
When no uplift is considered (all positive topography is ejecta), regolith flux approaches the linear approximation, with zero-slope diffusivity increasing by ∼4% from flat slopes to those near the angle of repose. As the maximum uplift increases to being comparable to the final rim height, regolith flux becomes more nonlinear and the diffusion rate more than doubles between nearly flat surfaces and slopes near the angle of repose. Increasing the proportion of uplift at the crater rim decreases the total volume of ejecta, so varying this parameter will influence not only Sc and n but also the zero-slope diffusivity. However, this effect is relatively minor, and regardless of the precise maximum uplift height, there will be a value of Dmin for which the zero-slope diffusivity matches the observed maria diffusion rate.
A.2.3. Continuous Ejecta Blanket Radius
The radius of the continuous ejecta blanket, rej = η
R, is chosen to be η = 5 in our model (Table 1). On flat slopes the ejecta blanket is circular with this radius, and on sloped surfaces the ejecta blanket can be shorter or longer than this based on the ballistic transport equations (Section 2.2). The parameter η is related to the ejection velocity of ejecta particles since on flat surfaces all particles ejected with velocity vej (Equation (5)) will land at a radial distance of ηR. Changing this parameter therefore affects how far ejecta travels from the crater center and, crucially, how ejecta is distributed along sloped surfaces. For η < 5, ejecta is more tightly concentrated around the crater rim and craters are less efficient at transporting material downslope. If η is halved to 2.5, the zero-slope diffusivity decreases to ∼78% of the η = 5 value. The nonlinear flux parameters also change slightly to Sc
= 4239 and n = 1.44. If η is doubled to 10, the zero-slope diffusivity would be ∼20% higher than the η = 5 value and the critical slope and nonlinear exponent would increase to Sc
= 5807 and n = 2.58.
Appendix B: Secondary Flux
Our Monte Carlo model for secondary production conclusively demonstrates that if all primaries generate secondary fields with the same SFD slope, the global secondary SFD will have the same slope, independent of the form of the primary SFD.
Under the combination of NPF primaries (Neukum et al. 2001) and the secondary production model of O'Brien & Byrne (2021), the secondary SFD is steeper than the primary SFD at small sizes and secondaries outnumber primaries below diameters of about 12 m. Despite the high-order polynomial representing the NPF, the secondary SFD has a constant slope of 4 owing to the assumptions used in our secondary cratering model, which are described in Section 2.6.
If the flux of primaries under the NPF is scaled upward, the secondary SFD coefficient also increases. Because the NPF is not a single power law, the enhancement in secondaries is not necessarily equivalent to the enhancement in primaries. For example, scaling the NPF by an order of magnitude increases the secondary SFD coefficient As by a factor of ∼16, and the crossover diameter where secondaries exceed primaries increases to ∼18 m. This scaling has no effect on the secondary SFD slope, which remains at λs = 4 regardless of the constant scaling factor.
The addition of a steep slope in the primary SFD, as evidenced by LRO observations, challenges the long-standing assumption that secondaries exceed primaries at small sizes. First, the best-fit slope from LRO fresh craters is 4.65, significantly steeper than the canonical secondary slope of 4. Second, the steep slope occurs below crater diameters of 20 m (down to the size where LRO NAC observations are thought to be complete at ∼10 m). Unless the crossover diameter, where secondaries begin to exceed primaries, is greater than 20 m, primaries will exceed secondaries at all diameters larger than ∼10 m. We do not rule out the possibility that the steep primary branch rolls over to a shallower slope at smaller diameters (meter scale or below), in which case secondaries could still outnumber primaries at the smallest sizes. However, there are no observational constraints on either the primary or secondary production rate at the submeter scale. The available evidence indicates that the SFD of lunar primaries becomes very steep at diameters of less than 20 m (steeper than the typically assumed secondary SFD slope).
For the purposes of our model, the steep LRO primary branch has no effect on the secondary production rate. This is because only craters smaller than 20 m appear to be enhanced relative to the NPF. To eject secondary-forming fragments, craters must be sufficiently large to excavate through the current regolith layer and into coherent bedrock. On the present-day maria, regolith thickness averages ∼5 m. Assuming an excavation depth of Dexc = D/10, only craters larger than 50 m will eject coherent blocks and generate bowl-shaped secondary craters. Therefore, changes to the primary SFD at diameters of less than 50 m will have no effect on secondary production since primaries in that size range produce no secondaries.
With the combined NPF and LRO SFD, scaling the number of primary craters by a constant factor once again has no effect on the secondary SFD slope. This further demonstrates the robustness of our assumption regarding the population of secondaries generated by a given primary crater. Even if the global primary SFD is represented by an 11th-order polynomial combined with a steep power law at small diameters, we find that the slope of the global secondary flux is identical to the slope of the SFD of individual secondary fields (if that is constant for all secondary fields, regardless of primary diameter; O'Brien & Byrne 2021). This result holds true regardless of the slope of the primary crater SFD or how it varies with crater diameter.