


Abstract
We use a novel approach to model the entire cratering process resulting from impacts on small, weak asteroids that uses shock physics code calculations directly. We found that small-scale impacts (with a projectile size less than 1/150 of the target size) can significantly deform weak asteroids, causing global resurfacing at the same time. As a result, the collisional lifetime of the overall asteroid shapes is significantly lower than the traditionally used lifetime based on catastrophic disruption events. We also show that even very low asteroid cohesions can drastically influence the outcome of an impact. Consequently, if the target is homogeneous and weaker than ≈10 Pa, then NASA's Double Asteroid Redirection Test impact on Dimorphos may not lead to a cratering event, as originally anticipated. Rather, the impact may change the global morphology of the asteroid. Our results, together with future observations by the ESA's Hera mission, will provide constraints regarding the evolution of the shapes and structures of small asteroids by subcatastrophic impacts.
Export citation and abstract BibTeX RIS

Original content from this work may be used under the terms of the Creative Commons Attribution 4.0 licence. Any further distribution of this work must maintain attribution to the author(s) and the title of the work, journal citation and DOI.
1. Introduction
The fraction of the asteroid population that has survived since the formation of the solar system has experienced numerous collisional, dynamical, and thermal events that have shaped their structures and orbital properties.
NASA's Double Asteroid Redirection Test (DART) impact (Cheng et al. 2018; Rivkin et al. 2021) on asteroid Dimorphos, the secondary of the Didymos asteroid system, is an ideal study case because it may take place in the subcatastrophic collision regime, a regime between cratering and catastrophic collisions (e.g., Jutzi 2019) that has been largely unexplored so far. The main goal of the DART mission is to alter Dimorphos's orbital period around the primary by an amount measurable from Earth (Cheng et al. 2018). A successful deflection of Dimorphos will demonstrate the capabilities of a kinetic impact as an asteroid mitigation strategy. The ESA's Hera mission (Michel et al. 2018) will arrive at Dimorphos about 4 yr after the DART impact and will perform a detailed characterization of Dimorphos and the DART impact outcome. With the help of the Hera mission, we will be able to assess the impact consequences and make testable predictions. Past studies of the outcome of a kinetic impactor on asteroid surfaces (e.g., Housen & Holsapple 2011; Holsapple & Housen 2012; Jutzi & Michel 2014; Stickle et al. 2015; Bruck Syal et al. 2016; Raducan et al. 2019, 2020, 2022a) have shown that the amount by which an asteroid can be deflected strongly depends on its surface, subsurface, and internal properties. Raducan et al. (2020) showed that in order to validate the predictive capabilities of our numerical models and understand and reproduce the asteroid deflection technique, we need a measure of both the impact deflection efficiency (often referred to in terms of a value β, where β is the ratio of the momentum of the impactor to the recoil momentum of the target; Rivkin et al. 2021) and the crater size and morphology.
Asteroids smaller than about 50 km in diameter are the result of the breakup of a larger parent body (Bottke et al. 2005). They are often considered to be rubble-pile objects, aggregates held together only by self-gravity or small cohesive forces (Richardson et al. 2002, this focus issue; Scheeres et al. 2010). Recently, the artificial impact experiment of JAXA's Hayabusa2 mission on the surface of asteroid Ryugu (Arakawa et al. 2020) created a crater that was about 14 m in diameter. This unexpectedly large crater suggests that at least the near surface of the asteroid is controlled to a large extent by its weak gravity, rather than strength, as discussed in Arakawa et al. (2020). The crater scaling for granular targets predicts that a crater of this size would require a surface cohesion of less than 1 Pa (Arakawa et al. 2020; Jutzi et al. 2022).
These findings might also be applicable to the DART impact, and it is possible that Dimorphos is also a rubble pile (see Section 2.3). Studies by Jutzi & Benz (2017) suggest that for a low-cohesion target, an impact of the same magnitude as DART might have a large enough specific impact energy to cause global deformation of the target. Due to the inability to recreate these impact conditions in laboratory experiments, this observed regime of low-gravity, low-strength impacts has remained largely unexplored so far. In addition, the very large timescales involved in the crater growth (more than a few hours in the case of DART) made it impossible to numerically simulate these impact processes up to now. Studying this yet to be understood cratering regime is not only important in the context of deflecting future threatening asteroids, it is also crucial for determining the lifetime of the overall asteroid shapes and surface ages.
Here we use a novel approach to model the entire cratering process resulting from impacts on small, weak asteroids that uses shock physics code calculations directly. We use the DART mission as a motivating case study and considered relatively small impacts (≈500 kg) on spherical and ellipsoidal Dimorphos-sized targets. We study the sensitivity of the impact outcome, specifically the amount and characteristics of ejecta produced and the target deformation and resulting final shape, to target strength properties, impact angle, and target geometry.
2. Numerical Methods
2.1. Shock Physics Code Model
In this work, we use Bern's parallel smoothed particle hydrodynamics (SPH) impact code (Benz & Asphaug 1995; Jutzi et al. 2008; Jutzi 2015), a shock physics code that includes material models suitable to simulate the behavior of geological materials, various equations of state (EoSs), and a porosity compaction model (P − α). This study was motivated by the DART impact on Dimorphos; therefore, here we simulate DART-like impacts on small, Dimorphos-like targets (Naidu et al. 2020). Recent studies (e.g., Owen et al. 2022, this focus issue; Raducan et al. 2022b) showed that a low-density spherical projectile is a reasonable approximation for a DART-like impact. Therefore, in all simulations, we modeled the projectile as a low-density (ρ = 1000 kg m−3), ≈500 kg aluminum sphere at 6 km s−1.
The target was simulated using the Tillotson EoS for basalt (Benz & Asphaug 1999) with a modified initial bulk modulus (see next section). The Tillotson EoS is suitable for the impact scenarios investigated here, as only a very small proportion of the target material experiences peak shock pressures higher than the incipient or complete melting pressure (Raducan et al. 2022b).
The target material response to shear deformation was described by a simple pressure-dependent strength model (Lundborg 1967; Collins et al. 2004), which asymptotes to a certain strength at high pressures. The Lundborg (LUND) strength model defines the yield strength as

where P is the pressure, f is the coefficient of internal friction, Ydm
is the limiting strength at high pressure, and Y0 is the cohesion. For the weak asteroid materials considered in this study, we use a constant cohesion, Y0, with a strain-based weakening model that prevents artificial clumping (similar to the approach used in Collins et al. 2008; however, the most appropriate form for this relationship is still under investigation). Our model uses a linear relation between cohesion and total strain ( tot), and it is assumed that for tot ≥ 1, cohesion is lost. The tensile strength is defined by extrapolating the yield strength (versus pressure) curve (Equation (1)) to intersect the pressure axis. Additionally, we limit the maximum negative pressure to
  .
.
The initial target porosity was kept constant at 40% and modeled using the P − α model (Jutzi et al. 2008) with a simple quadratic crush curve defined by the solid pressure, Ps = 10 MPa; elastic pressure, Pe = 0.1 MPa; transition pressure, Pt = 10 MPa; transition distension, αt = 1; exponents n1 = 2 and n2 = 2; and initial distension, α0 = 1.67. The full description of the P − α model implemented in the Bern SPH code is given by Jutzi et al. (2008). The relevant material parameters used in this study are summarized in Table 1. The models used self-gravity, which was recalculated every few time steps.
Table 1. Material Model Parameters for Impact Simulations into Dimorphos Analogs
| Description | Impactor | Spherical Target | Oblate Ellipsoid | Prolate Ellipsoid |
|---|---|---|---|---|
| Semimajor axis, a (m) | 0.50/0.62/0.78 | 75 | 86 | 100 |
| Semiminor axis, b (m) | 0.50/0.62/0.78 | 75 | 56 | 65 |
| Material | Aluminum | Basalt | Basalt | Basalt |
| Impact angle (deg) | 90/45 | ⋯ | ⋯ | ⋯ |
| Impact speed (km s−1) | 3/6/9 | ⋯ | ⋯ | ⋯ |
| EoS | Tillotson a | Tillotson b | Tillotson b | Tillotson b |
| Strength model | von Mises | LUND | LUND | LUND |
| LUND strength parameters c | ||||
| Damage strength at zero pressure, Y0 (Pa) | ⋯ | 0/1/10/50 | 0 | 0 |
Strength at infinite pressure,  Ydm
(GPa)
Ydm
(GPa) | ⋯ | 1 | 1 | 1 |
| Internal friction coefficient (damaged), f | ⋯ | 0.4/0.6/0.8/1.0 | 0.6 | 0.6 |
| Porosity model parameters (P − α) d | ||||
| Initial porosity, ϕ0 | ⋯ | 40% | 40% | 40% |
| Initial distension, α0 | ⋯ | 1.67 | 1.67 | 1.67 |
Notes.
a Tillotson (1962). b Benz & Asphaug (1999). c Lundborg (1967). d Jutzi et al. (2008).Download table as: ASCIITypeset image
2.2. Modeling Approach for the Late-stage Evolution
Due to the very long formation times of craters in the gravity regime on small, ∼100–1000 m, asteroids (Arakawa et al. 2020), so far it has not been feasible for shock physics codes to model the entire cratering process. To ensure numerical stability in shock physics codes, the maximum simulation time step, dt, is limited by the Courant criteria (e.g., Anderson 1987), which for DART-scale impact simulations on Dimorphos-like bodies means that the maximum time step must be dt < resolution/cs ≃ 10−4 s, where cs is the sound speed in the target. On the other hand, the crater formation and ejecta reaccumulation time in the gravity regime can last up to a few hours.
To model the entire process with SPH, we switch to a so-called "fast time integration scheme" by applying a transition to a low-speed medium in the shock physics code calculation. After the initial shock has passed, the late-stage evolution is governed by low-velocity granular flow, which can be accurately modeled using a low bulk sound speed material (i.e., a material with a small cs , allowing for a large dt). A low bulk sound speed material has been previously used to study low-velocity collisions among small bodies (Jutzi & Asphaug 2015). As discussed in Jutzi & Asphaug (2015), this approach is suitable as long as the involved velocities are small compared to the sound speed of the media, cs . However, in high-velocity impact simulations, such as the ones considered here, the involved velocities are much larger than the sound speed of the media. Therefore, in order to model the entire process of the gravity-dominated impacts studied here, the initial phase of the impact has to be modeled using a realistic sound speed, cs , using the nominal material parameters summarized in Table 1. A full description of the Bern SPH fast time integration scheme is given by Jutzi et al. (2022).
We switch to the fast time integration scheme at a time ttransition. In this step, we apply a simplified Tillotson EoS, in which all energy-related terms are set to zero. The remaining leading term of the EoS is governed by the bulk modulus P = A(1 − ρ/ρ0), which also determines the magnitude of the sound speed. We use A ≈ 0.1 MPa and also reduce the shear modulus proportionally. This approach has been validated against laboratory experiments into homogeneous and heterogeneous targets (Ormö et al. 2021) and the results of the artificial impact experiment of JAXA's Hayabusa2 mission on the surface of asteroid Ryugu (Jutzi et al. 2022).
In this study, we only applied the fast integration scheme described above to model the late evolution of the very low cohesion (Y0 < 1 Pa) targets. The transition time was ttransition ≈ 30 minutes, which was proven to be a good compromise between reasonable running times and accuracy. Parameter studies have shown that the transition to the fast integration scheme does not affect the overall morphology of the target postimpact. In Figure 1, we compare the cumulative target mass that experienced a total strain larger than a certain total strain, tot (see Section 2.6 for details), at t ≈ 1 hr after the impact, from a run in which the fast integration scheme was not used (no transition), to the results from a run in which the fast integration scheme was used (transition) at ttransition ≈ 30 minutes. The time at which we compare the simulation data (1 hr) was chosen as the maximum time to which the simulation without the transition could feasibly run. The target in which the fast integration scheme was not used experiences slightly lower total strains compared to the target scenario that used the fast scheme. However, the difference in the cumulative target mass (M(>tot)/Mt
) between the two runs is less than a few percent. To further illustrate the usefulness of the fast time integration scheme, we remark that the simulation in which the transition scheme was used took about half the time to run, compared to the simulation that did not use the transition.

Figure 1. Cumulative target mass that experienced a total strain larger than a certain tot, normalized by the initial target mass. We compare the results from a run in which the fast integration scheme was not used (no transition) to the results from a run in which the fast scheme was used (transition). The data were analyzed at ≈1 hr after the impact.
Download figure:
Standard image High-resolution image2.3. Target Setup
Small asteroids in the solar system are numerous and very diverse in terms of their size, shape, and structure. Moreover, their material properties, such as cohesion, porosity, and internal friction coefficient, can vary significantly from one body to another. Therefore, there are a large number of combinations of target parameters that can be studied. Recent space missions to small, sub–10 km sized asteroids (e.g., Lauretta et al. 2019; Walsh et al. 2019; Arakawa et al. 2020) revealed asteroid surfaces that were extensively covered by boulders and regolith; however, the interior structure of these bodies has never been directly measured.
Since one of the main applications of our study is the outcome of the DART impact on Dimorphos, we focused on several initial target scenarios relevant for DART. First, we need to make reasonable assumptions about the surface and interior properties of the asteroid. Given that Didymos is a binary asteroid system, theories about the formation mechanisms of binary systems can help us constrain Dimorphos's internal structure and some of the target properties (Zhang et al. 2021). Formation mechanisms proposed for the Didymos system include (1) binary system formation during reaccumulation of collisional fragments (e.g., Michel et al. 2020), (2) Dimorphos formed by mass shedding from the primary (e.g., Walsh et al. 2008), (3) Dimorphos formed by regional fission of the primary (e.g., Sánchez & Scheeres 2016), and (4) Dimorphos formed by fission of large boulders from the Didymos progenitor surface (Zhang et al. 2021).
The first three formation scenarios lead to a rubble-pile structure for Dimorphos and surface mechanical properties (e.g., cohesion, friction) that depend on the size distribution of the accreted material. Recent studies showed that due to its rapid spin rate, if Didymos were a rubble pile, the critical cohesive strength to maintain its structural stability would be on the order of 10 Pa (assuming a nominal porosity of ≈20%; e.g., Zhang et al. 2021). If Dimorphos has similar regolith properties as Didymos, then it is expected that the cohesion on Dimorphos is also on the order of ≈10 Pa. However, Dimorphos may have a different size distribution of grains compared to Didymos, which may result in an even lower cohesion (similar to the surface of asteroid Ryugu; Arakawa et al. 2020). For comparison, Apollo samples of lunar regolith were measured to have cohesions between 0.1 and a few kPa (Mitchell 1974; Wilcox et al. 2005) due to the presence of microsized dust grains. On the other hand, results from the Philae lander on the comet 67P suggest that the compressive strength of the comet surface material is less than 12 Pa (O'Rourke et al. 2020).
In the last formation scenario, Dimorphos would likely have a monolithic structure and strength-dominated target properties; however, this scenario is less likely than the first three cases. In this study, we consider asteroid Ryugu's surface material as the best available analog for Dimorphos and explore cohesion values in the range of 0–50 Pa.
Besides dictating the target cohesion, the grain-size distribution on Dimorphos can also influence the cratering outcome and the momentum transfer efficiency (e.g., Tatsumi & Sugita 2018). For example, impacts into heterogeneities (i.e., boulders) larger than the projectile size can result in reduced cratering efficiencies compared to a homogeneous target with similar bulk properties (Tatsumi & Sugita 2018). However, for the purpose of this study, we only consider homogeneous targets. Studies that are currently ongoing (e.g., Ormö et al. 2021) will investigate the influence of heterogeneities on the outcome of the DART impact.
To explore some of the asteroid structure scenarios described above, in our SPH simulations, we consider that the internal structure of the asteroid is homogeneous and include microporosity (as described in Jutzi et al. 2008, 2010). We simulate three different target scenarios with varying target cohesion and internal friction coefficients, described as follows.
For spherical targets with radius a = 75 m (Figure 2(a)), we performed several sets of simulations: vertical impacts into spherical targets for which we systematically vary the cohesion, Y0, between 0 and 50 Pa and the coefficient of internal friction, f, between 0.4 and 1.0; and oblique, 45° impacts into spherical targets with varying Y0 between 0 and 50 Pa and fixed f = 0.6.

Figure 2. Schematic representation of the target shapes used in this study: (a) sphere, (b) oblate ellipsoid, and (c) prolate ellipsoid. The arrows indicate the location of the vertical (90°) and oblique (45°) impacts, and the crosses mark the impact points.
Download figure:
Standard image High-resolution imageFor a subset of the parameters used in the spherical target scenarios (Y0 = 0 Pa and f = 0.6), we simulated vertical (90°) and oblique (45°) impacts into oblate ellipsoidal targets (Figure 2(b)), with semimajor axis a = c = 86 m and semiminor axis b = 56 m, and prolate ellipsoidal targets (Figure 2(c)), with a = 100 m and b = c = 65 m. The initial target mass of the oblate and prolate ellipsoids was approximately the same as the mass of the spherical targets. The target and projectile setups are summarized in Table 1.
2.4. Resolution
In order to be able to numerically model the very long timescales required to see the impact effects, the SPH simulations presented here had a limited spatial resolution of 5 × 10⁵ SPH particles. Due to the low resolution employed here, the very fast (v/U ≳ 10−2) ejecta is underresolved, which causes a dip in the ejecta mass–velocity distribution (e.g., Figure 3). Resolution tests where we compared impacts into Y0 = 50 Pa, f = 0.6 spherical targets resolved with 5 × 10⁵, 1 × 10⁶, and 2 × 10⁶ SPH particles showed that the lower-resolution runs overestimate the amount of ejected mass at high velocities, M(v/U > 10−3), by about 15% (Figure 3(a)). The total ejected mass, ∑mej, was overestimated by about 6% in the low-resolution test case (5 × 10⁵ particles) compared to the high-resolution test case (2 × 10⁶ particles). At the same time, in the lower-resolution scenario, the cumulative target mass that experienced strains by up to tot ≲ 10−2 was overestimated by about 20% compared to the high-resolution case. However, the target mass that experienced strains higher than tot ≳ 10−2 was within 2% of the results obtained in the high-resolution target scenario (Figure 3(b)).
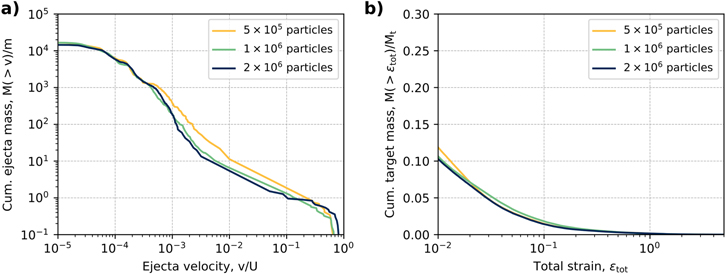
Figure 3. Resolution tests from an impact into spherical targets (Y0 = 50 Pa, f = 0.6), resolved with 5 × 10⁵, 1 × 10⁶, and 2 × 10⁶ SPH particles. (a) Normalized ejected mass at speeds greater than v, as a function of normalized ejection speed, v/U. (b) Cumulative target mass that experienced a total strain larger than a certain tot, normalized by the initial target mass, Mt
. The data were analyzed at t = 50 s after the impact.
Download figure:
Standard image High-resolution image2.5. Interior Overburden Pressure
For spherical bodies of radius R and density ρ, the overburden pressure, P, at a given radius (r < R) from the asteroid center is given by

where G is the gravitational constant. For a spherical asteroid of radius R = 75 m and density ρ ≈ 1.6 g cc−3, the central pressure of the body is Pc ≈ 2 Pa. This means that for such bodies, the transition from strength- to gravity-dominated cratering regimes occurs at strengths ≲2 Pa.
2.6. Quantitative Measure of Impact-induced Shape Deformation
In this study, we compute the postimpact total strain, tot, by integrating the second invariant of the strain-rate tensor for each SPH particle at the final simulated time step. We use this measure of total strain, together with the velocity changes experienced by each SPH particle, to distinguish between target material that experienced moderate to large deformation (tot > 0.2) and target material that was less deformed (tot < 0.2). Here we consider that initially, before the impact, the entire target had tot = 0.
2.7. Momentum Enhancement Calculations
One of the main aims of the DART mission is to prove the controlled deflection of Didymos's secondary, Dimorphos. In a high-velocity impact event, the change in momentum of the asteroid, Δ P , can be amplified by the momentum of the impact ejecta that escapes the gravitational attraction of the target body. In a vertical impact, the change in linear momentum of the asteroid as a result of the impact, Δ P , is therefore equal to the impactor momentum, m U , plus the resultant momentum of the escaping ejecta, p ej. The DART mission will determine the change in the orbital velocity of Dimorphos from the change of its orbital period around the primary, which is directly measured from ground-based observations (Rivkin et al. 2021). The total momentum change of the asteroid in the direction perpendicular to the asteroid's surface at the point of impact, ΔPz , divided by the vertical component of the impactor momentum is a measure of deflection efficiency, commonly defined as β = ΔPz /(mU) (Holsapple & Housen 2012). The full equation needed to determine the momentum multiplication factor, β, from observations is derived in Rivkin et al. (2021). For a vertical impact, the equation can be simplified to

The value of β depends on both the target material properties and the impact conditions (e.g., Jutzi & Michel 2014; Stickle et al. 2015; Bruck Syal et al. 2016; Raducan et al. 2019, 2020). Here β ≈ 1 implies that the crater ejecta makes a negligible contribution to the total momentum change, while β > 2 means that the momentum contribution from the crater ejecta is larger than the momentum imparted by the impactor directly.
There are two ways of determining β from impact simulations. To check for consistency within our models, here we carried out both analyses to determine β. The first method follows the approach used in Jutzi & Michel (2014): β is calculated from summing over all SPH particles with ejection velocities larger than the escape velocity of the target. For a given vertical impact, the ejecta momentum is given by

where me and vz are the mass and vertical velocity of the individual SPH particles, respectively. In the impact simulations presented here, we were able to track the impact ejecta and perform the β calculation after long times (up to 2 hr after the impact). Therefore, the pej(z) calculation considers the gravitational influence of the target. In this study, the gravitational influence of Didymos, the main of the double asteroid system, was not considered. However, we do not expect the primary to significantly affect the early phase of the impact process (the Hill sphere of Dimorphos is about twice its radius). The dynamical evolution of the ejecta is studied in a companion paper (Ferrari et al. 2022, this focus issue).
The second method, described in Bruck Syal et al. (2016), tracks the velocity of the asteroid center of mass postimpact by summing the momentum of all material that remains below the escape velocity after the reaccumulation of the ejecta. The absolute difference in β resulting from the two calculation methods is used toward the error calculation of β.
In an ideal scenario, DART would impact Dimorphos's surface vertically, in the direction of its orbital velocity. In an oblique impact, due to the asymmetric distribution of the crater ejecta, the change in momentum is not colinear with the impactor momentum. If the DART impact occurs at a nonvertical impact angle, then knowledge about the vector between the surface normal direction and the ejecta momentum vector,
, a quantity that will not be determined from the observations, is needed to constrain β (see Rivkin et al. 2021). The
can be determined from numerical simulations.
2.8. Ejecta Scaling Relationships
The most widely used crater and ejecta scaling relationships are based on point-source assumptions (Holsapple & Schmidt 1987) and relate the outcome of an impact to the impact properties (e.g., impactor radius a, impactor density δ, and impact speed U) by a so-called coupling parameter, C ≈ a δν Uμ , where ν and μ are target material-specific exponents. The density scaling exponent is often assumed to be ν ≈ 0.4 (Schmidt 1980). The velocity scaling exponent, μ, is one of the main scaling constants needed to extrapolate lab-scale and numerical results to other regimes of applicability (e.g., Housen & Holsapple 2011; Prieur et al. 2017; Raducan et al. 2019). Here μ depends on the target material properties, and its value lies between two theoretical limits: μ = 1/3 if the crater formation is influenced by the impactor momentum alone and μ = 2/3 if it is influenced by the impactor energy alone (Holsapple & Schmidt 1987; Housen & Holsapple 2011).
The point-source scaling laws describe the mass–velocity distribution of crater ejecta by a power law with a slope of −3μ that breaks down near the crater rim (slow ejecta) and close to the impact point (fast ejecta; Housen & Holsapple 2011),

where m is the projectile mass, ρ is the target density, and C1 and k are material-specific, empirically derived constants.
3. Influence of the Target Properties and Impact Angle on the Postimpact Target Morphology
3.1. Influence of the Target Strength
We first investigated small impacts (m = 500 kg) into spherical targets. Two-dimensional slices through our three-dimensional impact simulations data (taken at y = 0 in the x–z plane), where we systematically varied the target cohesion and coefficient of internal friction, show the possible postimpact asteroid morphologies (Figure 4). The impact crater size increases moderately with a decreasing coefficient of internal friction and increases sharply with decreasing cohesion.
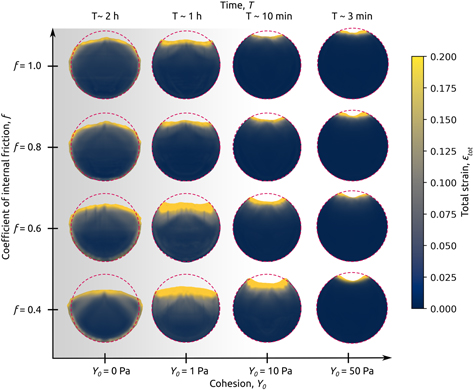
Figure 4. Two-dimensional slices (taken at y = 0 in the x–z plane) showing possible asteroid morphologies after DART-like impacts on initially 150 m spherical bodies with varying cohesion (Y0 = 0–50 Pa) and coefficients of internal friction (f = 0.4–1.0). Impacts into targets with Y0 larger than ≈10 Pa create well-defined craters, while impacts into targets with Y0 ≲ 10 Pa create the shape deformation of the asteroid. The total strain shows the amount of deformation experienced by the target. For a 150 m spherical asteroid (ρ ≈ 1600 kg m−3), the overburden pressure in the center of the body is about 2 Pa. The background gradient shows the transition to the gravity-dominated regime, where the target's overburden pressure at the cratering depth exceeds the cohesion. The formation times, T, of the postimpact stable structures are shown at the top of the figure.
Download figure:
Standard image High-resolution imageOur results show that even a small cohesion (≲10 Pa) can dramatically affect the outcome of an impact on a small body in terms of the postimpact target morphology. Regardless of our choice of target coefficient of internal friction, impacts into targets stronger than Y0 ≈ 10 Pa create well-defined bowl-shaped craters, while impacts into weaker targets create morphologies that are dissimilar to impact craters and cause the shape deformation of the target. As the ratio of the size of the crater to the curvature radius of the surface determines the postimpact morphology of the asteroid (Fujiwara et al. 1993), for these scenarios (Y0 ≲ 10 Pa), the curvature of the target also plays a major role.
A quantitative measure of the shape deformation experienced by an asteroid as a result of an impact event is given in terms of the total strain experienced by the target material. Figure 5 shows the cumulative target mass that experienced a total strain larger than a certain tot, normalized by the initial target mass, for spherical targets with varying cohesion, Y0 (Figure 5(a)) and spherical cohesionless targets with varying coefficients of internal friction, f (Figure 5(b)). For all impact scenarios shown, the total strain was computed 30 minutes after the impact. In the 0 Pa cases, the simulations ran until 2 hr after the impact (the time at which most of the slow, nonescaping ejecta has been reaccumulated onto the target). In the last 1.5 hr of the simulation runs, the total strain of the target mass increases by an additional ≈10%.
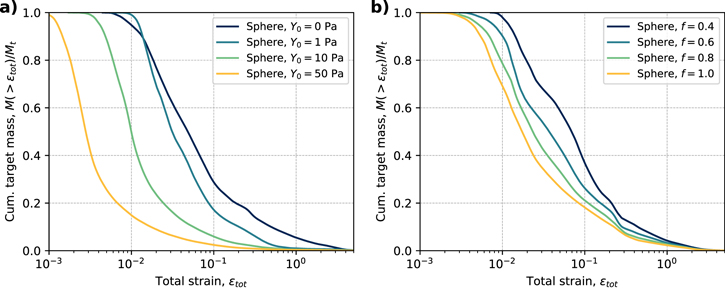
Figure 5. Cumulative target mass that experienced a total strain larger than a certain tot, normalized by the initial target mass, for spherical targets with (a) varying cohesion, Y0 (f = 0.6), and (b) a varying coefficient of internal friction, f (Y0 = 0 Pa), as recorded 30 minutes after the impact.
Download figure:
Standard image High-resolution imageThe amount of total strain experienced by the target material during an impact increases with decreasing cohesion (Figure 5(a)). For a spherical target with Y0 = 50 Pa and f = 0.6, less than 4% of the target mass experiences a total strain, tot, larger than 0.1. On the other hand, for a spherical target with Y0 = 1 Pa and f = 0.6, almost 20% of the target material has tot > 0.1, while for a cohesionless target (Y0 = 0 Pa), the amount of target material with tot > 0.1 is about 30%. For spherical cohesionless targets, the amount of total strain experienced by the target increases with a decreasing coefficient of internal friction. The amount of material that experiences tot > 0.1 increases from just under 20% for f = 1.0 to about 40% for f = 0.4 (Figure 5(b)).
3.2. Influence of the Impact Angle
The most likely impact angle on a spherical body is 45° (Shoemaker 1962). To generalize our findings, for a subset of impact conditions, we compare SPH simulation results of vertical impacts to oblique impacts into equivalent targets. Figure 6 shows target morphologies after vertical (90°) and oblique (45°) impacts into initially spherical targets, with fixed initial porosity (40%), a fixed coefficient of internal friction (f = 0.6), and varying cohesion (Y0 = 0, 1, 10, and 50 Pa).
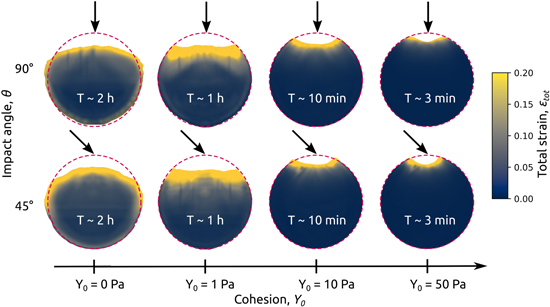
Figure 6. Target morphology after DART-like impacts on spherical targets at vertical (90°) and oblique (45°) angles. The black arrows indicate the direction of impact.
Download figure:
Standard image High-resolution imageFor a more quantitative comparison between the vertical and oblique impacts, we analyzed the postimpact target material strain. Figure 7 shows the cumulative target mass that experienced a total strain larger than a certain tot, normalized by the initial target mass, for 90° and 45° impacts into spherical targets of varying cohesion. For all impact scenarios shown in Figure 7, the total strain was computed 30 minutes after the impact. We can see that the target generally experiences less total strain from an oblique, 45°, impact compared to a vertical impact into an equivalent target. However, the difference in tot between impacts into the same target but at two different impact angles is only a few percent. Our results suggest that for the impact scenarios considered here, the impact angle has a negligible effect on the postimpact target morphology and the amount of target deformation.
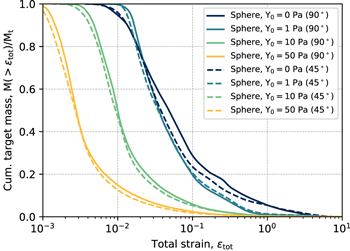
Figure 7. Cumulative target mass that experiences a total strain, tot, larger than a specific value, normalized by the total target mass, after vertical (90°) and oblique (45°) impacts, as computed 30 minutes after the impact.
Download figure:
Standard image High-resolution image3.3. Influence of the Target Geometry
Next, for a subset of the target parameters used in the spherical target scenarios (Y0 = 0 Pa and f = 0.6), we consider small impacts into oblate (86 × 86 × 56 m) and prolate (100 × 65 × 65 m) ellipsoid-shaped asteroids of similar masses.
Figure 8 shows the final target morphologies 2 hr after vertical and oblique impacts into spherical, oblate, and prolate ellipsoid-shaped, cohesionless asteroids. Compared to the spherical target scenario, where the impact angle has a minimal effect on the postimpact target morphology, in the elliptical target scenarios, due to the nonsymmetric target geometry, the location of the impact plays a major role in the postimpact target shape.
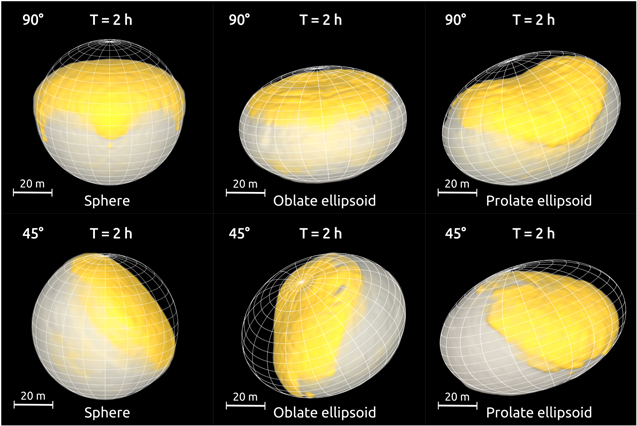
Figure 8. Asteroid target morphology after vertical (90°) and oblique (45°) impacts at T = 2 hr after the impact. Up to ≈20% of the target material is displaced, causing excavation of material from the asteroid interior, global deformation, and resurfacing. The color denotes the deformed (strain > 0.2) and displaced material. The white grid frame represents the initial geometry of the target. For better visualization of the impact effects, some of the targets have been rotated.
Download figure:
Standard image High-resolution imageIn the spherical impact scenarios, the target mass experiencing a specific strain varies by only by a few percent, depending on the impact angle. In the elliptical target scenarios, the impact angle has more influence on the amount of deformation. The most probable target geometry for Dimorphos is a prolate ellipsoid (Naidu et al. 2020), in which case the impact location becomes crucial for the postimpact global-scale deformation of the asteroid (Figure 9).

Figure 9. Cumulative target mass that experiences a total strain, tot, larger than a specific value, normalized by the total target mass, after vertical (90°) and oblique (45°) impacts on spherical and elliptical cohesionless targets.
Download figure:
Standard image High-resolution image4. Influence of the Target Properties and Impact Angle on the Impact Ejecta
4.1. Influence of Target Strength
In addition to the postimpact target morphology, from our numerical simulations, we can also quantify the mass–velocity distribution of the ejected material. Figure 10(a) shows the normalized ejected mass at speeds greater than M(>v)/m as a function of normalized ejection speed, v/U, for impacts into spherical targets with a fixed coefficient of internal friction (f = 0.6) and varying cohesion (Y0, between 0 and 50 Pa). For the cohesive (Y0 ≳ 1 Pa) small asteroids simulated here, the target cohesion is the dominant force that stops the crater cavity from growing. Therefore, with decreasing target cohesion, more material is displaced and ejected above the escape speed of the target. We find that an impact into a 50 Pa target (f = 0.6) ejects ≈1.9 × 10⁴ × m of target mass (where m is the projectile mass), while an impact into a cohesionless, 0 Pa target with the same coefficient of internal friction ejects almost 10 times more target mass (≈1.4 × 10⁵ × m).

Figure 10. Normalized ejected mass at speeds greater than v as a function of normalized ejection speed, v/U, for (a) impacts into targets with fixed f = 0.6 and varying Y0 between 0 and 50 Pa and (b) impacts into cohesionless targets (Y0 = 0) and varying f between 0.4 and 1.0. The slope of μ = 0.38 is plotted for comparison. The shaded area in panels (a) and (b) shows the power-law regime of the ejecta mass–velocity distribution (e.g., Housen & Holsapple 2011; Raducan et al. 2019). Panels (c) and (d) show the cumulative ejected momentum as a function of normalized vertical ejection velocity.
Download figure:
Standard image High-resolution imageFigure 10(b) shows the normalized ejected mass at speeds greater than M(>v)/m as a function of normalized ejection speed, v/U, for impacts into cohesionless, spherical targets (Y0 = 0) and varying f between 0.4 and 1.0. With an increasing coefficient of internal friction, more energy is needed to deform the target. Therefore, targets with higher f (and fixed cohesion) experience less total strain and have lower cratering efficiencies compared to targets with lower f, which results in less ejected target material. An impact into a cohesionless target with f = 0.4 ejects ≈2.5 × 10⁵ × m target mass, while an impact into a cohesionless target with f = 1.0 ejects ≈6.3 × 10⁵ × m target mass, where m is the projectile mass.
Figures 10(c) and (d) show the cumulative ejecta momentum in the vertical direction normalized by the impactor momentum, mU, as a function of ejecta velocity in the vertical (z) direction. The maximum cumulative ejecta momentum value is equivalent to β − 1. Our results show that β − 1 increases with both decreasing cohesion and a decreasing coefficient of internal friction, which is in agreement with results from previous studies (e.g., Raducan et al. 2019).
4.2. Influence of Target Geometry
Figure 11(a) shows the normalized ejected mass at speeds greater than v as a function of normalized ejection speed, v/U, for three cohesionless (Y0 = 0) target shapes: spheroid, oblate ellipsoid, and prolate ellipsoid. Figure 11(b) shows the cumulative ejected momentum as a function of normalized vertical ejection velocity for the same impact scenarios. We find that the asteroid shape does not influence the amount of mass that is ejected above the escape speed of the target (Figure 12(a)). However, the target geometry causes a clear amplification in the amount of displaced target mass and the momentum transfer efficiency. Besides the difference in the gravitational acceleration on the body surface between the ellipsoidal and spherical targets, the β amplification is also given by the target slope with respect to the target normal, which influences the ejection angle at launch position (β is calculated only from the vertical component of the escaping ejecta).
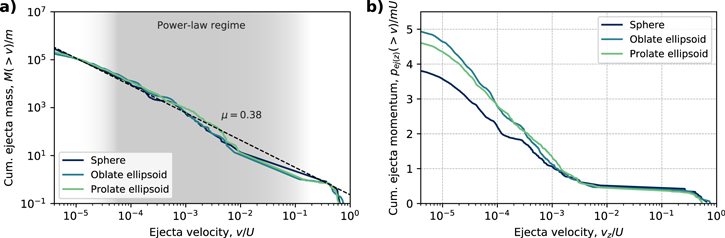
Figure 11. (a) Normalized ejected mass at speeds greater than v as a function of normalized ejection speed, v/U, for three cohesionless (Y0 = 0) target shapes: spheroid, oblate ellipsoid, and prolate ellipsoid. The slope of μ = 0.38 is plotted for comparison. (b) Cumulative ejected momentum as a function of normalized vertical ejection velocity.
Download figure:
Standard image High-resolution image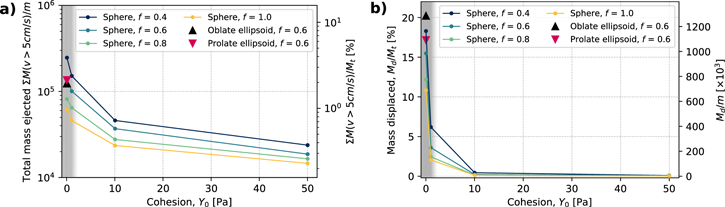
Figure 12. Asteroid mass ejected and displaced on the target. (a) Total ejected mass at velocities above 5 cm s−1 (≈vesc), normalized by the projectile mass, m (left), and initial target mass, Mt , in % (right). (b) Total target mass below escape velocity that is displaced on the target, normalized by the initial target mass, Mt (left), and projectile mass, m (right). The shaded area denotes the transition to the gravity-dominated cratering regime.
Download figure:
Standard image High-resolution image4.3. Very Weak Asteroids Retain Large Amounts of Slow Ejecta
Impacts into very low cohesion asteroids produce a large amount of ejecta. However, a relatively large fraction of the target material does not escape the target (e.g., Housen & Holsapple 2011). Instead, there is significant material redistribution, leading to a change of the overall shape of the asteroid. In Figure 12(a), we show the total mass of ejecta with velocities higher than 5 cm s−1 (≈vesc; Ferrari & Lavagna 2016) from impacts into targets with varying Y0 and f. Similar to the postimpact target shape, the target cohesion is the key parameter that influences the amount of mass thrown out of the growing crater cavity. While an impact on an asteroid with 50 Pa surface cohesion would produce 2 × 10⁴ × m ejecta (where m is the impactor mass), an impact into a cohesionless target (Y0 = 0 Pa) ejects up to 10 times more mass (see Figure 10).
We use the calculated total strain, together with the velocity change experienced by each SPH particle, to distinguish between target material that escapes the asteroid's gravitational field, material that is deformed and displaced on the target, and material that does not experience large deformation. In Figure 12(b), we plot the amount of ejected target mass that is displaced on the asteroid surface but does not escape the asteroid's gravitational field (v < vesc).
During impacts into asteroids with cohesions larger than about 10 Pa, most of the material is excavated from the crater with speeds larger than the escape velocity of the asteroid. The reason for this is that the ejected material is required to have a maximum speed exceeding that needed to overcome the cohesive strength of the target (Raducan et al. 2019). On the other hand, in impact scenarios where the asteroid cohesion is smaller than about 10 Pa, the amount of mass displaced on the asteroid is much larger than the amount of mass that escapes the body's gravity (Figures 12(a) and (b)). Therefore, on small, very weak asteroids, we expect to find larger amounts of regolith than on small asteroids with moderate cohesion (Housen et al. 1979).
4.4. Scaling Relationships for the Ejected Material from Small Impacts on Weak Targets
Generally, the mass–velocity distribution of ejecta that escapes the asteroid's gravitational field reproduces the power-law behavior predicted by point-source approximation (Housen et al. 1983). The slope of the power law is −3μ, where μ is commonly defined as the velocity scaling exponent (see Section 2.8; Housen & Holsapple 2011). However, the coupling parameter measure (Housen & Holsapple 2011) can only be adopted for vertical, high-velocity impacts into planar targets and when the impactor is relatively small compared to the target. For the large cratering efficiencies studied here, the final crater size is comparable to the target size, and the target curvature plays an important role in the mass–velocity of the late ejecta. Therefore, the classical crater and ejecta scaling laws are not applicable to the entire growth process of some of the impact scenarios simulated here. Nonetheless, in our impact simulations, we can derive the velocity scaling exponent, μ, from the impact ejecta that is released from the target in the so-called "power-law regime" before the curvature of the target becomes important. Here, to derive the velocity scaling exponent, μ, we fit a simple power law through the power-law regime of the ejecta distribution. This process has been described in detail in Raducan et al. (2019). The results are displayed in Table 2.
We find that while the target cohesion determines the total mass of the ejecta, it does not influence the power-law slope of the ejecta mass–velocity distribution. For a fixed coefficient of internal friction (f = 0.6), we obtained μ = 0.38. Increasing f causes a linear decrease in the power-law slope of the ejecta mass–velocity distribution, from μ = 0.39 for f = 0.4 to μ = 0.36 for f = 1.0. Similar results have been described in Raducan et al. (2019). The slight deviation of the ejecta mass–velocity distribution of the fast ejecta from the power law (Figures 10 and 11) is caused by the limited spatial resolution employed here.
4.5. The Offset Vector between Surface Normal Direction and Ejecta Velocity Vector after an Oblique Impact
In vertical impacts, the net momentum imparted to the target by the escaping ejecta can be assumed to act along the surface normal vector. Therefore, in vertical impacts, ∣
∣ ≈ 0 (see Rivkin et al. 2021 for details). However, in oblique impacts, the direction of the net ejected momentum is not normal to the surface, and the offset vector between the surface normal direction and ejecta velocity vector,  ) (see Section (2.7)), is of paramount importance when determining the impact-induced momentum enhancement, β, from Earth-based observations (Rivkin et al. 2021).
It was seen in previous studies (e.g., Raducan et al. 2022a) that the ejecta momentum vector tends to "straighten up" with crater growth; i.e., the ejecta velocity vector converges to the surface normal over time. The reason for this behavior of the ejecta momentum is that in oblique impacts, while the first ejecta to leave the crater is highly oblique (Schultz 1999), the late ejecta becomes more symmetric with crater growth. From our SPH numerical study of oblique, θ = 45° impacts on spherical targets, we confirm that the magnitude of the offset vector between surface normal direction and ejecta velocity vector, ∣
∣, decreases with decreasing target cohesion (Figure 13). This result means that for very high cratering efficiencies (lower cohesion targets), ∣
∣ has less influence on the β value calculated from ground-based observations.

Figure 13. (Left) Offset vector between surface normal direction and ejecta velocity vector, ∣
∣. Results from iSALE-3D simulations (Raducan et al. 2022a) are plotted for comparison. (Right) Schematic representation of the impact geometry in an oblique impact scenario, where  is the ejecta momentum vector (at infinity),
  is the surface normal vector, θ is the impact angle, and α is the angle between the surface normal and the ejecta velocity vector,
  . Adapted from Rivkin et al. (2021).
Download figure:
Standard image High-resolution image5. Critical Specific Energy for Asteroid Reshaping
The specific impact energy is defined as (Jutzi 2015)

where μr
= mMt
/(Mt
+ m) is the reduced mass. To determine the specific impact energy required to catastrophically disrupt the body,  , and reshape the asteroid, Qreshape, for a subset of target properties, we investigated additional impact scenarios. We explored impact consequences for spherical, oblate, and prolate ellipsoids, with Y0 = 0 Pa and f = 0.6. For each of these target scenarios, to vary the impact energy, we used a range of impactor sizes (a = 0.5–1 m) and impact velocities (U = 3–9 km s−1). The impactor material properties remained unchanged.
The catastrophic disruption threshold is defined as the specific impact energy required to disperse half of the target material mass. From our simulations of impacts into spherical targets at 3, 6, and 9 km s−1, we find  = 11.7 ± 2.1, 19.7 ± 2.4, and 27.9 ± 3.5 J kg−1, respectively. For impacts into oblate ellipsoidal targets, we find
  J kg−1 (3 km s−1) and ≈22.97 J kg−1 (6 km s−1), while for impacts into prolate ellipsoidal targets, we find
  = 14.15 J kg−1 (3 km s−1) and ≈22.52 J kg−1 (6 km s−1). These results are plotted in Figure 14.

Figure 14. Critical specific impact energies for catastrophic disruptions,  , and shape-changing collisions, Qreshape(20%), for cohesionless (Y0 = 0 Pa) spherical and ellipsoidal targets. The DART specific impact energy is QDART ≈ 3 ± 1 J kg−1, which is similar to the values of Qreshape(20%) in the spherical and ellipsoidal targets investigated.
Download figure:
Standard image High-resolution imageWe define the specific impact energy required to displace 20% of the target mass as Qreshape(20%). From our impacts into spherical targets, we find Qreshape(20%) = 2.22 ± 0.64 J kg−1 (3 km s−1), 4.25 ± 0.80 J kg−1 (6 km s−1), and 5.77 ± 1.50 J kg−1 (9 km s−1). For impacts into oblate ellipsoidal targets, we find Qreshape(20%) = 2.24 J kg−1 (3 km s−1) and 3.53 J kg−1 (6 km s−1), while for impacts into prolate ellipsoidal targets, we find Qreshape(20%) = 2.08 J kg−1 (3 km s−1) and 3.21 J kg−1 (6 km s−1). These values are plotted in Figure 14(a). Due to the limited number of impact simulations into ellipsoidal targets, a Qreshape(20%) error estimation was not possible.
In the gravity regime (i.e., when the gravitational force of the target dominates over the tensile strength of the body), the specific impact energy (required for a catastrophic disruption or shape deformation), Q, increases with target size, R, and impact velocity, U, as described by the scaling relationship (Housen & Holsapple 1990),

where ag
is a constant, and μg
is the coupling parameter to the target in the gravity regime. Equation (7) allows us to derive the  and Qreshape(20%) scaling for impacts into cohesionless spherical targets. Here we used a fixed target radius, R = 75 m. Using a best-fit algorithm, we find the scaling constants a and μg
. For
and Qreshape(20%) scaling for impacts into cohesionless spherical targets. Here we used a fixed target radius, R = 75 m. Using a best-fit algorithm, we find the scaling constants a and μg
. For  , we find μg
= 0.39 ± 0.01 and ag
= (1.0 ± 0.2) × 10−4.
, we find μg
= 0.39 ± 0.01 and ag
= (1.0 ± 0.2) × 10−4.
Using the same approach as for catastrophic disruption, for Qreshape(20%), we find ag
= (1.8 ± 0.5) × 10−5 and μg
= 0.38 ± 0.02. The μg
values found here are comparable with the values generally assumed for typical porous materials (e.g., μg
= 0.40–0.42, Jutzi & Benz 2017 and Jutzi 2019; μg
= 0.33–0.36, Ballouz et al. 2020). Moreover, the velocity exponent μg
is similar to the μ value derived from ejecta scaling, which suggests that the point-source approximation holds for the range of impact energies studied here. Our simulation results of impacts into oblate and prolate ellipsoids (Figure 14(a)) indicate that  and Qreshape(20%) are relatively insensitive to the target geometry. However, further dedicated studies are needed to investigate these impact scenarios in more detail.
As discussed above, our results show that only a relatively low specific impact energy is required to cause the shape deformation of the asteroid, rather than forming an impact crater. Because  is much larger than Qreshape (
 /Qreshape ≈ 6), and given that small impacts are more common than larger ones, global reshaping and resurfacing events are expected to be up to five times more frequent than catastrophic disruptions (based on the approach used in Jutzi 2019). Consequently, the collisional lifetime of the overall asteroid shape is correspondingly smaller than its lifetime before it is catastrophically disrupted. As opposed to catastrophic disruptions, reshaping impacts involve only limited mass loss (a few percent of the target mass). Therefore, an asteroid may experience many reshaping events during its lifetime.
6. Implications for DART and Hera
Our findings have strong implications for NASA's DART mission impact on Dimorphos (Cheng et al. 2018; Rivkin et al. 2021) and ESA's Hera mission (Michel et al. 2018). Here we discuss some of the consequences of our findings for the interpretation of the results from these two space missions.
6.1. Momentum Transfer Efficiency from the DART Impact
One of the main aims of the DART mission is to demonstrate the kinetic impactor technique and determine the efficiency of the impact. Figure 15 shows the momentum enhancement, β, as a function of target cohesion and different target coefficients of internal frictions. The results are plotted from both the spherical and ellipsoidal targets. Our results show that in the impact scenarios considered in this work, β can be as high as six times the momentum of the impacting spacecraft, which is much larger than the currently predicted values that were in the range of 2–3 (e.g., Stickle et al. 2015; Bruck Syal et al. 2016; Cheng et al. 2018). The reason for such large values of β for targets with Y0 < 0.1 Pa is that the material needs very low velocities to overcome the cohesion and the escape velocity of the target.

Figure 15. Momentum transfer efficiency, β, for different target cohesions, Y0 , and coefficients of internal friction, f. The shaded area denotes the transition to the gravity-dominated cratering regime at about 2 Pa.
Download figure:
Standard image High-resolution imageAnother consequence of the target cohesion is that when Y0 < 10 Pa, a relatively large fraction of the ejected target mass is trapped in the Didymos system (i.e., is being ejected with speeds just above vesc of Dimorphos but below the escape speed of the Didymos system). Therefore, from our results, we can estimate the amount of mass that escapes Dimorphos but not the Didymos system. We can also calculate the velocity of the escaped mass, which then gives us the total momentum of the ejecta and the momentum of the ejecta that escapes the Didymos system. To estimate the amount of mass that remains in the system, we assume that the escape speed of the system at Dimorphos (considering a 1.2 km separation between Didymos and Dimorphos) is 24.5 cm s−1. We apply this value as a speed threshold; therefore, the values presented here should be regarded as estimates only. In Table 2, we include our calculation results as "Momentum System," which is the proportion of the momentum enhancement, β, that remains in the Didymos system (i.e., has speeds lower than the escape velocity of the system, vescS). Our results show that there is a correlation between the amount of momentum that is trapped in the system and the impact outcome (i.e., target deformation seems to occur when more than ≈7% of the momentum stays in the system; see Table 2). Consequently, this may lead to an observable difference between β and βsystem, depending on the asteroid strength. For targets stronger than ≈50 Pa, about 98% of the ejecta momentum leaves the Didymos system, and this percentage is reduced to 80% for a cohesionless target (Y0 = 0). Further analysis of β − βsystem is presented in Makadia et al. (2022, this focus issue). A full characterization of Dimorphos will not be possible before the arrival of the Hera spacecraft. In the absence of a direct observation of the asteroid cohesion and/or postimpact deformation, an observed significant difference between β and βsystem could imply that Dimorphos is weak, less than ≈50 Pa.
Table 2. Results of Vertical Impacts
| Target Type | Cohesion | Coeff. of | Mass | Mass | Momentum | Momentum | Velocity | Impact |
|---|---|---|---|---|---|---|---|---|
| Friction | Ejecta | Displaced | Enhancement | System | Exponent | Outcome | ||
| Y0 (Pa) | f | Me (×m) | Md (/Mt (%)) | β | % of β(<vescS) | μ | ||
| Sphere | 50 | 0.4 | 2.38 × 10⁴ | 0.09 | 4.07 ± 0.06 | ≈2.00 | 0.39 | Crater |
| Sphere | 50 | 0.6 | 1.87 × 10⁴ | 0.07 | 3.63 ± 0.04 | ≈1.69 | 0.38 | Crater |
| Sphere | 50 | 0.8 | 1.65 × 10⁴ | 0.06 | 3.32 ± 0.03 | ≈1.13 | 0.37 | Crater |
| Sphere | 50 | 1.0 | 1.46 × 10⁴ | 0.02 | 3.08 ± 0.03 | ≈0.92 | 0.36 | Crater |
| Sphere | 10 | 0.4 | 4.61 × 10⁴ | 0.44 | 4.75 ± 0.09 | ≈5.71 | 0.39 | Crater |
| Sphere | 10 | 0.6 | 3.70 × 10⁴ | 0.21 | 4.18 ± 0.02 | ≈5.68 | 0.38 | Crater |
| Sphere | 10 | 0.8 | 2.77 × 10⁴ | 0.14 | 3.69 ± 0.06 | ≈4.44 | 0.37 | Crater |
| Sphere | 10 | 1.0 | 2.36 × 10⁴ | 0.12 | 3.38 ± 0.03 | ≈2.67 | 0.36 | Crater |
| Sphere | 1 | 0.4 | 1.52 × 10⁵ | 6.20 | 5.59 ± 0.07 | ≈13.94 | 0.39 | Deformation |
| Sphere | 1 | 0.6 | 1.01 × 10⁵ | 3.61 | 4.66 ± 0.05 | ≈11.32 | 0.38 | Deformation |
| Sphere | 1 | 0.8 | 6.48 × 10⁴ | 2.45 | 4.05 ± 0.03 | ≈9.00 | 0.37 | Deformation |
| Sphere | 1 | 1.0 | 4.59 × 10⁴ | 2.05 | 3.65 ± 0.03 | ≈7.80 | 0.36 | Deformation |
| Sphere | 0 | 0.4 | 2.48 × 10⁵ | 18.32 | 5.98 ± 0.03 | ≈19.62 | 0.39 | Deformation |
| Sphere | 0 | 0.6 | 1.38 × 10⁵ | 15.50 | 4.93 ± 0.04 | ≈16.76 | 0.38 | Deformation |
| Sphere | 0 | 0.8 | 8.20 × 10⁴ | 12.22 | 4.27 ± 0.09 | ≈14.51 | 0.37 | Deformation |
| Sphere | 0 | 1.0 | 6.25 × 10⁴ | 10.84 | 3.82 ± 0.05 | ≈13.22 | 0.36 | Deformation |
| Oblate ellipsoid | 0 | 0.6 | 1.24 × 10⁵ | 20.45 | 5.97 | ⋯ | 0.38 | Deformation |
| Prolate ellipsoid | 0 | 0.6 | 1.36 × 10⁵ | 17.18 | 5.68 | ⋯ | 0.38 | Deformation |
Download table as: ASCIITypeset image
6.2. Noninstantaneous Momentum Transfer
Postimpact dynamics simulations of the Didymos system typically treat the DART impact as an instantaneous perturbation to Dimorphos's velocity. However, high β values are the result of impacts into very low strength targets, which have a large cratering efficiency, and the crater and momentum transfer process takes a long time, up to a couple of hours after the impact. Our results suggest that a more careful consideration of slow-moving ejecta to the contribution to β may be required in dynamics calculations (e.g., Richardson et al. 2022, this focus issue).
6.3. Dimorphos's Postimpact Morphology
Measurements of the deflection efficiency and the DART impact crater size and morphology can be used to infer the target asteroid's mechanical properties (e.g., Raducan et al. 2019). The DART impact is expected to create a well-defined crater on the surface of the asteroid (e.g., Cheng et al. 2016; Stickle et al. 2017). Our results show, however, that if Dimorphos's cohesion is small (Y0 ≲ 10 Pa), the DART impact will not create a crater but will instead induce a global shape deformation of the asteroid.
In addition to producing global shape deformation, the DART impact may not only explore the surface but also uncover the interior of the asteroid. These large shape deformations of Dimorphos may also lead to an additional change of the mutual orbit period, which is a critical parameter for calculating the kinetic impact deflection (Hirabayashi et al. 2017, 2019). Hirabayashi et al. (2022, this focus issue) showed that Dimorphos reshaping gives additional orbital perturbations, causing a shorter orbital period than for a nondeformed body, and that the orbital period becomes linearly shorter with reshaping magnitude. For example, in the cohesionless target impact scenarios, even though less than ≈3% of the target mass is ejected (see Section 4.3), the global deformation of the target causes changes in the the mutual orbit period of up to ≈200 s (Ryota et al. 2022, this focus issue). However, while the deformation-induced absolute change in the orbital period is large, the relative change might be smaller, because these impact scenarios also lead to large β values and an associated large period change.
The Hera mission will provide detailed measurements of the postimpact target morphology, the momentum transfer, and the properties of Dimorphos. The Juventas CubeSat will provide the first measurements of the subsurface and internal properties of an asteroid (Michel et al. 2022, this focus issue). By measuring the postimpact target morphology, the Hera mission will be vital for validating the predictive capabilities of numerical models for impacts at asteroid scale and of asteroid deflection.
6.4. Dimorphos's Lifetime
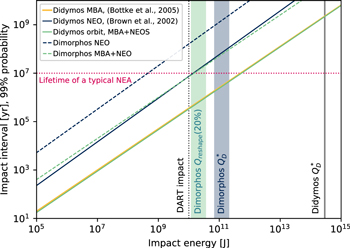
Richardson et al. (2022, this focus issue) estimated the impact rate on the Didymos binary system from natural impacts. Didymos has an eccentric orbit that crosses the main asteroid belt for about 30% of its orbital period. For this reason, Richardson et al. (2022, this focus issue) considered a mixed-impactor population model that includes both near-Earth objects (NEOs) and main-belt asteroids (MBAs) to estimate the impact rate on Didymos and Dimorphos. The number of potential impactors in the main asteroid belt is higher than in the near-Earth region; however, the impact speed is about four times slower than for NEOs. For NEO impacts, Richardson et al. (2002, this focus issue) used the impactor flux model of Brown et al. (2002), with assumed impact speeds of about 18.5 km s−1, while for MBA impacts, they used the impact flux model of Bottke et al. (2005), with assumed impact speeds of about 5 km s−1. Figure 16 shows the time interval for impacts of a given energy for Didymos and Dimorphos using a mixed-impactor population model. For weak Dimorphos-like bodies, we find that Qreshape(20%) ≈ 2 × 10¹⁰ J and  1011 (Figure 14). In Figure 16, Qreshape(20%) and
  are shown as thick bands that account for the uncertainty in the Q calculations (Figure 14) and the mass of Dimorphos. The Didymos
  is about 1014 J (Jutzi et al. 2010).
Figure 16. Time interval between impacts of a given energy for Didymos and Dimorphos, in years. The blue and yellow lines show the impact interval if Didymos and Dimorphos were impacted by only the NEO and MBA population, respectively. The green lines show the impact interval on Didymos and Dimorphos for a mixed-population model that considers the system's current orbit that crosses the inner main belt. The vertical dotted line shows the DART impact energy (≈2 × 10¹⁰ J). The green band shows the energy required to induce shape changing on a cohesionless Dimorphos. The blue band shows the  required to catastrophically disrupt a low-cohesion Dimorphos. The thickness of the band takes into account the uncertainty in the Q calculation and the mass of Dimorphos. The gray line shows the the
  required to catastrophically disrupt Didymos. The horizontal dotted magenta line shows the median dynamical NEA lifetime. Adapted from Richardson et al. (2022, this focus issue).
Download figure:
Standard image High-resolution image
Interestingly, Richardson et al. (2022, this focus issue) showed that an impact with the same energy as the DART impact is expected to occur every 0.4 Myr on Didymos. However, an impact with this energy (which is ≈Qreshape(20%) for Dimorphos) is expected only once every ≈10 Myr on Dimorphos. At the same time, the typical lifetime of an NEA is also ≈10 Myr (Gladman et al. 2000). The case of a DART impact on a weak Dimorphos therefore underlines the importance of subcatastrophic shape-changing impacts regarding the overall shape and surface ages of small asteroids. The 100 m–scale objects with similar heliocentric orbits as Dimorphos might experience, on average, ∼one Qreshape(20%) event during their typical NEA lifetime, while the probability for these objects to experience a highly energetic catastrophic ( ) impact during this time is very small. As shown in Figure 16, the impact interval for
  events is about an order of magnitude longer than the time interval for Qreshape(20%). This suggest that the current observable shapes of a large fraction of NEAs may be a result of subcatastrophic reshaping events.
7. Conclusions
Asteroids in the solar system have experienced numerous collisional, dynamical, and thermal events. Evidence from recent space missions to small asteroids (e.g., Ryugu and Bennu) suggests that their surface may be very weak. It is possible that NASA's DART impact on Dimorphos will take place in a similar low-gravity, low-strength regime, which has been mostly unexplored so far. In this study, we use the Bern SPH code to numerically simulate DART-like impacts on weak asteroids that use realistic material models. We used a novel approach to model the entire cratering process, which uses shock physics code calculations directly and tracks the evolution of the target for up to 2 hr after the impact.
In the strength-dominated impact scenarios, the cohesion is the dominant force that stops the crater cavity from growing. Therefore, with decreasing target cohesion, more material is displaced or gets ejected above the escape speed. We find that a gravity-dominated impact into a small cohesionless target can eject up to 3% of the target mass. At the same time, up to 20% of the target material is displaced, causing excavation of material from the asteroid interior, global deformation, and resurfacing. In such impact scenarios, the momentum enhancement, β, can be as high as 6. We also find that for targets stronger than ≈50 Pa, about 98% of the ejecta momentum leaves the Didymos system, while for cohesionless targets, this percentage is reduced to 80%. This means that if there is a measurable difference between the β derived from Dimorphos's orbital dynamics and the β derived from the heliocentric orbit of the system, it is likely that Dimorphos is weaker than ≈50 Pa.
Consequently, if the surface cohesion is less than ≈10 Pa, we predict that the DART impact is likely to produce morphologies that are dissimilar to cratering and change the global morphology of the asteroid. In such cases, Hera will not find a classical crater morphology. Our results also show that the impact angle will likely not influence the target morphology or the direction of the target momentum significantly.
An important implication of our results is that the collisional lifetime of the overall asteroid shapes is significantly lower than the traditionally used lifetime based on catastrophic disruption events. We find that for the current energy of the DART impact, the catastrophic disruption of the target is not possible. However, the DART impact may probe not only the surface but also the interior of the asteroid. Our results, together with future observations by the Hera mission, will provide constraints regarding the evolution of the shapes and structures of small asteroids by subcatastrophic impacts.
This work has received funding from the European Union's Horizon 2020 research and innovation program under grant agreement No. 870377 (project NEO-MAPP). This work has been carried out within the framework of the National Centre for Competence in Research PlanetS supported by the Swiss National Science Foundation.