


Abstract
The origin of the very low luminosity of Uranus is unknown, as is the source of the internal tidal dissipation required by the orbits of the Uranian moons. Models of the interior of Uranus often assume that it is inviscid throughout, but recent experiments show that this assumption may not be justified; most of the interior of Uranus lies below the freezing temperature of H2O. We find that the stable solid phase of H2O, which is superionic, has a large viscosity controlled by the crystalline oxygen sublattice. We examine the consequences of finite viscosity by combining ab initio determinations of the thermal conductivity and other material properties of superionic H2O with a thermal evolution model that accounts for heat trapped in the growing frozen core. The high viscosity provides a means of trapping heat in the deep interior while also providing a source of tidal dissipation. The frozen core grows with time because its outer boundary is governed by the freezing transition rather than compositional layering. We find that the presence of a growing frozen core explains the anomalously low heat flow of Uranus. Our thermal evolution model also predicts time-varying tidal dissipation that matches the requirements of the orbits of Miranda, Ariel, and Umbriel. We make predictions that are testable by future space missions, including the tidal Love number of Uranus and the current recessional rates of its moons.
Export citation and abstract BibTeX RIS
1. Introduction
The very low internal luminosity of Uranus as compared with other giant planets is a long-standing puzzle (Hubbard et al. 1995; Scheibe et al. 2019). Adiabatic, inviscid thermal evolution models predict a present-day internal luminosity that is much too large and a timescale required for cooling to the present state that is much longer than the age of the solar system.
It has been known for some time that the thermal evolution of Uranus can be reconciled with observations by trapping heat in its interior (Hubbard et al. 1995), but the mechanism is unknown. Proposals have focused on reducing the efficiency of thermal convection in the deep interior by the presence of compositional gradients that compete with thermal buoyancy, producing stagnant, double diffusive, or turbulently diffusive layers (Nettelmann et al. 2016; Podolak et al. 2019). A parameterized model of double diffusive convection, combined with a limitation on the initial formation energy, can match the thermal evolution of Uranus (Vazan & Helled 2020). However, these scenarios have not addressed the problem of tidal dissipation in Uranus and rely on the inviscid approximation, which may not be justified.
The source of tidal dissipation in Uranus required by the orbits of its moons is also unknown. Tidal forces exerted by moons on their parent planet cause the moons to recede (their orbital radii to increase with time), much as our own Moon is receding from Earth today. The rate of recession depends on the properties of the planet, including the dissipation resulting from tidal deformation, measured by the inverse of the tidal quality factor Q. The rate of recession also depends on the mass and orbital radius of the moon; different moons recede at different rates, and pairs of moons may encounter resonances that can lead to orbital instabilities. Arguments based on present-day orbital elements indicate that some resonances were encountered while others were avoided (Tittemore & Wisdom 1990), bracketing the value of Q, with a recent study finding 15,000 < Q < 20,000 (Cuk et al. 2020). The value required is much smaller than would be expected of tidal dissipation due to turbulent viscosity in a fluid planet (Q ∼ 1013; Goldreich & Nicholson 1977). Current models of the thermal evolution of Uranus, because they are inviscid, therefore appear to be incapable of simultaneously satisfying the constraints imposed by tidal dissipation and luminosity. On the other hand, if the moons formed outside the Roche limit, then Q > 72,000 (Goldreich & Soter 1966), which is inconsistent with the range of Q inferred on the basis of resonances.
Recent experiments show that the inviscid approximation may not be justified in the case of Uranus. Most of the interior of Uranus lies within the stability field of the superionic phase of H2O, in which a mobile sublattice of H atoms exists within a crystalline sublattice of O atoms (Millot et al. 2018, 2019). The stability field of superionic H2O had previously been predicted theoretically (Cavazzoni et al. 1999) and has featured in some previous models of the interior of Uranus (Redmer et al. 2011). However, it was argued that the viscosity of the superionic phase is very similar to that of the fluid phase (Redmer et al. 2011), in which case the thermal evolution and dissipation of Uranus would be no different from the inviscid case. We reexamine these arguments here using ab initio molecular dynamics (AIMD) simulations, finding that the viscosity of the superionic phase is dominated by the crystalline oxygen sublattice.
The frozen core grows with time because its outer boundary is governed by the fluid–crystalline phase transition rather than a compositional boundary; the solid phase was absent in the very early, hottest stages of evolution and grew to occupy two-thirds of the radius of the planet at the present day (Figure 1). The finite viscosity of the growing frozen core has an important influence on thermal and tidal evolution. Because fluid flow in the frozen core must overcome resisting viscous stresses, a thermal boundary layer develops (Chandrasekhar 1961), located at the fluid–crystalline phase transition, which traps heat deep in the interior. We must therefore modify the standard equations of thermal evolution to account for the growing frozen core, the magnitude of the temperature jump across the thermal boundary layer, and the heat conducted across the boundary. The problem is related to that of the growing crystalline inner core of Earth (Cottaar & Buffett 2012) and the evolution of the interiors of icy moons (Spohn & Schubert 2003). At the same time, the finite viscosity of the frozen core entails dissipation. Tidal dissipation grows with the size of the frozen core, leading to increasingly rapid evolution of the orbits of the Uranian moons.
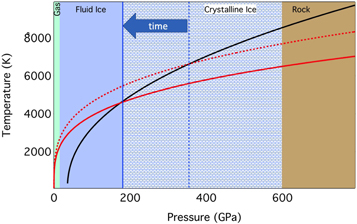
Figure 1. Model of the present-day interior structure of Uranus showing compositional layers (colors) and the phase boundary (solid blue line). Compositional layers, according to the model U2 (Nettelmann et al. 2013), are gas (H and He), ice (hydrogen compounds dominated by H2O), and rock (heavier elements). The phase boundary separates the stability field of the fluid phase (solid blue) from the superionic phase (blue bricks) of H2O along the present-day Uranus adiabat (red solid line, assuming a temperature at 1 bar T1 = 76 K). Also shown is the Uranus adiabat at an earlier, hotter stage in the planet's evolution (T1 = 90 K; red dashed line) and the freezing curve of H2O (black solid line). The arrow indicates that the frozen core grows with time; the proportion of the ice layer in the superionic phase increases as the phase boundary moves from its location in the earlier, hotter stage (blue dashed line) to the present day (blue solid line).
Download figure:
Standard image High-resolution imageWe examine the consequences of a growing frozen core on the thermal evolution and tidal dissipation of Uranus. We constrain the material properties of the frozen core by a series of AIMD simulations. We develop a model of the thermal evolution that includes the effects of a frozen core, including the thermal boundary layer that develops at its surface, trapping heat at depth, and show that this effect can explain the low luminosity of Uranus today. We compute the tidal response of Uranus throughout its thermal evolution and show that we can self-consistently explain the known properties of the evolution of the orbits of the moons of Uranus by relating the viscosity of the frozen core to the tidal dissipation. We discuss the possible implications of a frozen core for the generation of the magnetic field of Uranus. Finally, we discuss the predictions of our model that can be tested by future space missions.
2. Methods
2.1. Ab Initio Molecular Dynamics
We used Car–Parrinello AIMD simulations to determine the physical properties governing thermal evolution and reexamine the viscosity of the superionic phase of H2O. All of the AIMD simulations were performed using computer codes taken from the QUANTUM ESPRESSO package v. 6.1 (Giannozzi et al. 2009, 2017, 2020) and adopting the Perdew–Burke–Ernzerhof density functional and Hamann–Schluter–Chiang, as modified by Vanderbilt (Vanderbilt 1985) norm-conserving pseudopotentials (downloadable from http://fpmd.ucdavis.edu/potentials/index.htm), which are also accurate at planetary pressure–temperature conditions (Sun et al. 2015).
For the thermal conductivity, we use the Green–Kubo theory of linear response, leveraging recently discovered invariance principles in the theory and numerical computation of transport coefficients (Marcolongo et al. 2016; Grasselli & Baroni 2019) in multicomponent systems (Baroni et al. 2018; Bertossa et al. 2019) and the resulting cepstral analysis for the time series of the fluxes to be fed into the Green–Kubo formula (Ercole et al. 2017; Bertossa et al. 2019). The results are collected in Grasselli et al. (2020), where the reader can find a thorough description of the methods employed.
To obtain the isobaric specific heat capacity, CP , and thermal expansion coefficient, α, as well as the isothermal compressibility, KT , we ran AIMD simulations at a fixed number of particles N, pressure P, and temperature T (NPT). Simulation parameters were chosen as in Grasselli et al. (2020).
The isobaric specific heat and thermal expansion coefficient, as well as the isothermal bulk modulus, can be extracted in a single NPT simulation from fluctuations as


where H is the enthalpy and M is the total mass of the system. We employed standard block analysis and error propagation to estimate the uncertainties on CP , α, and KT , which are acceptably small for the relatively long NPT simulations we ran (≥20 ps). By employing two NPT simulations at different temperatures T1 and T2 but the same P, a finite-difference method was also devised to obtain estimates of CP and α with a lower statistical uncertainty:


We checked the convergence of the results on the parameters of the thermobarostat. The results are reported in Table 1, in which we also report the Grüneisen parameter  . Our values are in good agreement with previous AIMD simulations; from the internal energy (u) results reported in Table 5 of French et al. (2009), we find CV
= Δu/ΔT = 4.78 J (gK)–1 at ρ = 2.5 g cm−3 and an average T = 2500 K, and in Supplementary Table 5 of Millot et al. (2018), we find CV
= 3.98 J (gK)–1 at ρ = 3.753 g cm–
3 and an average T = 3500 K (using their values of energy at 3000 and 4000 K).
. Our values are in good agreement with previous AIMD simulations; from the internal energy (u) results reported in Table 5 of French et al. (2009), we find CV
= Δu/ΔT = 4.78 J (gK)–1 at ρ = 2.5 g cm−3 and an average T = 2500 K, and in Supplementary Table 5 of Millot et al. (2018), we find CV
= 3.98 J (gK)–1 at ρ = 3.753 g cm–
3 and an average T = 3500 K (using their values of energy at 3000 and 4000 K).
Table 1. Thermodynamic Properties of H2O
| Phase | T [K] | P [GPa] | ρ [g cm−3] | CP [J g−1 K−1 ] | α [10−6 K−1] | KT [GPa] | γ |
|---|---|---|---|---|---|---|---|
| Ionic liquid | 2000 | 20 | 1.75 ± 0.02 | 4.22 ± 0.13 | 44 ± 6 | 80 ± 6 | 0.49 ± 0.10 |
| Superionic | 2500 | 175 | 3.39 ± 0.03 | 5.12 ± 0.10 | 21.7 ± 2.5 | 560 ± 50 | 0.73 ± 0.15 |
| Superionic | 3000 | 175 | 3.36 ± 0.03 | 4.30 ± 0.09 | 14.6 ± 2.2 | 550 ± 50 | 0.59 ± 0.13 |
| Superionic (finite difference) | 2750 | 175 | ⋯ | 4.66 ± 0.05 | 17.5 ± 0.5 | ⋯ | 0.66 ± 0.08 |
Note. Thermodynamic properties of phases: liquid H2O, which, under these conditions, is partially dissociated (ionic liquid) and superionic H2O, via fluctuations (first three lines) compared with the two-point method for the superionic phase (fourth line).
Download table as: ASCIITypeset image
2.2. Response of Superionic Ice to Shear Stress
We examined the viscosity of H2O by performing AIMD simulations at fixed N, volume V, and energy E (NVE) in liquid and superionic states in hydrostatic and sheared configurations.
The time integral of the autocorrelation function of the shear stress

does not represent the proportionality coefficient between the stress and the strain rate in viscoelastic materials, like crystals or superionic materials, nor does it dictate the convective motion of large masses of solid, crystalline material, which is instead governed by defect diffusion.
We ran two NVE simulations to extract ηACF from Equation (6), one at 2500 K and 175 GPa, where the system is superionic, and one at approximately the same average temperature but a much lower pressure (50GPa), where the oxygen lattice is molten and the system is in the ionic liquid phase. We obtained ηACF = 1.50 ± 0.08 mPa s for the superionic phase and ηACF = 1.89 ± 0.11 mPa s for the liquid phase. Even if these values are consistent with those given in Redmer et al. (2011), we do not agree with the conclusion drawn there that "the superionic phase responds almost like a fluid." The similarity of ηACF for the superionic and ionic liquid phases does not indicate their comparable behavior under external shear stress; if it were so, the stress induced by the instantaneous application of an external shear strain to the superionic ice system would decay to zero on a timescale related to the time τ ≈ 100 fs over which the autocorrelation function of the shear stress is extinguished. We verified that this is not the case by deforming the simulation cell so as to include nondiagonal components in the cell tensor (in particular, we introduced nonvanishing xz and zx components) and monitoring the behavior of the induced shear stress. On the timescale of τ, we observe a decay of the latter to a new equilibrium value (Figure 2). No approach to zero of Pxz was observed for the superionic phase, not even after several ps of simulation. On the contrary, in the case of ionic liquid water, Pxz vanishes at equilibrium. Therefore, in contrast to Redmer et al. (2011), we conclude that the superionic phase does not respond to an external shear stress like a fluid, and that it has a nonnegligible viscosity. We note that another recent paper also concluded that the viscosity of the superionic phase may be large compared with that of a fluid (Millot et al. 2019).

Figure 2. Decay of shear stress Pxz in a distorted cell. Blue: superionic ice at T ≈ 2500 K and Pxx ≈ 175 GPa, with 2% strain on the xz element of the cell tensor. Orange: liquid water at approximately the same temperature but with a diagonal stress Pxx ≈ 50 GPa and 5% strain on the xz element of the cell tensor. The dashed horizontal lines are the asymptotic averages computed on longer segments of the simulations from t > 500 fs: −10.2 ± 0.2 and −0.09 ± 0.12 GPa, respectively. The errors have been obtained from standard block analysis. The extracted elastic modulus is c44 = 255 ± 5 GPa, in excellent agreement with previous results (Hernandez & Caracas 2016).
Download figure:
Standard image High-resolution image2.3. Thermal Evolution
In the presence of a growing, viscous, frozen core, thermal evolution is governed by the equations (Fortney & Nettelmann 2010; Cottaar & Buffett 2012)


where Lint is the total luminosity from the interior; Lfluid and  are the contributions from the fluid envelope and frozen core, respectively; R is the radius of the planet; σ is the Stefan–Boltzmann constant; Teq is the luminosity due to thermalized and reradiated solar flux; Teff is the temperature the planet would have in the absence of solar luminosity; M is the mass of the planet; Mc
is the mass of the frozen core; CP
is the isobaric specific heat; c is the radius of the frozen core; S is the surface of the core; ρc
is the density at the core radius; ΔT is the temperature contrast across the thermal boundary layer at the top of the core; ∂T/∂t is the cooling rate; and ∂c/∂t is the growth rate of the core.
are the contributions from the fluid envelope and frozen core, respectively; R is the radius of the planet; σ is the Stefan–Boltzmann constant; Teq is the luminosity due to thermalized and reradiated solar flux; Teff is the temperature the planet would have in the absence of solar luminosity; M is the mass of the planet; Mc
is the mass of the frozen core; CP
is the isobaric specific heat; c is the radius of the frozen core; S is the surface of the core; ρc
is the density at the core radius; ΔT is the temperature contrast across the thermal boundary layer at the top of the core; ∂T/∂t is the cooling rate; and ∂c/∂t is the growth rate of the core.
The system of equations differs from the standard thermal evolution model for giant planets in the appearance of a thermal boundary layer at the top of the core (second term on the right-hand side of Equation (9)). As ∂c/∂t and ΔT are positive quantities, this equation shows that the presence of a thermal boundary layer reduces  , as compared with a uniformly fluid planet, thereby storing heat in the deep interior and allowing the fluid envelope to cool more quickly. In the case of a purely fluid planet, ΔT → 0, the interior heat flux reduces to that of the adiabatic, inviscid case (Fortney & Nettelmann 2010):
  .
.
The radius of the core, c, is determined at any time by the intersection of the planetary temperature profile with the freezing curve of H2O (Figure 1). The rate of growth is then (Gubbins et al. 2003)

where Γ is the Clausius–Clapeyron slope of the phase boundary, and Γa = (T/P)∇ is the slope of the planetary temperature distribution evaluated at Tc and Pc , the temperature and pressure at the top of the core. We represent the phase boundary with the Simon equation
with the values of the parameters chosen to match the melting transition of Millot et al. (2018) and the temperature in the fluid envelope and solid core by
respectively, where Ti = Tc + ΔT, Pc is the pressure at the top of the core, P1 = 1 bar, and the relationship between T1 and Teff is given by Guillot et al. (1995),

with B = 0.47529 reproducing the present-day observed value of T1 = 76 K for Teff = 59.1. We assume that the adiabatic gradient ∇ (away from thermal boundary layers) and the heat capacity are homogeneous. The assumed form of the temperature structure with homogeneous ∇ matches very well with multilayer fluid models in which the adiabatic gradient is given at every point by an assumed composition and equations of state (EOSs) of rock, ice, and gas components (Figure 3).

Figure 3. Temperature in multilayered fluid EOS-based models (Nettelmann et al. 2013) U1 and U2 (solid lines) compared with homogeneous ∇ (dashed lines; ∇ = 0.28149 for U1 and ∇ = 0.28505 for U2). The inset shows the percentage difference ΔT between the multilayered and homogeneous ∇ models. Another recent multilayered model (Bethkenhagen & Meyer et al. 2017; not shown) can be approximated by ∇ = 0.25507.
Download figure:
Standard image High-resolution imageThe thermal evolution equations are closed by relating the core luminosity to the temperature contrast across the thermal boundary layer (Schubert et al. 1969),

which shows that the core luminosity increases with the thermal conductivity k and the temperature contrast. The other parameters are thermal expansivity α, thermal diffusivity κ, gravitational acceleration g, and viscosity η. The viscous scale height  and other quantities in Equation (14) are evaluated at the surface of the core with radius c. Here Racr is the critical Rayleigh number for the onset of convection. This expression is appropriate for very deep convective systems, such as the core of Uranus, over which the viscosity varies by many orders of magnitude. We adopt the value Racr = 30, corresponding to the limit h/c → 0 (Schubert et al. 1969).
For the viscosity, we adopt the homologous temperature relationship that has been widely used in studies of the thermal evolution of icy moons and is supported by experimental data (Moore 2006),

which yields

for the viscous scale height. The value of the viscosity exponent A is set by experimental parameters summarized by Moore (2006). We note that our expression assumes that viscous flow is dominated by volume diffusion, and that the creep mechanism in the deep interior of ice giants could be different from that in moons. The inner envelope of Uranus is unlikely to be composed of pure H2O (although H2O may be the dominant component), and the presence of impurities may influence the crystal structure and melting temperature and therefore transport properties. A study performed on an impure H2O system at the relevant conditions found that a 1:1 mix of water and ammonia had nearly the same melting point as pure H2O (Bethkenhagen et al. 2015). While this result indicates that the melting temperature of pure H2O may be a reasonable approximation to that of the ice component of giant planets, melting in H–C–N–O systems at multimegabar pressures is still little explored. We find little difference in transport properties between the two crystalline structures that have been found for superionic H2O (Millot et al. 2019; Grasselli et al. 2020). Another recent study also finds little difference in the self-diffusion coefficient among different crystalline structures of superionic H2O (Cheng et al. 2021).
We solve Equations (7)–(16) with a fourth-order Runge–Kutta scheme and values of physical parameters as specified in Table 2. As in the case of inviscid thermal evolution models (Guillot et al. 1995), our results are insensitive to initial conditions. We ignore the relatively minor contributions to luminosity from gravitational contraction (Hubbard et al. 1995). For planetary structure, we adopt the so-called "empirical" model of Helled et al. (2011). This model is specified by a sixth-order polynomial of density in radius and matches all relevant observational data. We compute other structural quantities from this polynomial, including pressure, gravitational acceleration, and mass as a function of radius. We have checked that our results are not sensitive to the details of planetary structure by using a very different empirical model that includes a dense core to 20% of the planet's radius and fits relevant observational data equally well (Kaspi et al. 2013). We find that computed cooling times differ by 10% between the two models.
Table 2. Values of the Parameters Used in the Thermal and Tidal Evolution Models
| Symbol | Parameter | Value |
|---|---|---|
| R | Planet radius | 25,388 km |
| CP | Specific heat | 3000–6000 J kg−1 K−1 |
| α | Thermal expansivity | 1.46 × 10⁻⁵ K−1 |
| k | Thermal conductivity | 11.2 W m−1 K−1 |
| T0 | Phase transition reference T | 1000 K |
| P0 | Phase transition reference P | 40 GPa |
| a | Simon pressure | 4.6238 GPa |
| b | Simon exponent | 0.44646 |
| ∇ | Adiabatic gradient | 0.24–0.29 |
| Teq | Radiative equilibrium temperature | 58.1 K |
| η0 | Reference viscosity | 7 × 10¹⁴ Pa s |
| A | Viscosity exponent | 26 |
| ω | Rotational frequency | 1.012 × 10⁻⁴ s−1 |
| μ1/μ0 | Standard linear solid parameter | 60 |
Download table as: ASCIITypeset image
We do not explicitly account for compositional layering in Uranus; we assume that over the range of depth in which the core forms in our models (out to two-thirds of the planet's radius), the composition is dominated by H2O, consistent with detailed interior models (Nettelmann et al. 2013). We neglect the contrast in physical properties between superionic ice and a rocky innermost core because these have a small effect on thermal evolution and tidal response. Typical models of the interior of Uranus contain a rocky core that makes up less than 6% of the mass of the planet, corresponding to less than 20% of the radius (Scheibe et al. 2019; Nettelmann et al. 2013). Assigning to this innermost region a melting temperature as much as twice that of H2O (and thus a higher viscosity according to Equation (15); Mazevet et al. 2019) and a shear modulus as much as 10 times that of H2O changes the cooling time by less than 2% and Q by less than 3%.
We neglect the influence of the release of latent heat upon freezing of the core because this is poorly constrained and has a small influence on thermal evolution. Including the effects of latent heat, the energy balance (Equation (7)) becomes  , with Llatent = 4π
c2
ρc
Tc
Δs(∂c/∂t). In order to estimate the value of the specific entropy of melting Δs, we assume a typical high-pressure value for the entropy of melting (
, with Llatent = 4π
c2
ρc
Tc
Δs(∂c/∂t). In order to estimate the value of the specific entropy of melting Δs, we assume a typical high-pressure value for the entropy of melting ( atom–1; Stishov et al. 1973), where kB is the Boltzmann constant, and recall that only the oxygen sublattice melts at the superionic-to-fluid transition, yielding
  , where w is the molecular mass of H2O. Adopting this value of Δs and including the latent heat term in our numerical calculations, we find that the cooling time of our fiducial case (Figure 2) is increased by 6%.
2.4. Tidal Evolution
We characterize tidal dissipation by the quality factor

where k2 is the (complex) tidal Love number. We compute the tidal Love number from the radial structure of the planet at each time step of our thermal evolution calculations by solving the set of six coupled differential equations that govern the viscoelastic response (Alterman et al. 1959; Sabadini & Vermeersen 2004),


where l is the angular order of the deformation (l = 2 for tidal deformation), r is the radius, μ is the (complex) shear modulus, g is the gravitational acceleration, and G is the universal gravitational constant. The functions yi , i = 1,6 are, respectively, the amplitude of the radial and tangential deformation, the radial and shear stresses, and the gravitational potential and its radial derivative. The Love number is

Fluid layers require special treatment because they do not transmit deformation or stress and couple to other layers only through the gravitational potential (Jara-Orue & Vermeersen 2011; Matsuyama et al. 2018). We have found that we can obtain accurate solutions through fluid layers, and indeed for entirely fluid planets, by the simple expedient of assigning a small but nonvanishing value of the shear modulus to fluid layers (μ = 10−4 ρ gr). We use the propagator matrix technique (Henning & Hurford 2014; Sabadini & Vermeersen 2004) to solve Equations (18)–(23).
We validate our code for planetary structures consisting of two homogeneous layers for which the analytical solution (Remus et al. 2015) and numerical solutions (Padovan et al. 2018) are available and for a suite of purely fluid Jupiter models (Gavrilov et al. 1976; Figures 4 and 5).

Figure 4. Tests comparing the numerical results of our propagator matrix code (plus signs) to the analytical solution of Remus et al. (2015) for planets consisting of two homogeneous layers of density ρm
and ρc
and mean density ρ for two different values of ρm
/ρ. Results are shown for purely fluid planets (red in the top two panels) and planets with a viscoelastic core defined by  = 104, a Maxwell rheology and magnitude of the shear modulus ρ
gsurf
R, where gsurf is the gravitational acceleration at the surface of the planet (green and bottom panel). The numerical solution fails for extremely large values of Q (bottom panel) because of the assumed nonvanishing value of the shear modulus in the fluid layer. In the top two panels, the predictions of the Radau–Darwin equation are also shown for comparison (blue lines). For these tests, the mass of the planet M = 6.55 M⊕, and R = 2.68 R⊕.
= 104, a Maxwell rheology and magnitude of the shear modulus ρ
gsurf
R, where gsurf is the gravitational acceleration at the surface of the planet (green and bottom panel). The numerical solution fails for extremely large values of Q (bottom panel) because of the assumed nonvanishing value of the shear modulus in the fluid layer. In the top two panels, the predictions of the Radau–Darwin equation are also shown for comparison (blue lines). For these tests, the mass of the planet M = 6.55 M⊕, and R = 2.68 R⊕.
Download figure:
Standard image High-resolution image
Figure 5. Tidal Love number kl as a function of radius for linear, quadratic, and polytropic models of Jupiter in the fluid limit computed using our propagator matrix code and producing results indistinguishable from those shown in Gavrilov et al. (1976).
Download figure:
Standard image High-resolution image2.5. Viscoelasticity
We relate the viscosity to tidal dissipation by approximating the core as a standard linear solid. The complex shear modulus (Nowick & Berry 1972)

where

and the two characteristic timescales are

and

and the quality factor

where the viscosity is given by Equation (15). The unrelaxed shear modulus μ0 is taken from AIMD simulations (Hernandez & Caracas 2016); we used the published values of the full elastic constant tensor to compute the Voigt–Reuss–Hill average shear modulus (Watt et al. 1976) and approximated the pressure and temperature dependence by

with pressure in GPa and temperature in K. We adopt a value of μ1 = 60μ0, similar to a recent study of Earth tides (Lau et al.2015).
We have chosen the standard linear solid as a balance between parametric simplicity and realistic description of the relevant physics. The standard linear solid is a rough approximation to the behavior of real materials, i.e., polycrystals with a variety of grain sizes, in part because of the predominance of a single relaxation time, which causes Q to be overly sensitive to frequency. The Maxwell model, to which the standard linear solid reduces in the limit μ1/μ0 → 0, is even simpler but shows unrealistically large attenuation at low frequency (Henning et al. 2009). Other more complex models have also been considered in the planetary literature, including the Burgers model (Henning et al. 2009) and the Andrade model (Castillo-Rogez et al. 2011), which agree better with experimental data where they are available but contain additional parameters that are unconstrained at present at the pressure–temperature conditions of the interior of Uranus.
2.6. Orbital Dynamics
We determine the evolution of the radii of satellite orbits from the values of k2 and Q of Uranus determined at each time step of our thermal evolution model by numerically integrating (Tittemore & Wisdom 1989)

backward in time from present-day observed values (Jacobson 2014). Here a is the radius of the orbit, m is the mass of the moon, M is the mass of the planet, time-varying values of k2 and Q are from our thermal evolution model,  is the mean motion of the moon, and
  .
.
3. Results
Our results show that the presence of a growing frozen core explains the observed low luminosity of Uranus (Figure 6). The cooling timescale decreases by nearly a factor of 2 as compared with the inviscid case. The frozen core evolution coincides with purely fluid evolution over the first 1 Gyr, while the core is absent or still too small to significantly affect the luminosity. As the core grows, the effective temperature drops more rapidly as the core retains an increasing proportion of the internal heat.

Figure 6. Our thermal evolution model of Uranus containing a frozen core (blue line) as compared with a model that is completely fluid (red line). The arrows indicate the time at which the effective temperature reaches the observed present-day value (59.1 K). Inset: internal structure of the frozen core model showing the evolution of the core radius c (solid line, left-hand axis) and the temperature contrast at the top of the core ΔT (dashed line, right-hand axis). We assume CP = 5000 J kg−1 K−1 and ∇ = 0.2585.
Download figure:
Standard image High-resolution imageThe planet starts off in an entirely fluid state, as the temperature is everywhere greater than the freezing point (Figures 6 and 7). Superionic ice first crystallizes at ∼0.8 Gyr, when the adiabat intersects the freezing curve. The core initially grows rapidly because cooling is more rapid at earlier times and the curvature of the freezing transition as measured by the Clapeyron slope Γ is smaller at high temperature. The temperature contrast at the top of the core initially grows with time. After 2 Gyr, the core radius and the temperature contrast show little further change.
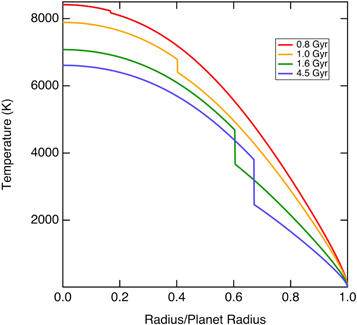
Figure 7. Temperature profiles in the frozen core model shown in Figure 2 at different times as indicated.
Download figure:
Standard image High-resolution imageWe find that a wide range of values of the heat capacity and adiabatic gradient yield cooling times in agreement with observations (Figure 8). Because the composition of the interior cannot be uniquely constrained by current observations, we explore the range CP = 3000–6000 J kg−1 K−1, which encompasses the Dulong–Petit values of pure H2O, a H2O–NH3–CH4 solar mix (Asplund et al. 2009), and the possible effects of admixtures of hydrogen, helium, and heavy elements, and the range ∇ = 0.24–0.29, which encompass detailed multilayer compositional models of Uranus (Nettelmann et al. 2013; Bethkenhagen & Meyer et al. 2017). A recent study argued that the cooling time for Uranus may be shorter than 4.5 Gyr and that the planet has been in radiative equilibrium for some time, because present observations show that Teff and Teq are indistinguishable within the uncertainty (Nettelmann et al. 2016). Our frozen core model can also accommodate cooling times as short as 1 Gyr over the range of CP and ∇ that we have explored (Figure 8).

Figure 8. Cooling time of Uranus as a function of the adiabatic gradient for various values of the heat capacity (color bar) for models that contain a frozen core (solid lines) and those that do not (dashed lines).
Download figure:
Standard image High-resolution imageThe cooling time increases with increasing heat capacity because this increases the thermal inertia of the planet (Figure 8). The cooling time increases with the adiabatic gradient because this increases the temperature of the planet at depth and therefore also increases the thermal inertia. The presence of a frozen core decreases the cooling time as compared with the homogeneous fluid case over most of the range we have explored. The core stores heat and allows the fluid envelope to cool more quickly. For some values of ∇, the presence of a frozen core causes the cooling time to increase. This is because the core, having retained much of its heat, releases it at a time similar to the homogeneous cooling time, thereby increasing the cooling time.
The growing frozen core produces dissipation that evolves throughout the course of thermal evolution (Figure 9). In the initial stages, the value of Q is very large because the planet is entirely fluid. As the core begins to grow, the value of Q diminishes to a minimum of 6500 at 1.2 Gyr. The quality partially recovers after 1.2 Gyr as the core becomes very large and an increasing proportion of it becomes so cold that it no longer contributes significantly to dissipation, yielding a present-day value Q = 36, 000.

Figure 9. (a) Tidal quality factor (red line, left-hand axis) and k2 (blue line, right-hand axis) of Uranus as a function of time for the thermal evolution model with a growing frozen core shown in Figure 6. (b) Ratio of the mean motion of the indicated satellite pairs (colored lines) as compared with the 3:1, 2:1, and 5:3 resonances.
Download figure:
Standard image High-resolution image
The orbits of the Uranian moons respond to the evolving dissipation in a way that explains their orbital characteristics (Figure 9(b)). The evolution of the orbital radii is initially very slow because Q is very large when the frozen core is absent or very small. As the frozen core grows, Q decreases, and the orbits evolve more rapidly. We find that Miranda–Umbriel pass through a 3:1 resonance and that Ariel–Umbriel pass through a 5:3 resonance at 3.6 Gyr. These resonances are important for explaining the anomalously large inclination of Miranda; Tittemore & Wisdom (1990) found that this is caused by the Miranda–Umbriel 3:1 resonance, while a more recent study attributes it to the Ariel–Umbriel 5:3 resonance (Cuk et al.2020).
We find no other low integer resonances; the predicted orbits avoid the Ariel–Umbriel 2:1 resonance in which these moons would have been trapped had they ever encountered it, contrary to observations (Tittemore & Wisdom 1990), and they avoid the Miranda–Ariel 5:3 resonance, which might have significantly increased the eccentricity and inclination of Miranda's orbit (Tittemore & Wisdom 1990). The total change in orbital radii is small; the moon that experiences the largest fractional change in orbital radius is Ariel, with an increase of 10% over 4.5 Gyr. The small total change in orbital radii permits all of the moons to have formed well outside the Roche limit. We report the current rates of recession of the Uranian moons from our calculations in Table 3.
Table 3. Present-day Rates of Recession
| Moon |
 (Gyr−1) (Gyr−1) |
|---|---|
| Miranda | 7.85 × 10⁻³ |
| Ariel | 12.4 × 10⁻³ |
| Umbriel | 1.47 × 10⁻³ |
Download table as: ASCIITypeset image
4. Discussion
It has been suggested that other giant planets also possess frozen cores made of ice or rock and that these may provide the dissipation required by the evolution of their satellite orbits (Dermott 1979). For example, a frozen core in Saturn can explain the current recessional rates of many of its moons (Lainey et al. 2017). However, the value of Q required is too small to explain the formation of these moons outside the Roche limit. Reconciliation may lie in a time-dependent value of Q, as we find in the case of Uranus; the frozen core grows as the planet cools, so that tidal dissipation in the planet increases with time. Frozen cores affect thermal evolution as well, and it is important to develop unified models of tidal and thermal evolution, as we have done.
The case of Neptune is intriguing because it is much more luminous than Uranus, despite its similar mass and radius. The interiors of these two planets may differ significantly; many models of the interior of Neptune feature a larger rocky core, as much as nine times greater in mass than that of Uranus (Kaspi et al. 2013; Nettelmann et al. 2013). Whereas in the case of Uranus, the rocky core is too small to affect thermal or tidal evolution, this may not be the case for Neptune. Future investigations of the thermal and tidal evolution of Neptune should consider the effects of frozen icy and rocky cores, which will require the determination of still-unknown material properties of rocky material at the conditions of Neptune's core, including the thermal conductivity and elastic moduli. Alternatively, the greater luminosity of Neptune may be due to ongoing demixing of hydrogen and water in the outer envelope (Bailey & Stevenson 2021). Growing frozen cores may also exist in ice-rich exoplanets, and this possibility should be considered in evaluating the evolution of tidal heating and orbits about host stars (Henning & Hurford 2014; Driscoll & Barnes 2015; Millholland & Laughlin 2019).
Orbital resonances may lead to internal heating of moons (Dermott et al. 1988; Peterson et al. 2015; Cuk et al. 2020). For example, Cuk et al. (2020) argued that the Ariel:Umbriel 5:3 resonance leads to significant tidal heating in Miranda. Dating of the young coronae on Miranda, based on crater counts, indicates that this heating event took place 1 Gyr ago (Zahnle et al. 2003; Cuk et al. 2020), in excellent agreement with the timing of the Ariel:Umbriel 5:3 resonance as found in our calculations at 0.9 Gyr ago (Figure 9).
The presence of a growing frozen core is important for understanding the generation of the magnetic field of Uranus. As the frozen core is far too viscous to host a dynamo, the magnetic field must be generated in the thin outer fluid envelope. Previous simulations have indicated that such a thin shell dynamo may best account for the nondipolar nature of the magnetic field of Uranus (Stanley & Bloxham 2004), although subsequent studies indicate that the effect of shell thickness may be less than originally thought (Soderlund et al. 2013). Ab initio simulations of the superionic phase point toward another important consideration: the electrical conductivity of the frozen core in Uranus is much greater than assumed in previous models of magnetic field generation (Grasselli et al. 2020), and this may have an important influence on the strength and geometry of the field produced in the overlying fluid layer.
We make predictions that can be tested by future space missions. Because of the presence of a frozen core, the tidal Love number k2 is much less than that of a fluid body (Figure 9). We find k2 = 0.275 for our frozen core model at the present day, whereas we calculate k2 = 0.363 for the same density model without rigidity. The difference between fluid and frozen results is much larger than the uncertainty on k2 of other planets for which this quantity has been measured. The tidal Love number has not yet been measured for Uranus, although the possibility of a future measurement has been discussed (Lainey 2016).
5. Conclusions
It is often assumed that the interior of Uranus is entirely fluid. However, no current observations require this to be the case. Moreover, an entirely fluid interior is at odds with experimental observations that the freezing temperature of H2O is much higher than the plausible interior temperatures. The stable solid phase is the superionic phase of H2O, which has a large viscosity dominated by the oxygen sublattice.
The size of the frozen core is dictated by phase equilibria, rather than compositional layering, so that the frozen portion of the planet grows with time. Based on ab initio and experimental determination of physical properties and phase equilibria, our fiducial thermal evolution model predicts that the frozen core nucleates at 0.8 Gyr and grows to occupy two-thirds of the planet's radius.
We have shown that the presence of a growing frozen core can explain the low luminosity of Uranus and its tidal dissipation self-consistently. The frozen core traps heat at depth because of the high viscosity of the solid phase, which also provides the source of dissipation. The growing frozen core model makes predictions that can be tested against future missions, including measurements of the tidal Love number and the present-day rate of recession of the Uranian moons.
F.G. thanks R. Bertossa and L. Ercole for technical support on the data analysis of time series. Funding: This project is supported by the National Science Foundation under grant EAR-1853388 (L.S.), the EU through the MaX Centre for Excellence for Supercomputing Applications (project Nos. 676598 and 824143; S.B.), and the Swiss National Science Foundation (SNSF), project No. 200021-182057 (F.G.).