


Abstract
New Horizons images of the illuminated nonencounter hemisphere (far side) of Charon display geomorphic features that are consistent with features observed in the highest-resolution images of the encounter hemisphere. Scarps, ridges, craters, and one area of smooth plains are identified. These features support previous hypotheses of global expansion and large-scale faulting across this icy world.
Export citation and abstract BibTeX RIS

Original content from this work may be used under the terms of the Creative Commons Attribution 4.0 licence. Any further distribution of this work must maintain attribution to the author(s) and the title of the work, journal citation and DOI.
1. Introduction
The New Horizons flyby of the Pluto system in 2015 (Stern et al. 2015) observed the Pluto-facing hemisphere of Charon (also referred to as the encounter hemisphere) at closest approach and got the best resolution (∼160 m pixel−1) over that area. The Charon encounter hemisphere displays two major terrain types: the heavily tectonized Oz Terra 9 that stretches from the mid-latitudes to over the north pole (Beyer et al. 2017) and the relatively smooth equatorial low plains of Vulcan Planitia (Beyer et al. 2019; Robbins et al. 2019). The Pluto–Charon system is tidally locked, revolving and orbiting the barycenter in 6.39 days, and New Horizons obtained images every few hours starting more than one Pluto–Charon rotation before closest approach. From the very fast flyby (∼14 km s−1), the nonencounter hemispheres of both bodies were imaged. On Charon, the pixel scale difference between the best images, and those one revolution before are more than 45× worse (Figure 1). Nonetheless, these New Horizons observations of the illuminated nonencounter hemisphere are the best-resolution images of the far-side regions of Charon in existence, and can be investigated in the same way that the nonencounter hemisphere of Pluto was studied by Stern et al. (2021) using New Horizons data. We can use our knowledge of features and processes on the illuminated encounter hemisphere to inform our interpretation of the remaining lower-resolution images of the illuminated nonencounter hemisphere (henceforth the "far side") of Charon.

Figure 1. Long-Range Reconnaissance Imager (LORRI) coverage for one rotation before the New Horizons closest approach. Numbers below each image show the approximate center east longitude on Charon for each image (see the Appendix). The upper left image without a label is the image at 350° reprojected to match the image at 351° to help match features. The images are Lucy–Richardson deconvolved versions of the images from the LORRI sequences listed in Table 1. The two bottom right images are both from the time near closest approach. The 342° image is a deconvolved mosaic of LORRI images from the C_LORRI sequence and the 348° image on the right is Multispectral Visible Imaging Camera (MVIC) image MC0_0299176432. Ground sample distance varies from 40 km pixel−1 for the 351°-labeled image to 0.8 km pixel−1 for the C_LORRI sequence. This entire figure also appeared in Beyer et al. (2017, Figure 10).
Download figure:
Standard image High-resolution imageHowett et al. (2021) discuss the far-side color data from the Ralph color and infrared spectrometer instrument (Reuter et al. 2008). Due to the coarser spatial resolution of Ralph, even fewer spatially resolved details are available in those color data. However, spectral properties over large areas are still identifiable. Howett et al. (2021) conclude that the far-side spectral properties are largely similar to the encounter hemisphere, confirming earlier telescopic observations (e.g., Buie et al. 2010). This lack of color variation implies a certain level of similarity between the encounter hemisphere and the far side.
2. Spacecraft Data
We focus this work on data from the Long-Range Reconnaissance Imager (LORRI; Cheng et al. 2008; Weaver et al. 2020) during the final Charon rotation before closest approach (Table 1), which had the best resolution of any instrument on New Horizons for these areas. A representative example of these images can be seen in Figure 1 where the ground scale of whole-disk images ranges from 40 km pixel−1 (the 351° image in the upper left of Figure 1, PC_MULTI_MAP_A_18_L1AH) up to 0.88 km pixel−1 (the 342° image in the bottom right, C_LORRI: LOR_0299168679 through LOR_0299169016).
Table 1. Images Used in this Work are Found in the Weaver & Finley (2018) Planetary Data System Volume
| Observation | 2015 DoY, | Image ID | Center | Ground Scale |
|---|---|---|---|---|
| UTC | Longitude | (km pixel−1) | ||
| PC_MULTI_MAP_A_18_L1AH | 188, 15:55 | LOR_0298590419 | 351° | 40.4 |
| LOR_0298590420 | ||||
| LOR_0298590421 | ||||
| LOR_0298590422 | ||||
| PC_MULTI_MAP_B_1 | 188, 22:25 | LOR_0298613819 | 336° | 38.8 |
| LOR_0298613820 | ||||
| LOR_0298613821 | ||||
| NAV_C4_L1_CRIT_32_02 | 188, 22:41 | LOR_0298614804 | 336° | 38.8 |
| LOR_0298614834 | ||||
| PC_MULTI_MAP_B_2 | 189, 07:56 | LOR_0298648079 | 314° | 36.5 |
| LOR_0298648080 | ||||
| LOR_0298648081 | ||||
| PC_MULTI_MAP_B_3 | 189, 15:58 | LOR_0298676999 | 295° | 34.5 |
| LOR_0298677000 | ||||
| LOR_0298677001 | ||||
| PC_MULTI_MAP_B_4 | 189, 22:36 | LOR_0298700879 | 280° | 32.8 |
| LOR_0298700880 | ||||
| LOR_0298700881 | ||||
| PC_MULTI_MAP_B_5 | 190, 04:02 | LOR_0298720449 | 267° | 31.5 |
| LOR_0298720450 | ||||
| LOR_0298720451 | ||||
| LOR_0298720452 | ||||
| NAV_C4_L1_CRIT_33_02 | 190, 04:19 | LOR_0298721434 | 266° | 31.4 |
| LOR_0298721464 | ||||
| PC_MULTI_MAP_B_6 | 190, 15:47 | LOR_0298762739 | 239° | 28.5 |
| LOR_0298762740 | ||||
| LOR_0298762741 | ||||
| LOR_0298762742 | ||||
| PC_MULTI_MAP_B_7 | 190, 22:16 | LOR_0298786079 | 224° | 26.9 |
| LOR_0298786080 | ||||
| LOR_0298786081 | ||||
| LOR_0298786082 | ||||
| NAV_C4_L1_CRIT_34_02 | 190, 22:32 | LOR_0298787064 | 223° | 26.9 |
| LOR_0298787094 | ||||
| PC_MULTI_MAP_B_8 | 191, 07:48 | LOR_0298820384 | 202° | 24.6 |
| LOR_0298820394 | ||||
| LOR_0298820404 | ||||
| LOR_0298820414 | ||||
| LOR_0298820424 | ||||
| LOR_0298820434 | ||||
| LOR_0298820459 | ||||
| LOR_0298820469 | ||||
| LOR_0298820479 | ||||
| LOR_0298820489 | ||||
| LOR_0298820499 | ||||
| LOR_0298820509 | ||||
| PC_MULTI_MAP_B_9 | 191, 15:50 | LOR_0298849319 | 183° | 22.6 |
| LOR_0298849320 | ||||
| LOR_0298849321 | ||||
| LOR_0298849322 | ||||
| PC_MULTI_MAP_B_10 | 191, 22:28 | LOR_0298873199 | 167° | 21.0 |
| LOR_0298873200 | ||||
| LOR_0298873201 | ||||
| LOR_0298873202 | ||||
| PC_MULTI_MAP_B_11_02 | 192, 02:38 | LOR_0298888219 | 157° | 19.9 |
| LOR_0298888220 | ||||
| LOR_0298888221 | ||||
| LOR_0298888222 | ||||
| NAV_C4_L1_CRIT_35_03 | 192, 04:11 | LOR_0298893754 | 153° | 19.6 |
| PC_MULTI_MAP_B_12_L1AH_02 | 192, 15:40 | LOR_0298935129 | 126° | 16.8 |
| LOR_0298935130 | ||||
| LOR_0298935131 | ||||
| LOR_0298935132 | ||||
| PC_MULTI_MAP_B_13_02 | 192, 22:09 | LOR_0298958469 | 111° | 15.2 |
| LOR_0298958470 | ||||
| LOR_0298958471 | ||||
| LOR_0298958472 | ||||
| NAV_C4_L1_CRIT_36_02 | 192, 22:28 | LOR_0298959599 | 110° | 15.1 |
| LOR_0298959629 | ||||
| PC_MULTI_MAP_B_14_02 | 193, 07:43 | LOR_0298992884 | 89° | 12.8 |
| LOR_0298992894 | ||||
| LOR_0298992904 | ||||
| LOR_0298992914 | ||||
| LOR_0298992939 | ||||
| LOR_0298992949 | ||||
| LOR_0298992959 | ||||
| LOR_0298992969 | ||||
| NAV_C4_L1_CRIT_37_02 | 193, 08:51 | LOR_0298996974 | 86° | 12.6 |
| LOR_0298997004 | ||||
| PC_MULTI_MAP_B_15_02 | 193, 15:43 | LOR_0299021709 | 70° | 10.9 |
| LOR_0299021710 | ||||
| LOR_0299021711 | ||||
| LOR_0299021712 | ||||
| PC_MULTI_MAP_B_16_02 | 193, 22:21 | LOR_0299045589 | 54° | 9.27 |
| LOR_0299045590 | ||||
| LOR_0299045591 | ||||
| LOR_0299045592 | ||||
| PC_MULTI_MAP_B_17_02 | 194, 02:12 | LOR_0299059449 | 45° | 8.33 |
| LOR_0299059450 | ||||
| LOR_0299059451 | ||||
| LOR_0299059452 | ||||
| PC_MULTI_MAP_B_18_02 | 194, 06:37 | LOR_0299075349 | 35° | 7.25 |
| LOR_0299075350 | ||||
| LOR_0299075351 | ||||
| LOR_0299075352 | ||||
| PCNH_MULTI_LONG_1D1_02 | 194, 14:41 | LOR_0299104383 | 17° | 5.27 |
| LOR_0299104393 | ||||
| LOR_0299104403 | ||||
| LOR_0299104413 | ||||
| PC_MULTI_LONG_1d2a_02 | 194, 21:03 | LOR_0299127274 | 2° | 3.71 |
| LOR_0299127304 | ||||
| LOR_0299127334 | ||||
| LOR_0299127364 | ||||
| C_LORRI_FULLFRAME_1 | 195, 02:42 | LOR_0299147641 | 350° | 2.31 |
| LOR_0299147686 | ||||
| LOR_0299147731 | ||||
| LOR_0299147776 |
Note. The name of the Observation is the REQID from the image labels. The 2015 Day of Year (DoY) and UTC times are from the spacecraft mid-observation time. The Image IDs indicate the instrument (LOR for LORRI) and the mission elapsed time of all the images in a particular observation and can be used to find the filename in the Planetary Data System volume. The central longitude is the approximate east longitude on Charon for the subspacecraft point for the observation Note that Charon's sub-Pluto longitude is defined as 0° although these coordinates may have an error up to 1 45 (see the Appendix). The Ground Scale is the approximate ground scale at the center of the disk.
The LORRI point-spread function has a FWHM of ∼2 pixels (Cheng et al. 2008), which can cause blurring. This blurring can be minimized through Lucy (1974)—Richardson (1972) deconvolution, which has been applied to all images in this study.
Although we characterize the images in Table 1 as far-side images to help interpret those regions of Charon, the images just before closest approach also include some narrow regions of the encounter hemisphere. Inspection of these data can help understand previously identified features, and they provide a basis for interpreting features for which there is no higher-resolution data on the far side.
3. Mapping
Schenk et al. (2018) used the observations in Table 1 to create a single mosaic (Figure 2(a), also released in Stern 2017) that we use to mark geomorphic features upon. However, the resolution of the source images across the far side increases from east to west, as Charon rotated and New Horizons approached. To systematically extract as much geologic information as we can from the limited resolution data that was returned, inspection of the eastern limb and terminator regions of the individual images is important. The eastern reaches of each observation represent the best-resolution data for that area.
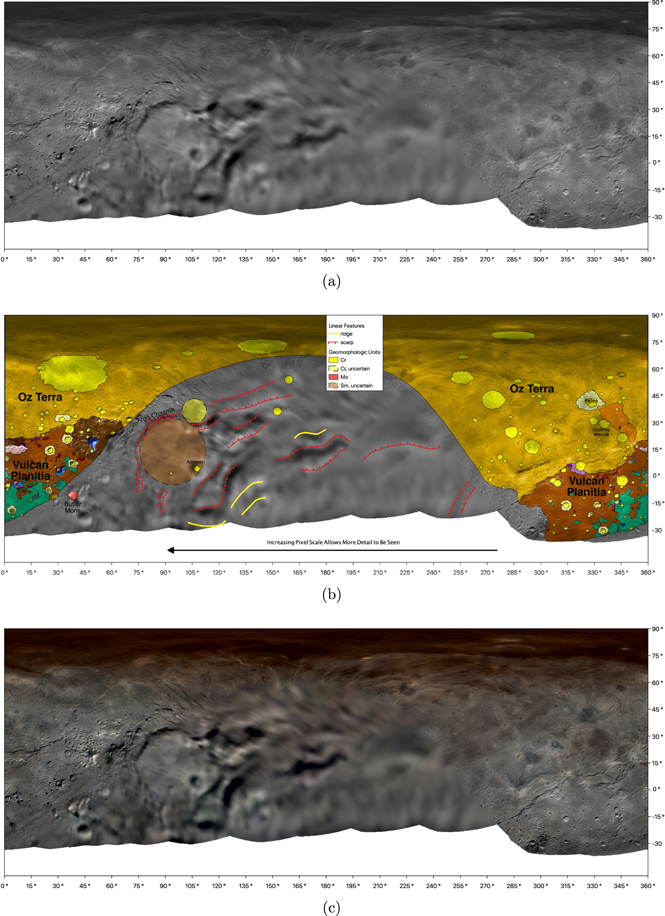
Figure 2. (a) LORRI mosaic (Stern 2017; Schenk et al. 2018) reprojected so that the antimeridian (the anti-Pluto hemisphere) is centered to show the far side of Charon. (b) Geomorphic map of far-side features, with the Robbins et al. (2019) map units of the encounter hemisphere shown filling in the upper left and upper right portions (please see that paper for more details about the units). The legend box only describes those units identified in the far-side area described in this work. (c) Combination MVIC and LORRI mosaic from Schenk et al. (2018) the NIR (870 nm), RED (625 nm), and BLUE (475 nm) MVIC channels are in the red, green, and blue image channels of this mosaic. In all cases, the white areas south of the scalloped border were not illuminated during the flyby.
Download figure:
Standard image High-resolution imageWhile traditional geomorphic mapping techniques begin with a basemap (like the mosaic in Figure 2(a)) and perform all initial mapping activities based on information in the basemap, we instead used the individual images to identify features, recorded their positions on the basemap, and then reprojected this geomorphic map to the observation geometry (e.g., Figure 3) to verify that we had marked each feature correctly, iterating as needed. This modified approach was used to ensure we were consistently using the best quality image of each feature and, for the images soon before closest approach, allowed us to use some topographic shading to help identify features and feature types. It should be noted that the severely changing resolution of the images results in a geomorphic map whose information content also dramatically changes from east to west.
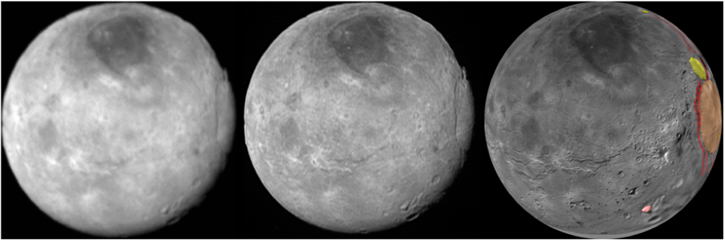
Figure 3. Example of feature map projected to map observation geometry. On the left is an image from PCNH_MULTI_LONG_1D1_02 showing the familiar encounter hemisphere over most of the disk, but we begin to see some far-side surface on the eastern limb of the disk. The center image is the Lucy–Richardson deconvolved version derived from all of the images from PCNH_MULTI_LONG_1D1_02. On the right is the Schenk et al. (2018) basemap, with geomorphic features we have identified on the far side in this area plotted, and then that map is reprojected to an orthographic perspective that matches the observation on the left, so that we can verify that the location of mapped features corresponds with what we see on the left and center images.
Download figure:
Standard image High-resolution imageFeatures were recorded in QGIS (QGIS Development Team 2020) and the geomorphic map exported to GeoTIFF format files (Devys & Lott 2019). We used the SpiceyPy interface (Annex et al. 2020) to the SPICE toolkit (Acton et al. 2018) to extract the subspacecraft point for each observation, and then used the gdalwarp program (GDAL/OGR contributors 2020) to reproject the geomorphic map to an orthographic projection centered at the subspacecraft point. It is important to note two things about the orthographic projection as used here. First, it was intentionally selected instead of a perspective projection to provide more details at the limb, and so for the later observations that were obtained closer to Charon, the orthographic projection shows slightly more terrain than is visible in the observation (e.g., right-hand projection in Figure 3). Second, the effects of the southern terminator are not reproduced in the orthographic map projection. Both of these aspects can be leveraged to help interpret features along the limb and terminator of the images.
Just as the resolution of the observations increases as we move from east to west across Charon's far side, our ability to discern detail and positively identify features also increases, resulting in more mapped features. We attempted to be conservative in mapping only those features which we were confident of, only mapping features that were visible in multiple images. It should also be noted that the lighting direction combined with the Lucy–Richardson deconvolution can produce linear features along the limb which must be inspected carefully.
The geomorphic features identified on the far side in Figure 2 can be compared with the more comprehensive geomorphic map of the encounter hemisphere terrains (Robbins et al. 2019). The Robbins et al. (2019) geomorphologic map had tight, defined boundaries based on reasonable pixel scale (300 m pixel−1) and emission angle (less than 45°) constraints, which prevented full coverage of the encounter hemisphere. Although we do not attempt to combine mapped features in this work with that effort due to the extreme difference in data quality, we can still examine that map to determine what features might be found past its boundaries.
On the encounter hemisphere, there are three primary units that Robbins et al. (2019) mapped: Blocky Terrain (Bl) primarily in Oz Terra, Smooth Terrain (Sm) primarily in Vulcan Planitia, and Rough Terrain (Rt). There is no good evidence that any of these units terminate at their eastern mapped boundary, so those units could be plausibly extended for at least tens, if not hundreds of kilometers eastward (15° at Charon's equator is ∼159 km, Figure 4). The eastern boundary to the Rt unit might be the scarps bounding the possible smooth terrain in Figure 2(b).
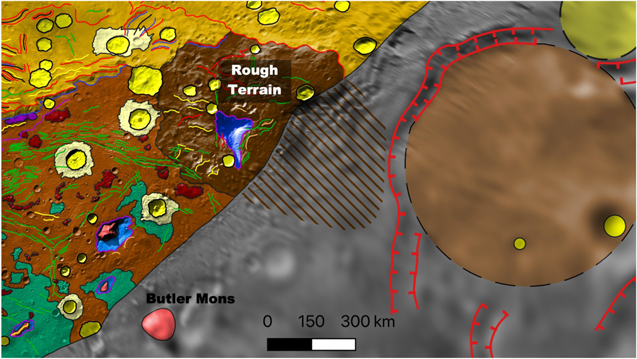
Figure 4. Portion of Figure 2(b), showing the eastern edge of the mapped area of Robbins et al. (2019). The Rough Terrain (Rt) unit likely extends eastward, but by an unknown amount. The striped area outside the Robbins et al. (2019) map boundaries could be the extent of the Rt unit, but it is very difficult to determine accurately.
Download figure:
Standard image High-resolution imageOn the western side of the encounter hemisphere (right-hand side of Figure 2(b)), Robbins et al. (2019) terminated the Smooth terrain at the bounding western scarp of Vulcan Planitia due to its convenient boundary where the high emission angle of the observations makes terrain interpretation more difficult. The raised, unmapped unit to its west does not specifically appear similar to the blocky terrain of Oz Terra, but it is possible that this unmapped unit is what Oz Terra looks like under Sun angles that would highlight topography. It is also possible that the eastern-most scarp pair on the far side that we identify in Figure 2(b) is an extension of Mandjet Chasma, and that this unmapped terrain spanning ∼255°–300° E could form a unique geomorphologic province (Figure 5) although it is likely more of the Bl unit.

Figure 5. Portion of Figure 2(b), showing the western edge of the mapped area of Robbins et al. (2019). The facing scarps identified in the far-side data may be an extension of Mandjet Chasma. The striped area could be more Blocky Terrain (Bl), but it is difficult to determine.
Download figure:
Standard image High-resolution imageFinally, Robbins et al. (2019) included impact craters with diameters ≥15 km and linear features ≥9 km long. It is very clear that craters and linear features between the eastern boundary of their map and the western boundary of this effort exist that would fit those minimum size requirements, such as the large crater near 45° E, −25°, but they are not mapped in Figure 2(b) to focus on terrain ∼±90° from the antimeridian, which is the area of interest for this effort.
4. Interpretations
Although technically on the unmapped encounter hemisphere, Bulter Mons can be seen in images before closest approach (Section 4.1), and we include those images in this work. On the far side, only a few types of features could be reliably identified: craters (Section 4.2), positive relief features like ridges and scarps (Section 4.3), and an area of smooth plains (Section 4.4). They are marked in Figure 2(b).
4.1. Butler Mons and the Smooth Plains of Vulcan Planitia
The area around Butler Mons is an encounter hemisphere area whose interpretation can benefit from examining the sequence of approach images that show this area in lower resolution.
Going backward from the closest approach images, the ability to reliably distinguish the smooth plains from the tectonized areas is lost in images centered on longitude 54° and images taken before that (Figure 1). However, from the 45° image (Figure 6(a)) onward to closest approach, the smooth plains extend past the southern terminator (at approximately −36° latitude), meaning that we cannot reliably determine a southern boundary to Vulcan Planitia.
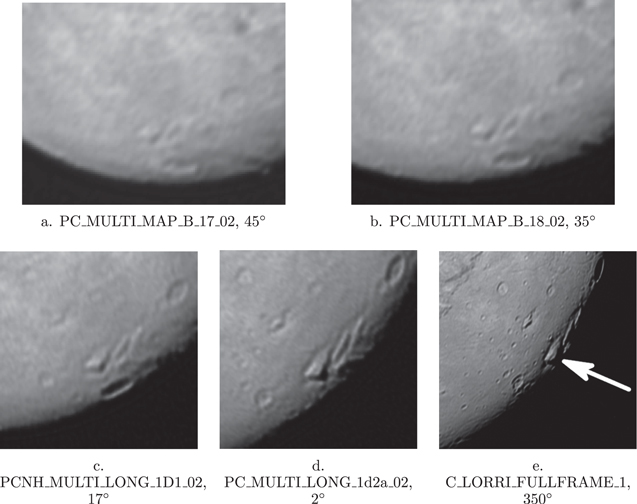
Figure 6. Portions of deconvolved LORRI images which show Butler Mons. The observation REQID and the center longitude from Table 1 are listed for each image The arrow in image (e) points to the peak of Butler Mons.
Download figure:
Standard image High-resolution imageWhile only its peak is illuminated in the image centered on 342° longitude in Figure 1, Butler Mons and the linear sunlit features to its east can be identified in the 70° image and images acquired after it. Beyer et al. (2019) speculated that these sunlit features were north-facing scarps that might define a southern boundary to Vulcan Planitia. Further inspection of these sunlit scarps and the large crater to the south of Butler and its surroundings in the approach images, indicate that the smooth plains wrap around to the south of Butler Mons and the scarps (Figure 6). This encirclement by smooth plains means that Butler Mons and these scarps most likely represent larger versions of the entirely surrounded Kubrik and Clarke Montes. Moreover, examination of these images provides no constraint on the southern extent of Vulcan Planitia. Future stellar occultations may reveal more about these regions of Charon that were below the terminator during the closest approach.
4.2. Craters
Impact craters that are clearly observed on the encounter hemisphere are notable for their varied reflectivity presentation (Robbins et al. 2017, 2019). Some have no brightness distinction from their surroundings, while the most spectacular show concentric bright and dark patterns in the ejecta, which may hint at subsurface layering and structure (Robbins et al. 2019; Singer et al. 2021).
Examination of possible craters on the nonencounter hemisphere must take these reflectivity variations into account. On the encounter hemisphere, Ripley has bright crater walls lit by the Sun, but has a dark floor, and is centered in a dark-toned area about twice the diameter of the crater. Just south of Ripley is Gallifrey Macula, not clearly associated with a large crater. In the lower-resolution images they are only apparent as two dark blobs, and they could easily be misconstrued as two dark-floored craters (even though only one is a crater, and the dark deposit is post-formation, Figure 7). Furthermore, if using only brightness to estimate the size of Ripley, it would be an over-estimate because the dark blob is really the size of the dark patch, not the rim diameter. This "reflectivity interpretation fallacy" is discussed at length in Robbins et al. (2017).
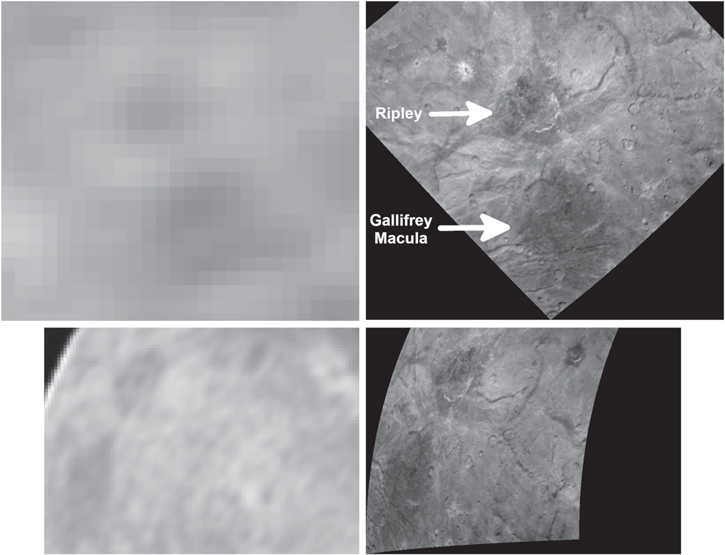
Figure 7. The upper left image is a portion of PC_MULTI_MAP_B_1, and the lower left image is a portion of PC_MULTI_MAP_B_17_02. Both images in the right-hand column are LOR_0299175604 (0.413 km pixel−1) which have been orthoprojected to match the left-hand column images. Gallifrey Macula is a dark area not centered on a crater, whereas there is a dark area centered on Ripley. In the later PC_MULTI_MAP_B_17_02 (lower left, 8.33 km pixel−1), the Lucy–Richardson deconvolution may be picking out the rim of Ripley, but in the very early PC_MULTI_MAP_B_1 (upper left, 38.8 km pixel−1), both areas just show as dark blobs.
Download figure:
Standard image High-resolution imageMost of the bright patches or dark patches surrounded by bright halos seen at low resolution on the encounter hemisphere are associated with impact craters, and so we have some confidence that similar reflectivity patterns on the nonencounter hemisphere are also signatures of craters. However, interpretation of these brightness patterns must be done carefully. There are four such features which are bright-rimmed and dark-centered which are likely to be craters (Figure 8). The westernmost (A) is a small feature centered at 93 °E, to the east of that, Arroway (centered at 108 °E) is a bright-rimmed feature, east and north of Arroway is a crater centered around 153 °E (B), and northeast of that another centered at 156 °E (C).

Figure 8. The center map shows just the craters from Figure 2(b). The bottom left image is a portion of PC_MULTI_MAP_B_16_02 and shows crater A and Arroway. The upper left image is a portion of PC_MULTI_MAP_B_18_02 with the uncertain crater U. The far right image is PC_MULTI_MAP_B_13_02 which shows craters B and C.
Download figure:
Standard image High-resolution imageArroway may appear to have bright rays, but that may be an effect of the deconvolution, as this feature is not as apparent in the original images.
The fifth possible crater centered around 105 °E, 36° (U in Figure 8) is the largest and is not identified on the basis of reflectivity variations but based on the lighting patterns which indicate that it is a morphologic depression.
It is important to note that all of these potential craters do not appear disrupted by any significant scarps or tectonics at scales that we can observe. This lack of disruption implies that the craters are contemporaneous or more recent than the tectonic activity, reinforcing the conclusion that tectonic activity on Charon was ancient (Beyer et al. 2017).
4.3. Ridges and Scarps
Given the illumination direction from the north, large ridges and scarps on the far side can be successfully identified, with an observational bias against those that strike roughly north–south. For example, the facing scarps of Mandjet Chasma (450 km long, 30 km wide, 5–7 km deep, labeled in Figure 2(b)) can be identified as early in the encounter as the 314° image (36.5 km pixel−1, in Figure 9), and prominently on the limb in the 239° image, giving us confidence that we can identify Mandjet-sized features. Of course, it is difficult to know whether any bright-dark lineament pair is a set of facing scarps that form a chasma (like Mandjet), just an asymmetric scarp (like the boundary scarp between Oz and Vulcan east of Serenity), or a ridge. One approach would be to just map all of these bright-dark pais as ridges, but we attempted to discern whether some of those were indeed scarps, and marked them as such (Figure 2(b)). This identification becomes less certain as we move eastward and the resolution decreases. Regardless, mapping and identifying features of this size provides additional context for our understanding of the tectonic processes that were at work on Charon. Additional Mandjet-class lineaments can be identified and are indicated in Figure 2(b) (some were pointed out in Beyer et al. 2017).
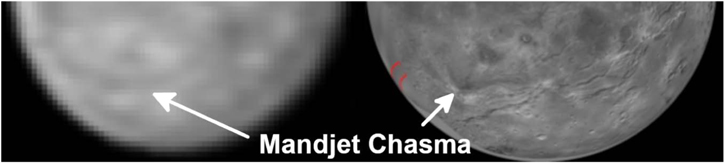
Figure 9. Image showing the PC_MULTI_MAP_B_2 observation on the left and the Figure 2(a) mosaic on the right orthoprojected to match. The arrows show the location of Mandjet Chasma.
Download figure:
Standard image High-resolution imageThe resolution in these images is not good enough to determine what the formation mechanism of the ridges and scarps identified in Figure 2(b) are. However, if global expansion occurred on Charon (Beyer et al. 2017), then it is reasonable to assume that the ridges and scarps we identify in this far-side data are similar to those features seen on the encounter hemisphere, and are likely to be normal fault scarps.
In the region east of Arroway, there are ridges and scarps that appear in groups of three or four and appear to have a roughly common strike direction, these scarps have a spacing between ∼75 and 115 km. This spacing is substantially larger than the rims of Serenity Chasma (50 km wide) or the rims of Mandjet Chasma (30 km wide) on the encounter hemisphere, but there is no particular reason why they should be larger on the far side. If they are graben, then perhaps we are only identifying a single scarp of the pair or the lighting geometries plus the unfavorable resolution are causing the two rims of the graben to blur into a single apparent lineament. They could also be aligned, large, single scarps that may be more like bookshelf extensional faulting than graben.
The 25 largest graben on the encounter hemisphere identified in Beyer et al. (2017) have a median length of 93 km, but the ridges and scarps identified in Figure 2(b) have a median length more than twice that: 213 km. There is no particular reason to think that features are twice as large on the far side, and this apparent doubling in median length is most likely a result of not being able to clearly resolve these features. What we may be identifying as a single scarp may be segmented into multiple aligned features. The far-side images do not have the resolution to allow us to measure the plan-form offset represented by these scarps, if they are normal faults. We will assume an extension of 3 km, which was the smallest amount of extension among the 25 largest graben on the encounter hemisphere. Beyer et al. (2017) divided the area increase of those 25 features by a quarter of the surface area of Charon (which represents the observed surface area of Oz Terra) to arrive at a 1% areal strain estimate, and doing the same with the area of these far-side scarps (divided by 40% of the surface area of Charon which accounts for the observed area of the far side) also yields ∼1%. This 1% areal strain for the far side is a minimal estimate, as the area increase for the scarps could be larger, and there is likely faulting that is not observed and accounted for. However, this estimate indicates that the strain rate is similar on the encounter hemisphere and the far side.
4.4. Inferred Smooth Plains
In addition to the features that were mapped in Figure 2(b), it is also instructive to examine the "negative space" in the geomorphic map (areas where no features are identified). At least one interesting feature west of the antimeridian may be revealed by examining this negative space. The eastern half of the far-side area suffers from the lowest resolution of the image set, and even though there are large areas without mapped features, that is likely more of an observation bias than a real signal.
Schenk et al. (2018) pointed out the region interior to the curve of Argo Chasma as having a different texture than terrain exterior to the curve of Argo Chasma, and they speculated about whether or not it was an extension of Vulcan Planitia. Examining the negative space in Figure 10 in this area indicates that the area interior to the curve of Argo Chasma may describe a large circular unit more than 400 km in diameter.
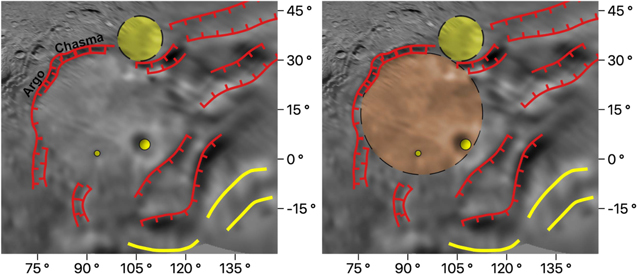
Figure 10. Image showing a portion of the map from Figure 2(b) without the inferred smooth plains on the left, and with them mapped on the right.
Download figure:
Standard image High-resolution image
There is enough resolution in the images west of the antimeridian to clearly indicate major scarps, and this large circular feature is devoid of large scarps or significant features, and so we interpret it to be a plains unit (Figure 10). Argo Chasma forms the northwest quadrant of the boundary of this plains unit. There are some chasmata or scarps to the southwest that appear to truncate at what might be the southwest arc of this circular feature, and there is a scarp to the southeast that is facing the wrong way to be a bounding scarp but nevertheless indicates a boundary to the unit. The conspicuous lack of large scarps within this approximately circular area—when they are so identifiable elsewhere west of the antimeridian—is significant. The limb profiles do not cover this region, because a sliver of the terminator reaches up to obscure the limb in those images (Conrad et al. 2021). However, inspection of this region in images centered on longitude 17° through 350° show that even though the feature may be circular in plan-form, it is not significantly depressed in elevation relative to its surroundings, so it is not just a large impact basin. There are not sufficient data to determine if this circular plains unit is filling a large impact basin, or if the boundaries are just suggestive of circularity, perhaps an alignment of arcuate features.
Given the low resolution of the images and the identification of scarps to the west and southwest of this plains unit, it is difficult to know if it is an extension of Vulcan Planitia, but it does appear to be topographically smooth, and even if it is not connected, it is likely another large expression of cryovolcanic flow on Charon's surface.
4.5. Absence of Montes
Only a handful of montes were identified on the encounter hemisphere, and only in the vast equatorial plains (Beyer et al. 2017, 2019; Robbins et al. 2019), and so an expectation for their presence on the far side depends on whether the terrain is more like the smooth plains of Vulcan Planitia where we might expect similar significant crustal disruption, or whether the terrain is more like Oz Terra, where we find none. The analysis in Sections 4.3 and 4.4 implies that far-side terrain is largely similar to what is observed on the encounter hemisphere, although there does not seem to be a smooth area as large as Vulcan Planitia, but there may be some smaller areas. Additionally, as these features are relatively small in area, the reduced resolution of the far-side images do not easily lend themselves to finding montes, even if they do exist there.
We labeled Butler Mons (Figure 2(b)) in Vulcan Planitia, but could find no other certain examples.
5. Conclusions
We have demonstrated that geomorphic features can be identified in the Charon far-side New Horizons data. Primarily, we can identify craters and scarps, which indicate that the patterns of crustal disruption identified on the encounter hemisphere extend all the way around Charon. This pattern is expected if the crustal disruption was from a uniform process of global crustal expansion as discussed in Beyer et al. (2017). The scarps identified in the far-side data have a median length twice that of those on the encounter hemisphere, which may either be the result of poor resolution (where we identified a single scarp, there may in fact be two or more) or could be the effect of not having a large area of smooth plains in the region, which may have altered the specific crustal response, although the estimated strain is similar.
Numerous impact craters greater than 10 km are visible beyond the Robbins et al. (2019) mapping area as we transition to poorer pixel scale images in the far side that preclude small impact crater identification. An insufficient number of craters were identified in the far-side data to make definitive conclusions about crater distributions here, but it is likely similar to those areas that are better imaged on the encounter hemisphere.
Identification of smooth plains areas is difficult in the far-side data, due to the reduced resolution, but we have identified at least one large smooth plains area (by the lack of large scarps across a 400 km diameter area), and others may exist.
The extent of the large equatorial smooth plains identified on the encounter hemisphere (Beyer et al. 2019; Robbins et al. 2019) is unknown. However, the far-side data can help constrain that extent. The Oz Terra/Vulcan Planitia boundary describes the arc of a great circle that can be extended to the far-side data, and large scarps are clearly seen south of that line, indicating that Vulcan Planitia does not occupy half of Charon (and thus there is not a planetary dichotomy).
Tectonized areas and smooth plains occur in different areas across Charon's surface, and the far-side data shows us features consistent with the hemisphere observed closely by New Horizons, helping us better understand this icy world.
This research has made use of NASA's Astrophysics Data System. This material is based upon work supported by the National Aeronautics and Space Administration via the New Horizons Project (NASW02008).
Software: ISIS (Adoram-Kershner et al. 2020), QGIS (QGIS Development Team 2020), SpiceyPy (Annex et al. 2020), the SPICE Toolkit (Acton 1996; Acton et al. 2018), and GDAL (GDAL/OGR contributors 2020).
Appendix: Longitudes
It should be noted that there appear to be some issues with the current NAIF planetary constants kernel (pck00010.tpc, and are not expected to be corrected with pck00011.tpc), which results in a sub-Charon longitude on Pluto, and a sub-Pluto longitude on Charon, of ∼145 (when it should be identically zero). The longitudes and latitudes used here are calculated in that system (to be consistent with previously published maps). If the reader is working in a coordinate system where the sub-Pluto and sub-Charon points are correctly zero longitude, then subtracting ∼145 from the longitudes indicated here is needed.
Footnotes
- 9
This place name and others here are informal, while some have been approved by the IAU (Beyer & Showalter 2021).