


Abstract
We imaged a set of carbonaceous chondrites from the CM2, CO3, CV3, and CK4 groups using the qualification model of MasCam, the camera on board the asteroid lander MASCOT, which touched down on asteroid Ryugu in 2018 October. A CI1 meteorite was also imaged but excluded from the analysis due to prominent terrestrial weathering. Following the methods used to image the rock on Ryugu, we placed a total of 14 meteorites approximately 20 cm in front of the camera to achieve a spatial resolution of about 0.2 mm per pixel and illuminated the samples with onboard light-emitting diodes of four different colors in the visible wavelength range. We mapped bright and dark inclusions within the meteorites and derived the inclusion brightness relative to the matrix in the red light, the relative spectral slope of each inclusion, the inclusion size frequency distribution and the matrix volume abundance. We find that the meteorite groups overlap within these parameters, but individual samples, as well as individual inclusions, can have deviating values. Terrestrial weathering appears to have no systematic influence on these parameters. Relating our analysis to the inclusions found in the rock on Ryugu, we find that the spectral parameters of Ryugu's inclusions fit well in the parameter space of the carbonaceous chondrites. Compared with the most common types of carbonaceous chondrites, Ryugu's rock has larger inclusions (mean diameter: 0.63 ± 0.91 mm) and a higher upper limit to the matrix abundance (92.4 vol%).
Export citation and abstract BibTeX RIS

Original content from this work may be used under the terms of the Creative Commons Attribution 4.0 licence. Any further distribution of this work must maintain attribution to the author(s) and the title of the work, journal citation and DOI.
1. Introduction
Chondrite meteorites are the oldest and most primitive rocks of the solar system and predominantly consist of chondrules, refractory objects (calcium-aluminum-rich inclusions (CAIs) and amoeboid olivine aggregates), FeNi metal, and fine-grained matrix. Refractory inclusions, chondrules, and FeNi metal formed very early in the solar nebula by high-temperature processes including condensation and evaporation. In contrast, fine-grained matrix consisting of silicates, oxides, sulfides, and carbon-rich material formed at much lower temperatures. Mixing and accretion of high- and low-temperature fractions finally lead to the formation of chondritic rocks. The carbonaceous chondrite meteorites are the most volatile-rich and least thermally processed of the chondrites and are the closest to matching the bulk composition of the Sun (Greshake & Fritz 2018). As such, they are of greatest interest also for comparison with C- and K-type asteroidal material (Clark et al. 2009; Greenwood et al. 2020).
JAXA's Hayabusa2 sample-return mission arrived at the near-Earth asteroid (162173) Ryugu in 2018 June (Watanabe et al. 2019). Ryugu is a top-shaped rubble pile asteroid (950 m in maximum diameter) comprising fragments that re-accumulated after a catastrophic disruption of its parent body (Watanabe et al. 2019). Compositionally, Ryugu is classified as a Cb-type asteroid (Sugita et al. 2019) and is suggested to be linked to carbonaceous chondrites (Wada et al. 2018; Jaumann et al. 2019; Sugita et al. 2019), and its comparatively low albedo (4.5% at 0.55 μm) best matches thermally or shock-metamorphosed carbonaceous chondrites (Kitazato et al. 2019; Sugita et al. 2019). A detailed compositional analysis will be possible upon the return of the samples collected in two touchdown maneuvers in 2019 February and July. The samples were returned to Earth on 2020 December 6 (Tsuda et al. 2020).
In preparation for the sample collection and for obtaining ground truth for the collected samples, Hayabusa2 deployed two MINERVA-II1 rovers (Yoshimitsu et al. 2017) and its Mobile Asteroid Surface Scout (MASCOT) onto the surface of Ryugu in 2018 September and October (Jaumann et al. 2019; Tsuda et al. 2020). MASCOT observed Ryugu's surface with four scientific instruments (Ho et al. 2017): a camera, MasCam (Jaumann et al. 2017); a radiometer, MARA (Grott et al. 2017); a magnetometer, MasMag (Herčík et al. 2017); and a near-infrared spectrometer, MicrOmega (Bibring et al. 2017). After being deployed onto Ryugu's surface from a height of 41 m, MASCOT landed on a bare, dust-free rock where it operated for two Ryugu days (17 hr) before the battery was empty (Jaumann et al. 2019). MasCam, equipped with an LED array allowing the illumination of the surface during the night, imaged the landing site rock in detail with spatial resolutions up to 0.2 mm pixel−1. The LED illumination enabled the identification of millimeter-sized bright inclusions with red, neutral, and blue spectral slopes within the Ryugu rock (Schröder et al. 2021). These inclusions were suggested to be a mixture of chondrules and refractory inclusions, leading to the conclusion that Ryugu's rock is linked to carbonaceous chondrites (Jaumann et al. 2019). The accompanying MASCOT instruments including the radiometer MARA and the Magnetometer MasMag revealed a high porosity and missing magnetic field in agreement with expectations for carbonaceous material (Grott et al. 2019; Hercik et al. 2020). The spectrometer MicrOmega was not able to take any measurement.
In our previous work, we analyzed the size distribution and spectrophotometric characteristics of inclusions identified in the Ryugu rock imaged by MasCam and found that Ryugu's rock does not easily fit into the carbonaceous chondrite categories (Schröder et al. 2021). The inclusions in Ryugu's rock are large compared to those in the most common carbonaceous chondrites but are closest in size to those in CR2 and CV3 carbonaceous chondrites. In contrast, matrix abundance in Ryugu's rock is most similar to that in CM2s. However, the data on matrix abundance and inclusion size distributions in the millimeter size range for meteorites that were published are relatively limited compared to what is published on petrographic analyses that are nowadays possible in the laboratory. A comparatively old data set on inclusion size distributions in carbonaceous chondrites in the millimeter range from King & King (1978) proves difficult to relate to in situ measurements from Ryugu, which will be addressed in this work. We note that it has been suggested that material from a Ryugu-like body may not survive the entry into Earth atmosphere given its high porosity (Grott et al. 2019) and that a corresponding meteorite analog may not be present in our collection on Earth.
In this work, we aim to bridge the gap of information in the size range accessible to in situ observations by imaging a set of well-characterized carbonaceous chondrites. We obtained these meteorites from the meteorite collection of the Natural History Museum in Berlin and used the MasCam qualification model (QM) to image them under similar conditions to MasCam on Ryugu. We investigate the visual comparability of in situ images of Ryugu and images of carbonaceous chondrites obtained in the laboratory and discuss whether such comparisons can be used as guidance for the upcoming returned sample analysis and for future missions with in situ experiments, such as the MMX mission.
2. Data
2.1. MasCam Specifications
MasCam and its QM possess a 1024 × 1024 CMOS detector behind a Scheimpflug optical layout (Scheimpflug angle: 7.395°). This allows an image to be in focus at varying distances from the camera. The optical axis is tilted 22° downward in relation to the camera mounting so that the entire scene along the camera's depth of field, from 15 cm to the local horizon, is in focus. At a distance of 15 cm, the pixel resolution reaches a minimum of 0.15 mm (Jaumann et al. 2017). MasCam is equipped with a four-color LED array (36 LEDs per color) with wavelength centered at 471 nm (blue), 532 nm (green), 630 nm (red), and 809 nm (near-infrared) (Table 1, Figure 1). The LED array is located 2 cm below the aperture. It allows the illumination at night to derive spectral information in the visible to near-infrared wavelength based on the four colors of the LEDs (Jaumann et al. 2017). The image depth of MasCam is 14 bits.
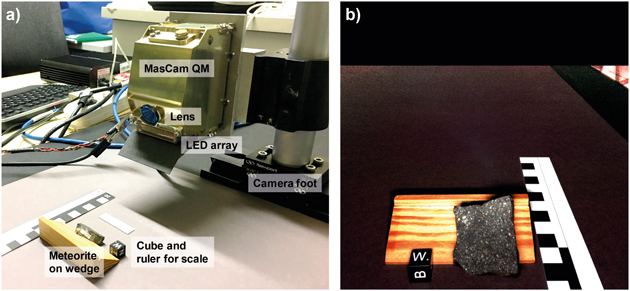
Figure 1. Experimental setup (a) and color composite image of Murchison taken by the QM. The black bar on the top of (b) is manually removed background.
Download figure:
Standard image High-resolution imageTable 1. Wavelength of the Four Color LEDs on MasCam's LED Array
| Color | Abbreviation | Wavelength (nm) |
|---|---|---|
| Blue | B |

|
| Green | G |

|
| Red | R |

|
| Near-infrared | IR |

|
Note. The errors on the wavelength are the FWHM. From Schröder et al. (2021).
Download table as: ASCIITypeset image
2.2. Description of the Studied Carbonaceous Chondrites
The carbonaceous chondrites selected for the present study cover the range of major carbonaceous chondrite groups. CI and CM chondrites are the most carbon-rich carbonaceous chondrites and have experienced severe aqueous alteration on their parent body/bodies. In CI chondrites nearly all anhydrous silicates have been altered to phyllosilicates, while in CM chondrites many very small chondrules and CAIs have been preserved. Neither of these meteorite types has experienced thermal metamorphism. In contrast, CO and CV chondrites are at most only weakly altered but have experienced thermal metamorphism to different degrees. Both types contain abundant chondrules and CAIs, with COs being much more fine-grained. CK carbonaceous chondrites are thermally altered at even higher temperatures compared to CVs and COs and have a high abundance of matrix. They contain large up to 1 mm size chondrules, rare CAIs, and do not contain any FeNi metal.
None of the samples used has been subject to any kind of destructive research work, and the investigated surfaces are free of artificial marks. Most meteorite surfaces were rough and fractured, in analogy to the rocks on Ryugu, but some of them were cut or possessed a fusion crust from the entry into Earth's atmosphere. The latter surfaces were not considered in this work, but we also investigated the influence of the surface structure (cut or fractured) on the identification of inclusions (Section 4.1).
3. Method
3.1. Experimental Setup
In order to achieve comparability with the measurements taken on the surface of Ryugu, we mounted the MasCam QM on a stand approximately 10 cm above the surface of our experiment table. The table was covered with uniformly gray paper on which we placed the meteorite samples about 20 cm in front of the camera. We arranged the meteorite surface to be imaged approximately perpendicular to the boresight vector of the camera lens by using small wooden wedges when necessary. For scale we also imaged a 1 cm cube and millimeter labeled measuring stick (Figure 1).
We then darkened the room completely and imaged each of the 14 meteorites listed in Table 2 using only the illumination in each of the four LED colors. Where possible, we imaged multiple sides of the meteorites and also included flat cut and rough fractured surfaces to analyze the effect of the surface structure on the identification of inclusions. This summed up to a total of 23 image setups (Table 3). For some meteorites, multiple pieces were available, allowing us to evaluate the variability of inclusion distributions within different samples of the same meteorite. Furthermore, we imaged the same surface at different perspectives of the largest piece from the Murchison meteorite to analyze the effect of the sample orientation on the inclusion identification. For every image, we adjusted the exposure time according to the reflectivity at a given wavelength to make maximum use of the camera's full dynamic range of 14 bits while ensuring that there were no under- or overexposed pixels. In exceptional cases we allowed a few overexposed pixels that were presumably due to specular reflection on crystal facets. We defined overexposure as the signal exceeding 10,500 DN, the threshold for which the nonlinearity correction is invalid (Jaumann et al. 2017). Table 3 summarizes the setup parameters for each meteorite imaged.
Table 2. List of Carbonaceous Chondrites Imaged with the MasCam Qualification Model at the Natural History Museum in Berlin
| Meteorite Name | Petrographic Type | Collection | Year |
|---|---|---|---|
| Allende | CV3 | Fall | 1969 |
| Colony | CO3 | Find | 1975 |
| El-Quss | CM2 | Find | 1999 |
| Karoonda | CK4 | Fall | 1930 |
| Lancé | CO3 | Fall | 1872 |
| Mighei | CM2 | Fall | 1889 |
| Murchison | CM2 | Fall | 1969 |
| Murray | CM2 | Fall | 1950 |
| Ningqiang | C3-ungrouped | Fall | 1983 |
| Nogoya | CM2 | Fall | 1879 |
| NWA 11118 | CM2 | Find | 2016 |
| Orgueil | CI1 | Fall | 1864 |
| Ornans | CO3 | Fall | 1868 |
| Warrenton | CO3 | Fall | 1877 |
Note. Note that we imaged Orgueil (CI1) but excluded it from the analysis due to surficial terrestrial weathering (Figure 6).
Download table as: ASCIITypeset image
Table 3. Sample Characteristics and Experimental Parameters Used to Image Carbonaceous Chondrites
| Meteorite Name | Meteorite Mass (g) | Analysis Area (cm2) | Surface Structure | Camera Meteorite Distance (cm) | Camera Height (cm) | Exposure Time Red (ms) | Exposure Time Green (ms) | Exposure Time Blue (ms) | Exposure Time IR (ms) |
|---|---|---|---|---|---|---|---|---|---|
| Allende big | 219.2 | 22.3 | cut | 15.9 | 10.1 | 700 | 800 | 1100 | 1500 |
| Allende small | 79.2 | 1.3 | fractured | 16.2 | 9.6 | 500 | 500 | 700 | 900 |
| Colony | 3.1 | 1.7 | cut | 15.2 | 8.5 | 700 | 900 | 1500 | 1500 |
| El-Quss | 4.5 | 3.2 | cut | 13.4 | 7.5 | 700 | 700 | 1100 | 1600 |
| Karoonda side 1 | 15.5 | 7.9 | fractured | 15.6 | 9.4 | 550 | 550 | 800 | 1000 |
| Karoonda side 2 | 15.5 | 6.0 | fractured | 16.7 | 9.4 | 800 | 800 | 1200 | 1600 |
| Lancé side 1 | 62.2 | 10.3 | fractured | 15.1 | 9.6 | 500 | 500 | 700 | 1100 |
| Lancé side 2 | 62.2 | 6.4 | fractured | 15.1 | 9.6 | 550 | 550 | 800 | 1200 |
| Mighei side 1 | 18.5 | 6.5 | fractured | 14.6 | 8.9 | 300 | 300 | 400 | 600 |
| Mighei side 2 | 18.5 | 4.7 | cut | 14.7 | 8.9 | 800 | 800 | 1000 | 1400 |
| Murchison big tilt 1 | 118.0 | 9.8 | fractured | 15.8 | 9.6 | 400 | 300 | 450 | 900 |
| Murchison big tilt 2 | 118.0 | 7.6 | fractured | 15.8 | 9.6 | 700 | 700 | 1000 | 1300 |
| Murchison slap | 35.4 | 17.6 | cut | 16.1 | 9.6 | 700 | 700 | 1200 | 1500 |
| Murchison small | 11.2 | 6.2 | fractured | 14.6 | 8.0 | 600 | 600 | 900 | 1200 |
| Murray | 6.7 | 1.4 | fractured | 14.3 | 7.5 | 600 | 600 | 800 | 1200 |
| Ningqiang side 1 | 9.0 | 3.2 | fractured | 15.0 | 8.5 | 500 | 450 | 600 | 800 |
| Ningqiang side 2 | 9.0 | 3.2 | fractured | 15.0 | 8.5 | 600 | 550 | 800 | 1100 |
| Nogoya | 1.3 | 1.1 | fractured | 14.3 | 7.5 | 800 | 800 | 1200 | 1400 |
| NWA 11118 side 1 | 1.8 | 2.0 | fractured | 14.1 | 7.8 | 700 | 700 | 1000 | 1400 |
| NWA 11118 side 2 | 1.8 | 1.3 | fractured | 14.1 | 7.8 | 1300 | 1500 | 2300 | 2500 |
| Orgueil | 114.3 | ⋯ | fractured | 17.4 | 10.7 | 700 | 700 | 1100 | 1700 |
| Ornans | 8.0 | 5.0 | fractured | 17.7 | 8.5 | 700 | 700 | 1100 | 1500 |
| Warrenton | 5.7 | 2.6 | fractured | 18.0 | 8.5 | 700 | 700 | 1000 | 1300 |
Note. The first column states the names of the meteorites. If multiple pieces of the same meteorite were imaged, we added a descriptive word (e.g., big, small, side, tilt, slap) to identify the different pieces or imaging conditions. The camera meteorite distance was calculated from the camera height and the mean horizontal distance between the meteorite and camera foot considering the expansion of the imaged meteorite and the location of the aperture in the camera (Figure 1). Note that we imaged Orgueil (CI1) but excluded it from the analysis due to surficial terrestrial weathering (Figure 6).
Download table as: ASCIITypeset image
The camera's distance to the meteorites plays a crucial role in the determination of the inclusion sizes. As shown in Figure 1(a), the camera was attached at about 10 cm above the surface at which the meteorites were positioned. Therefore, we had to calculate the distance between the camera and the meteorites from measurements of the camera height and the horizontal distance between the camera stand and the meteorite. We validated this estimate by calculating the apparent size of a 1 cm-size cube, which we imaged next to the meteorite.
3.2. Image Calibration
All image acquisitions were performed in a darkened room except for reference images, for which we temporarily switched on the room lights generating a diffuse illumination condition. The meteorite imaging campaign was performed over the course of several days. We started every day by acquiring nine bias images. A bias image is an image taken with a minimum exposure time of 0.2138 ms. We constructed a bias frame as the median over these images. For each meteorite we acquired the following set of images: five reference images in room light followed by a sequence of 10 images for each LED color (40 in total). Each set of 10 images comprised five LED-illuminated images and five dark (nonilluminated) images, with each LED-illuminated image immediately followed by a dark image with the same exposure time. Each image was corrected for bias using the bias frame for that day, and the result was corrected for nonlinearity. For each of the five image pairs, the corrected dark image was subtracted from the preceding, corrected illuminated image. The calibrated image (with units of DN/ms) was constructed as the median of the five dark-subtracted images, divided by the exposure time and a color flat field. A flat field for each color had been created at the start of the experiment by imaging a BaSO4 plate parallel to the bottom of the camera, which was at a height of 7.5 cm (five image pairs per color, alternating illuminated and dark). Division by these color flat fields corrected, to first order, differences in illumination over the field of view. However, we note that the correction does not consider the three-dimensionality of the meteorites imaged, which introduces different illumination patterns for each color. For larger meteorites, such as the big piece of Allende, the correction may be less adequate than for smaller meteorites.
3.3. Inclusion Mapping
Using a red, green, and blue radiance color composite image, we mapped inclusions within meteorites imaged by the QM using ArcGIS's mapping tools. We define an inclusion as a distinctly bright or dark region within the surrounding matrix and include all features regardless of their shapes. Mapped inclusions therefore comprise chondrules as well as refractory inclusions. This definition of inclusions also implies that the derived matrix abundance represents an upper limit, because inclusions smaller than the image resolution cannot be resolved and are thus considered as matrix. Without assigning a spatial reference, we outlined inclusions as polygons and converted these polygons into a raster data set of the same size as the QM images (1024 × 1024 pixels). Within this data set, all pixels belonging to the same inclusion/polygon have a distinct number, allowing a straightforward subsequent analysis of the color and size of each individual inclusion. Note that due to the Scheimpflug principle, the pixel resolution increases toward the bottom of the image.
Before identifying inclusions in the images, we first determined the outline of an area of interest on the meteorite. For each meteorite we enclosed an area of similar distance and orientation to the camera by locating a region of similar texture and brightness in the image. In general, this region was a fractured or cut surface of the meteorite. Features such as labels or fusion crusts on the outside of the meteorite were not considered in this area of interest. We then mapped the most prominent inclusions first. The subsequently mapped inclusions were identified with an increasingly smaller field of view so that each location was looked at multiple times at different spatial resolutions. When an inclusion had similar brightness values to the matrix, we compared the inclusion in question to other inclusions of similar brightness and morphology in the context of the entire area of interest. In nondefinite cases the features were not mapped. The minimum size of mapped inclusions was one pixel (∼0.2 mm). The area of the region of interest that was not mapped as an inclusion is considered to be matrix.
To determine the area of the matrix and inclusions, we assumed that each image pixel showing the meteorite surface had the same distance to the camera, which we tried to achieve by placing the meteorite surface to be analyzed perpendicular to the boresight vector of the camera aperture. We derived the distance of the meteorite from the camera (Table 3) to calculate the pixel resolution and additionally verified the pixel resolution from the distance and the size of the 1 cm cube using its location inside the image. Each inclusion area was then calculated from the number of pixels and their resolutions.
4. Results and Interpretation
We investigated 23 images of 14 different carbonaceous chondrites. An example showing the QM image of Murchison (big tilt 1), the inclusion mapping, and the average inclusion and matrix radiance at each LED wavelength is given in Figure 2. To gain insight into the meteorites' spectral and inclusion properties, we generated three plots (Figures 3, 4, 7, and 9). In the first plot, we show the ratio between the brightness of the inclusions and the brightness of the matrix in the red LED image (relative R brightness) as a function of the inclusion size. Here we include all pixels that were mapped as inclusions and average their values. We note that this approach only allows us to distinguish between a meteorite with all neutrally colored inclusions and a meteorite with equal numbers of blue- and red-colored inclusions by looking at a range of values and the standard deviation on the average value, which should be larger in the second case compared to the first. The size is given in square millimeters as well as the diameter of a circle with the same area as the mapped inclusion. The second plot shows the relative spectral slope, (R – B)/B, where R and B are the red and blue radiance, respectively. A positive spectral slope means a reddish color and a negative spectral slope denotes a bluish color. In both plots, the spectral values for all inclusions have been averaged and are presented as a data point with error bars according to the standard deviation. The inclusion size is presented by the median size and the 25th and 75th percentile as errors bars. We used this representation instead of the mean and standard deviation, because the large variation in inclusion sizes occasionally results in errors that are larger than mean value, giving the unphysical impression that inclusions could have negative sizes. A third plot shows the cumulative inclusion size distribution of the mapped inclusions. Combined cumulative inclusion size distributions of more than one meteorite are derived by simply combining the lists on mapped inclusion sizes into one data set. Plots of individual images in combination with an inclusion and matrix spectrum and a color composite image of the meteorite with its mapped inclusions are available in the figure set in the Appendix.
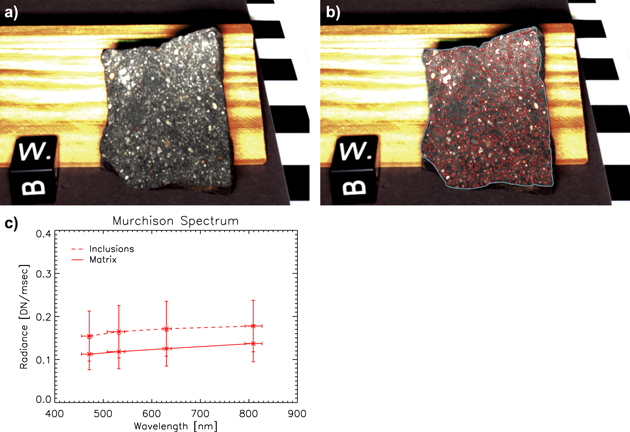
Figure 2. Example of the QM image of Murchison (big tilt 1) (a), the identified inclusions in red and the mapping area in blue (b), and the spectrum of inclusions (dashed red line) and matrix (solid red line) (c). The errors on the wavelength are the FWHM according to Table 1. The spectral slope of the inclusions ((R – B)/B) is 0.12 ± 0.11 and the relative brightness between inclusions and matrix at the red wavelength (relative R brightness) is 1.37 ± 0.51. The matrix volume abundance is 71.1%.
Download figure:
Standard image High-resolution image
Figure 3. Relative brightness (a), spectral slope (b), and cumulative size distribution (c) of fractured and cut surfaces in comparison. The median inclusion size and the 25th and 75th percentile are shown in (a) and (b). The two black arrows indicate the same fractured surface of Murchison that was imaged from two different orientations. In (c), these two surfaces are indicated by the dotted lines. (d) lists the matrix volume abundance. In the case of Murchison, for which multiple surfaces were imaged, the mean and standard deviation is shown.
Download figure:
Standard image High-resolution imageWe also estimated the areal inclusion density by simply dividing the total inclusion area by the mapping area. The areal density can be assumed to be equal to the volumetric density following the Delesse Principle (Royet 1991).
In the following, we will first investigate the influence of the measuring setup and sample preparation on the spectral and petrographic parameters (Section 4.1). We will then focus on the variations observed within one meteorite (Section 4.2), within the different carbonaceous chondrite groups (Section 4.4) and the effect that terrestrial weathering might have on the spectral parameters (Section 4.4). Finally, we will put our results into context with previous investigations (Section 5.1) and the asteroid Ryugu (Section 5.2).
4.1. Influences of the Meteorite Surface Structure and Orientation
To investigate the influence of surface structure on the identification of inclusions in the meteorites, we imaged, next to fractured surfaces, three cut surfaces of meteorite falls including Allende (CV3) and Mighei and Murchison (CM2) and mapped the inclusions using the same procedure as for the images of the fractured surfaces. Figure 3 shows the relative brightness, spectral slope, and inclusion size distribution in comparison with the fractured surfaces. The variations in relative brightness and spectral slope of individual inclusions are too large to allow a clear distinction between the different surface textures. The cumulative inclusion size distribution appears to be shifted toward both larger and smaller values for the cut pieces compared to the fractured ones. The same can be observed for the matrix volume abundance, which is also larger and smaller for the cut surfaces (Figure 3(d)). It is therefore not possible to state if a cut meteorite surface leads to a systematic error in evaluating the inclusion size distribution. Moreover, the slope of the cumulative size distribution in the near-linear region (around 50%) is similar for all samples, which implies that the rate of decrease in inclusion number with increasing size is similar for all meteorites. Thus, there is no systematic effect on the relative R brightness, spectral slope, inclusion size distribution, and matrix volume abundance caused by the texture of the meteorite surface.
Using Murchison, we imaged the same meteorite surface at two different orientations to investigate the influence of the imaging setup on the inclusion identification (Murchison big tilt 1 and 2). Compared to the first meteorite orientation in front of the QM, the second orientation was upside down. The variations in the relative brightness and spectral slope are minimal; however, the size distribution varies significantly. The two distributions (red dotted lines in Figure 3(c)) deviate at larger inclusion sizes, so that the median inclusion size is  mm and
  mm for the two distributions. This also influences the apparent matrix abundance, which is given by 78.9 vol% and 85.0 vol% for the two measurements. The large variation between the two distributions is related to distortion effects that occur for different surface orientations and distances to the QM. We assumed in our analysis that the meteorite surface had the same distance to the camera at all locations, and this example shows that a deviation from this assumption can have a significant influence on the inclusion size distribution. This is particularly prominent for meteorites that cover a larger area within the image and the Murchison used in this example was one of our largest meteorites. It is therefore necessary to point out the high degree of measurement uncertainty that can derive from the orientation and position of larger meteorites. It also emphasizes the necessity to know the exact topography when analyzing in situ images of Ryugu (Section 5.2). The structure of the meteorite surface (cut of fractured) influences the parameters derived to a similar degree.
4.2. Variations within One Meteorite
We imaged different fractured surfaces of the same meteorite piece to analyze the variation within one meteorite (Figure 4). This was done for Murchison, Ningqiang and NWA 11118 (CM2), Lancé (CO3), and Karoonda (CK4). For Murchison we also included the same side that was imaged from two different directions as mentioned in Section 4.1. We exclude NWA 11118 from the following analysis as it is a find, and thus, the weathering history is unknown.

Figure 4. Relative brightness (a), spectral slope (b), and cumulative size distribution (c) of different fractured surfaces of the same meteorite in comparison. Only fractured surfaces of meteorite falls are included. The median inclusion size and the 25th and 75th percentile are shown in (a) and (b). The two black arrows indicate the same surface of Murchison that was imaged in two different orientations. In (c), these two surfaces are indicated by the dotted lines. (d) lists the matrix volume abundance.
Download figure:
Standard image High-resolution imageWe find a slight variation in relative brightness, spectral slope, and inclusion size distribution within one meteorite, but all values of one meteorite agree within their errors. The most significant variation is observed for the inclusion size distribution. As explained above, the determination of the inclusion size is highly dependent on the exact knowledge of the distance between the meteorite and the QM, which is one of the major uncertainties in our work. The error on the matrix volume abundance is less than 5% for all samples, with the smallest value of 0.2% found for Karoonda. The variation of the parameters between the different surfaces of the same meteorite is less than the variation that is introduced by cutting the surface (Section 4.1). We will therefore exclude the cut meteorite surfaces from the following analysis.
4.3. Effect of Terrestrial Weathering
Meteorites react with the environment and atmosphere on Earth, which influences the compositional and therefore spectral properties of the meteorite matrix and inclusions (Bland et al. 2006; Salisbury & Hunt 1974). Depending on the duration, humidity, and temperature a meteorite is stored at, weathering such as element mobilization, oxidation of metal and mafic silicates, or veining may occur on various timescales (Gounelle & Zolensky 2001; Sephton et al. 2004; Bland et al. 2006). A variation in inclusion color may be most detectable from the oxidation of iron oxyhydroxides, which can introduce an absorption feature near 900 nm, an absorption edge between 500 nm and 600 nm and a steep drop in reflectance toward shorter colors (Salisbury & Hunt 1974; Cloutis et al. 2011, 2012b). However, a variation in the size distribution of inclusions is not expected.
Figure 5 illustrates the average relative brightness of inclusions compared to the matrix using the red LED image (relative R brightness), the average spectral slope between red and blue ((R – B)/B), and the average spectral slope between red and green ((R – G)/G, 532 nm and 630 nm), which would be most diagnostic of the absorption edge between 500 nm and 600 nm of the inclusions in dependence of the year of fall onto Earth. We also show the matrix's (R – G)/G slope for comparison. For each meteorite image, one data point was derived. Both the relative R brightness and the spectral slopes of the inclusions as well as the matrix seem to be independent of the time these meteorites spent on Earth as well as of the carbonaceous chondrite group they belong to. Fluctuations of these parameters are large, even within the same group and do not allow us to constrain the terrestrial alteration stage of the meteorites. A general reddening in spectral slope of the meteorites related to weathering (Rubin & Huber 2005) cannot be observed. The only exception may be made for the relatively old CO3 group in our work which appears to have increased spectral slopes for both, the inclusions and the matrix. The fact that CO3s are more susceptible to terrestrial weathering in comparison to the other meteorite groups investigated in this work has also been reported previously (Cloutis et al. 2011, 2012a, 2012b, 2012c).
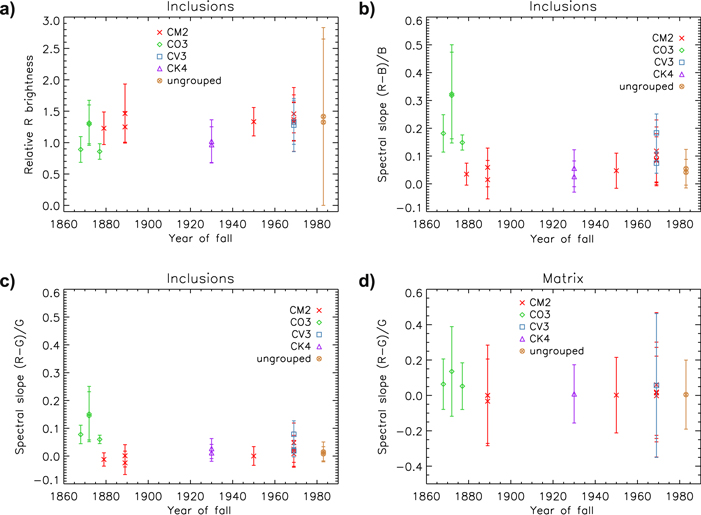
Figure 5. Relative brightness of the inclusions compared to the matrix brightness using the green LED (a) and the relative spectral slope (b) plotted against the year of meteorite fall. (c) and (d) show the relative slope from green (532 nm) to red (630 nm), which may be indicative of weathering-related iron oxidation, for the inclusions and matrix, respectively. The data are grouped into the different carbonaceous chondrite groups and include cut as well as fractured surfaces. A correlation is not evident.
Download figure:
Standard image High-resolution imageFurthermore, terrestrial weathering may create surface features that appear similar to meteorite inclusions. To illustrate this, we imaged a piece of the CI1 Orgueil, which fell onto Earth more than 150 years ago (Figure 6). This piece does not have any inclusions and inclusion statistics are thus not shown here. However, terrestrial weathering is common in CI meteorites and introduces brightness variations in the surficial appearance via, e.g., the formation of sulphate veins or crystals (Dufresne & Anders 1962; Cloutis et al. 2011; Gounelle & Zolensky 2001). These may appear similar to inclusions in the other meteorite images. This demonstrates that the effect of terrestrial weathering influences the inclusion identification process and needs to be considered as a main source of error. Using our QM imaging technique, this phenomenon introduces an overestimation of inclusion abundances and/or sizes when bright weathering features are falsely identified as inclusions or merge individual smaller inclusions into a single larger one. With our method it is not possible to distinguish between inclusion-like weathering features and real inclusions, however, given the protected storage capabilities at the Natural History Museum, and after a thorough visual inspection of the samples before imaging them, we chose meteorites with minimal terrestrial weathering features.
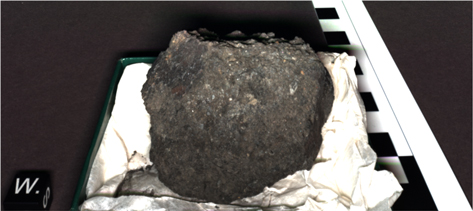
Figure 6. CI1 Orgueil as imaged by the QM (color composite). The bright patches are not inclusions but terrestrial weathering features. This example illustrates the challenges in identifying inclusions in weathered meteorites.
Download figure:
Standard image High-resolution image4.4. The Carbonaceous Chondrite Groups
Figure 7 shows the relative brightness, spectral slope and cumulative size distribution of the carbonaceous chondrite groups CM2, CV3, CO3, and CK4 as well the ungrouped Ningqiang in comparison. Here, we only show the values of meteorite falls with a fractured surface as labeled in Table 3.
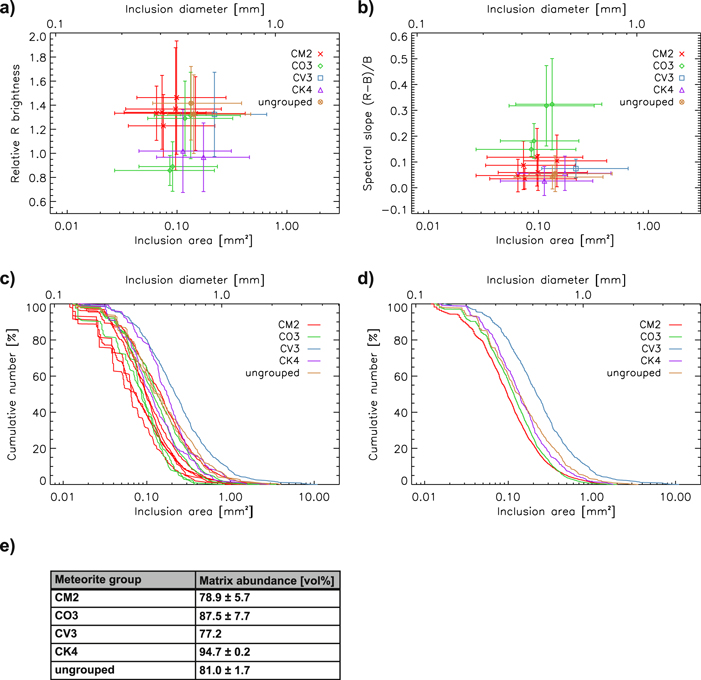
Figure 7. Relative brightness (a), spectral slope (b), and cumulative size distribution (c) of individual measurements of the different carbonaceous chondrite groups in comparison. The median inclusion size and the 25th and 75th percentile are shown in (a) and (b). (d) shows the inclusion size distributions of each carbonaceous chondrite group derived by considering all inclusions identified within this group. (e) lists the average matrix volume abundance of the different groups. Measurements of fractured surfaces of meteorite falls are included.
Download figure:
Standard image High-resolution imageThe relative inclusion brightness and the spectral slope as a function of the median inclusion size cluster for each carbonaceous chondrite group with the exception of the CO3 group (Lancé Ornans and Warrenton) in which Lancé is distinguished from the other two meteorites by its comparatively large relative brightness and spectral slope. Lancé has previously been found to differ from other CO3s by having an overall high 600/500 [nm] ratio, which may be attributed to more abundant hydrous phases and ferrihydrite-like materials (Keller & Buseck 1990; Cloutis et al. 2012a). However, the large error bars on our measurements indicate that individual inclusions can have values that significantly deviate from the clusters.
The average spectral slope of the inclusions of all carbonaceous chondrite groups is positive (i.e., red, Figure 4(b)). The CO3 inclusions generally have the largest (reddest) spectral slope with mean values ranging from 0.15 to 0.32 distinguishing them from the other groups. Concerning the relative brightness, Lancé fits well in the cluster of the CM2s and CV3s, but the other two CO3 meteorites imaged (Ornans and Warrenton) as well as the CK4 meteorite Karoonda have lower relative inclusion brightness values, which are even below 1 (Figure 4(a)). This means that in the red LED light the matrix is brighter than the average inclusion. This distinguishes Ornans, Warrenton, and Karoonda from the other meteorites, which all have relative R brightness values above 1.2.
The CV3 Allende (the only meteorite of this group in our experiment) most prominently distinguishes from the other meteorite groups in terms of the sizes of its inclusions. Although the slope of the cumulative size distribution of all carbonaceous chondrite groups is similar, the CV3 distribution is shifted toward larger inclusion sizes. In Section 5.1 we will show that this observation has been confirmed previously which validates our method.
Matrix volume abundances vary between 73.5% (CV3) and 94.7% ± 0.2% (CK4) and do not correlate with the median inclusion size (also see Figure 8(d)). For example, the matrix volume abundances of the CV3s and the CM2s are similar (84.4% and 85.9% ± 3.8%, respectively), but the CV3s and CM2s have the largest and smallest median inclusion sizes ( and
and  ), respectively.
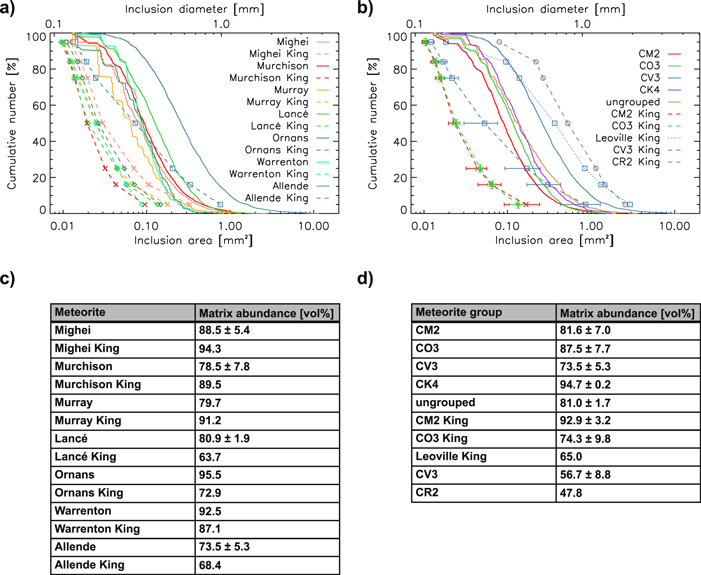
Figure 8. Cumulative size distribution of the meteorites imaged in this work in comparison with previously published results by King & King (1978). (a) shows the comparison between individual meteorites. For a more general overview, we combined the inclusions of all meteorites of a specific carbonaceous chondrite group of our measurements and calculated the mean and standard deviation of a specific group using the measurements of King & King (1978) in (b). Please note that Leoville and the CR2 do not have error bars because they comprise only one measurement. The CV3 Leoville is shown individually as it separates significantly from the other CV3 meteorites. Measurements of fractured and cut surfaces of meteorite falls are included. Tables (c) and (d) list the matrix volume abundance of the samples shown in (a) and (b), respectively. Where multiple samples were combined, the mean and standard deviation of the matrix volume abundance is given.
Download figure:
Standard image High-resolution imageWe also had a CI1 sample available, Orgueil. Within our sample collection, Orgueil, which fell in 1864, is the meteorite with the longest retention time on Earth. Thus, this sample was unfortunately weathered to a degree that bright spots (possibly surficial sulphate deposits) covered the surface and were easily confused as bright inclusions. Because such inclusions are actually not found in CI1 carbonaceous chondrites (Cloutis et al. 2011), we excluded Orgueil from our analysis.
5. Scientific Context and Discussion
5.1. Previous Investigations of Meteorite Inclusions
Given the availability of high spatial resolution instruments (e.g., optical or electron microscopes) in Earth-based laboratories, many analyses on meteoritic inclusions focus on size scales below the pixel resolution of the QM (∼0.2 mm; e.g., Rubin & Wasson 1986; Ebel et al. 2016; Simon et al. 2018). King & King (1978), however, measured the inclusion size distribution of inclusions larger than 0.1 mm in CM2, CO3, CV3, and CR2 carbonaceous chondrites using polished thin sections and a microscope. Their sample analysis areas were between 13 mm2 and 210 mm2 in size, whereas our sample areas were generally larger, varying between 111 mm2 and 2234 mm2 (Table 3). One has to take into consideration that the different inclusion identification techniques, as well as the sample preparation (e.g., thin sections, fractured surface), will affect the identification of inclusions; however, their analysis best matches our work in terms of spatial resolution. Figure 8 shows their findings in comparison with our measurements.
Generally, our method results in larger inclusion sizes compared to the data derived by King & King (1978), and with the exception of the CM2s, we derive about 10% lower matrix volume abundances. This is also represented by the individual meteorites in each carbonaceous chondrite group. The coarser appearance in our measurements is probably related to the larger sample sizes used in our work, which allows us to identify more larger inclusions and our minimum inclusion size of one pixel (∼0.2 mm), which increases the relative abundance of larger inclusions compared to King & King (1978), who measured inclusions down to a size of 0.1 mm. Nevertheless, the King & King (1978) cumulative size distribution flattens less significantly toward larger inclusion sizes. This implies that compared to the King & King (1978) method, our analysis identified fewer large inclusions in relation to the total number of inclusions. This discrepancy is most likely introduced by the more thorough visual inspection that was conducted by King & King (1978), including the usage of reflected as well as transmitted light, which cannot be accomplished by our method. This may have allowed them to identify faint large inclusions that we may have interpreted as matrix. The discrepancy is particularly evident for the CV3 meteorites (blue lines in Figure 8) whose inclusion size distribution shows the shallowest slope.
King & King (1978) note that the inclusion size distributions of the CM2 and CO3 meteorites are virtually identical. We observe the same behavior for the CM2s and CO3s, and the CK4 Karoonda and the ungrouped Ningqiang also have very similar inclusion size distributions. The largest deviation from this group of inclusion size distributions is presented by the CV3 Allende, which has much larger inclusions. These coarser inclusions are evident in our as well as the King & King (1978) work.
King & King (1978) also investigated the inclusion size distribution of the CR2 Renazzo and the CV3 Leoville, which deviate from their other carbonaceous chondrite measurements due to comparatively large inclusion sizes. Unfortunately, we did not have these samples available for our measurements, but we show them here (Figure 8) to illustrate the possible variations within the carbonaceous chondrite groups.
Brearley & Jones (1998) and Scott & Krot (2014) summarize the petrographic characteristics of carbonaceous chondrites (Table 4). Comparing their summary to our results, we find that we derive significantly higher matrix and lower chondrule and refractory volume abundances for all carbonaceous chondrite groups. King & King (1978) also derive higher matrix and lower chondrule and refractory inclusion volume abundances with the exception of the CM2 group. This discrepancy may be attributed to a different definition of matrix material or different derivation methods on which Scott & Krot (2014) and Brearley & Jones (1998) are not very specific. Additionally, analytical instruments became more precise over the time span of these works. On the other hand, our definition of matrix as the material that is not an inclusion is likely oversimplified compared to other definitions, and our resolution limit of 0.2 mm may have led to the exclusion of small inclusions further contributing to an overestimation of the matrix volume abundance.
Table 4. Summary of the Petrographic Characteristics of the Carbonaceous Chondrites Investigated in This and Other Works
| Carbonaceous Chondrite Group | Chondrule + Refractory Inclusions Abundance (vol%) | Matrix Abundance (vol%) | Chondrule Mean Diameter (mm) | Chondrule + Inclusions Median Diameter (mm) | ||||||
|---|---|---|---|---|---|---|---|---|---|---|
| S&K | K&K | This Work | S&K | K&K | This Work | S&K | This Work: Chondrules + Inclusions | K&K | This Work | |
| CI | <0.001 | ⋯ | ⋯ | 95 | ⋯ | ⋯ | ⋯ | ⋯ | ⋯ | ⋯ |
| CM | 25 | 4.7 ± 2.1 | 12.3 ± 4.7 | 70 | 92.9 ± 3.2 | 83.1 ± 7.1 | 0.3 | 0.48 ± 0.20 | 0.023 ± 0.003 |

|
| CR | 51–61 | 34.8 | ⋯ | 30–50 | 47.8 | ⋯ | 0.7 | ⋯ | 0.525 | ⋯ |
| CO | 43 | 17.1 ± 6.6 | 9.4 ± 4.0 | 30 | 74.3 ± 9.8 | 86.3 ± 7.2 | 0.15 | 0.41 ± 0.19 | 0.024 ± 0.003 |

|
| CV | 55 | 28.9 ± 5.9 | 17.7 ± 3.5 | 40 | 56.7 ± 8.8 | 73.5 ± 5.3 | 1.0 | 0.68 ± 0.46 | 0.053 ± 0.023 |

|
| CK | 19 | 3.5 ± 0.2 | 75 | ⋯ | 94.7 ± 0.2 | 0.7 | 0.47 ± 0.24 | ⋯ |

| |
| Ryugu | 7.6 | 92.4 | 0.63 ± 0.91 |

| ||||||
Note. The values have been extracted from Scott & Krot (2014, abbreviated as S&K) and King & King (1978, abbreviated as K&K). Three dots indicate that no data has been collected for the according position. We also show the results from Ryugu derived by Schröder et al. (2021) with the same method. Mean and median inclusion sizes of Ryugu are directly derived from their data set, but only considering inclusions less than 25.5 cm away from the camera to avoid distortion effects introduced by the shape model, which becomes less reliable at larger distances (Scholten et al. 2019). Please note that we did not distinguish between refractory inclusions and chondrules in our work. Our values are averages of all cut and fractured surfaces of a specific carbonaceous chondrite group including finds and falls. The matrix abundance is directly calculated from the chondrule and refractory abundance (100% – inclusion abundance). The values from Scott & Krot (2014) may not sum up to 100% due to excluded sulfide and metal components.
Download table as: ASCIITypeset image
Brearley & Jones (1998) describe the size frequency distribution of chondrules as log-normal distributions with well-defined mean diameters. Although we are not able to distinguish between chondrules and inclusions, we also observe a distribution of combined chondrules and inclusions with a log-normal shape. However, a well-defined mean value is not obvious. Instead our derived inclusion sizes span over a wide range of sizes, whose mean and median size cover the values from Scott & Krot (2014) within their errors. The only exception is given by the CO3 group with smaller mean chondrule sizes compared to our measurements. However, May et al. (1999) report larger average inclusion sizes varying between 0.19–0.30 mm for this group, which is in agreement with our values. Scott & Krot (2014) also report a significantly larger chondrule and refractory inclusion abundance as well as lower matrix volume abundances for the CO3 group not only compared to our work, but also compared to the work by King & King (1978). This illustrates the difficulties in comparing these parameters when different methods or samples of the same group are used. Nevertheless, in agreement with Scott & Krot (2014) and King & King (1978), we find the largest inclusion and chondrule sizes for the CV3 group, while the sizes for the other groups are similar.
To illustrate the dependence of measuring technique on the derived chondrule and inclusion sizes, we consider the example of the Allende meteorite (CV3), which has been investigated in numerous studies (Friedrich et al. 2015) including those of Simon et al. (2018), who evaluated SEM images with a 3 μm pixel resolution, and Teitler et al. (2010), who picked chondrules from fines. Simon et al. (2018) report relatively small average particle sizes of 0.34 mm ± 0.48 mm, whereas Teitler et al. (2010) derive mean sizes of 0.92 mm ± 0.74 mm. This underlines the necessity of deriving meteorite inclusions with MasCam's QM for an adequate comparison with the inclusions found in the Ryugu rock.
Although absorption features of phyllosilicates, iron-rich oxides, and spinel are present in the wavelength covered by the QM and should be present in the carbonaceous chondrites imaged (e.g., Cloutis et al. 2011), the limited spectral range and resolution provided by our experiment unfortunately does not allow us to observe such features. Comparing the spectral slope and the relative brightness of the inclusions with previous investigations also proves difficult due to the lack of publications focusing on the spectral behavior of inclusions in carbonaceous chondrites in the visible range. Therefore, we cannot validate our observed relative brightness and overall red slope of the inclusions. However, the reflectance spectra of carbonaceous chondrite slabs including matrix as well as inclusions also generally possess a red slope in the visible due to the presence of iron oxyhydroxides (Trigo-Rodríguez et al. 2014).
5.2. Relation to Inclusions in Ryugu's Rock
Meteorites are believed to be fragments that were ejected from asteroids via impacts or catastrophic disruptions. Ryugu is a rubble pile asteroid and formed as a result of a catastrophic disruption (Watanabe et al. 2019). So, rocks on Ryugu are probably similar in texture and composition to meteorites found on Earth. The surface of Ryugu appears free of dust (Jaumann et al. 2019), which allowed the imaging of bare rock textures comparable to those of meteorites on Earth. Thus, it is reasonable to analyze the inclusion size distribution as well as the color of inclusions of meteorites in the same manner as done by Schröder et al. (2021), who analyzed the rock and its inclusions imaged by MasCam on asteroid Ryugu (Figure 10). Figure 9 and the last row in Table 3 show their findings in comparison with the meteorites evaluated here. Note that the mapping of inclusions on Ryugu and the mapping of the meteorites was conducted by the same co-author (H.S.). Thus, systematic differences between Ryugu and the meteorites should be minimal. Our analysis of meteorite inclusions confirms the link between the rubble pile asteroid Ryugu's rock and meteorites by finding generally comparable inclusion colors and size distributions.
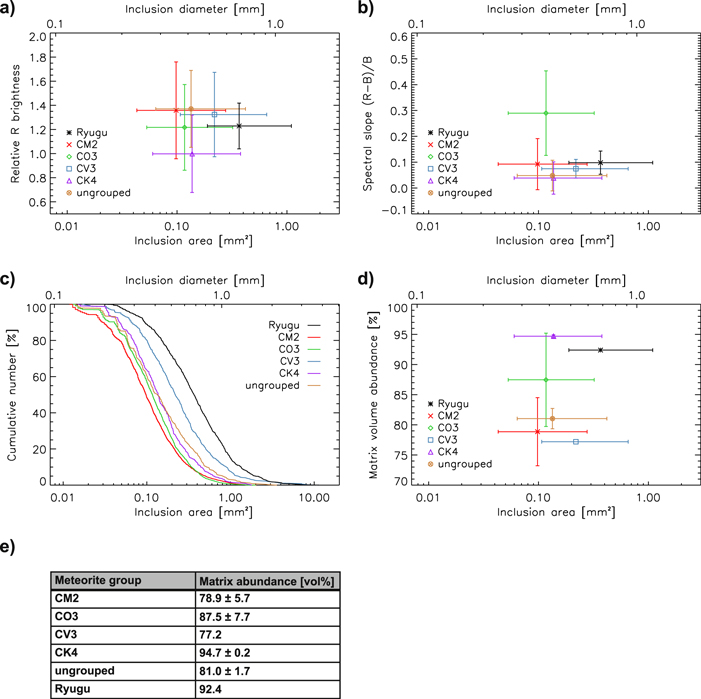
Figure 9. Relative brightness (a), spectral slope (b), and cumulative size distribution (c) of measurements combined in different carbonaceous chondrite groups in comparison with Ryugu. The median inclusion size and the 25th and 75th percentile are shown in (a), (b), and (c). (d) shows the dependence of the matrix volume abundance on the median inclusion size. Note that the values shown here are upper limits of the matrix volume abundance introduced by the spatial resolution limit of our method. (e) lists the values of (d). Measurements of fractured surfaces of meteorite falls are included.
Download figure:
Standard image High-resolution image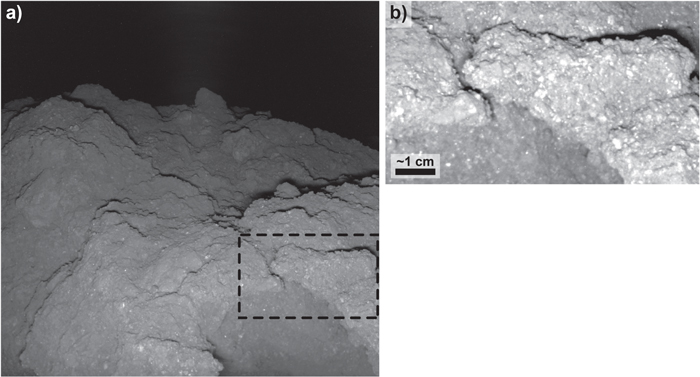
Figure 10. The rock on Ryugu imaged by MasCam while illuminated with the red LED at night (a). The scene is approximately 25 cm across. (b) shows a contrast stretched zoom of the rock and its inclusions. The location of (b) is indicated by the box in (a).
Download figure:
Standard image High-resolution imageSchröder et al. (2021) conclude that based on the inclusion size distribution, Ryugu appears similar to CV3 and CR2 groups as analyzed by King & King (1978). Based on the upper limit to the matrix abundance, the CM2s may be most representative for Ryugu. In agreement with Schröder et al. (2021), who could only base their analysis on a comparison with the data provided by King & King (1978), we also conclude that Ryugu's rock's inclusion size distribution best fits with the CV3 group, but the Ryugu rock is coarser than that of CV3s. The matrix volume abundances of the CK4 group and Ryugu are almost identical (94.7% ± 0.2% and 92.4%, respectively). In contrast the matrix volume abundance of the CM2 group is comparatively small (78.9% ± 5.7%).
Generally, the relative brightness, as well as the spectral slope of the inclusions in the meteorites and the inclusions found on Ryugu, is similar, despite the terrestrial weathering, which may have reddened the inclusions (Rubin & Huber 2005). On the other hand, the inclusions found in the rock on Ryugu are likely to have experienced some degree of space weathering, including micrometeoroid bombardment, solar radiation, and thermal stresses (Jaumann et al. 2019; Otto et al. 2020). It is unlikely that meteorites possess any material that has been exposed to space weathering because their entry into Earth's atmosphere would have removed or fused the outer layer of the meteorites that would have been exposed to space before the fall. Although space weathering also tends to darken and redden the spectra of the matrix and inclusions (Noble et al. 2001; Fiege et al. 2019), the reddening due to terrestrial weathering appears to occur to a similar degree.
Sugita et al. (2019) and Kitazato et al. (2019) compared spectra of Ryugu in the visible wavelengths with meteorites party overlapping with the meteorites considered in this work (e.g., Murchison, Allende, Orgueil). The spectra of Ryugu are taken from orbit and the meteorite spectra used in their work are taken from powders and thus do not allow inclusions and matrix to be distinguished as done in this work. However, they show that Ryugu's spectrum is generally darker and flatter than that of carbonaceous chondrites. The spectra of both inclusions and matrix of the meteorites we imaged follow the expected spectral behavior of carbonaceous chondrites in the visible wavelengths and possess a slightly reddish slope (see Figure 11 in the Appendix).
Considering the four parameters derived in this work (relative brightness, spectral slope, inclusion size distribution, and matrix volume abundance), Ryugu is most similar to a different group for every parameter, e.g., the mean brightness of the CO3s, the mean spectral slope of the CM2s, the median grain size of the CV3s, and the matrix abundance of the CK4s is most similar to Ryugu's values of these parameters. The most prominent difference between the inclusions in the rock on Ryugu and those in the meteorites are the presence of comparatively large inclusions on Ryugu (Table 4).
The spectral parameters of the inclusions of Ryugu's rock (relative brightness, spectral slope), as well as the matrix volume abundance, fit well within the total parameter space of the carbonaceous chondrites imaged in this work (Figure 9), with the exception that Ryugu's rock appears to have larger inclusions. For the inclusion size analysis on Ryugu, a three-dimensional shape model was used (Scholten et al. 2019). In Sections 4.1 and 4.2, we showed that not knowing the exact distance of our samples to the camera and their three-dimensional shape can introduce errors in the size frequency distribution, which could be minimized for the Ryugu analysis for which a shape model was available. Thus, our analysis of individual meteorites is more prone to errors and may increase or reduce the similarity to Ryugu's inclusion size distribution. The averaged inclusion size distributions of the meteorite groups (Figure 9(c)) should balance these distortion effects, but it is still not possible to attribute Ryugu's rock to one of the meteorite groups based on the presented parameters alone given that the groups themselves overlap significantly within the parameter space. A more sophisticated chemical analysis, which will be possible upon the collected sample return by Hayabusa2, will be necessary to find the best match. It is also possible that the Ryugu rock is not represented in the meteorite collections, because it would have not survived the entry through Earth's atmosphere due to its low intrinsic tensile strength (Grott et al. 2019).
6. Summary and Conclusions
In order to interpret and relate in situ images of a rock showing bright inclusions on asteroid Ryugu, we imaged a set of carbonaceous chondrites from the CM2, CO3, CV3, and CK4 groups using the QM of MasCam, the camera on board MASCOT. We also imaged a CI1 (Orgueil) but excluded it from our analysis due to terrestrial weathering giving false impressions of inclusions. Using the same method used for images taken on Ryugu, we imaged the meteorite samples illuminated by colored camera LEDs (blue, green, red, and infrared) and mapped bright inclusions in a color composite image of the blue, green, and red images. We then evaluated the inclusion size distribution, the relative brightness of the inclusions against the matrix in the red image, the inclusion spectral slope ((R – B)/B), and the matrix volume abundance.
First, we investigated the influence of the laboratory conditions on the parameters of interest by imaging cut as well as fractured surfaces and different sides of the same meteorite. We found that the variations between the two types of surfaces are on the same order as the fluctuations between different sides of the same meteorite. The derived inclusion size distribution is the most sensitive parameter and can vary significantly, indicating that the distortion introduced by the camera needs to be compensated by knowledge of the exact shape of the samples imaged. This was not available for the meteorites but has been derived for the MASCOT's landing site on Ryugu (Scholten et al. 2019).
The influence of terrestrial weathering on the spectral properties of the inclusions is not evident as a systematic variation with age.
Considering only fractured surfaces, we find that all meteorite groups overlap within their relative inclusion brightness, spectral slope, inclusion sizes, and matrix volume abundance. The most significant deviations from the average spectral slope can be observed for the CO3 group including Lancé with the largest spectral slope. The relative inclusion brightness of the CK4 group and two CO3s (Ornans and Warrenton) is lower than the average. The CV3 group, represented by Allende in our work, shows the largest inclusion sizes and largest matrix abundance.
Our analysis results in consistently larger inclusion sizes compared to previous investigations. With the exception of the CM2 group, our analysis also shows a higher matrix volume abundance, which is likely caused by our simple definition of matrix as the parts of the meteorite that are not an inclusion.
In conclusion, the parameters derived in this work, which are limited by the spectral resolution of the LEDs on MasCam and its QM, cannot be used alone to distinguish between different meteorite groups. But it is possible to identify individual meteorites with prominent parameters. Comparing our results to the rock on Ryugu imaged by MasCam thus allows us to predict that the inclusions in Ryugu's rock are probably larger compared to those known from the carbonaceous chondrites imaged in this work. The rock's matrix abundance, relative inclusion brightness, and spectral slope fit well within the parameter space of the carbonaceous chondrites.
We thank the Hayabusa2 and MASCOT teams and the Natural History Museum Berlin for making this work possible. We also thank D. Takir and the anonymous reviewer for their insightful comments and suggestions. K.A.O. and T.M. gratefully acknowledge the financial support and endorsement from the German Aerospace Center (DLR) Management Board Young Research Group Leader Program and the Executive Board Member for Space Research and Technology.
Appendix
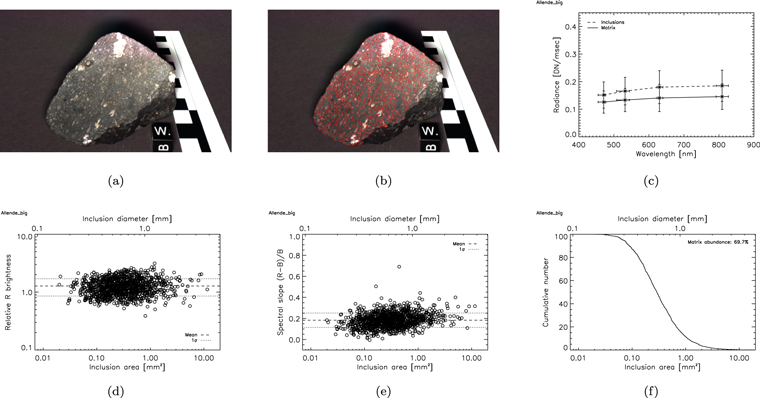
This appendix contains a figure set for all 22 meteorites imaged in this work (Figure 11). Each figure in the set has six panels that show the plain and mapped images, the average matrix and inclusion spectrum, the relative R brightness of individual inclusions, the relative spectral slope of individual inclusions, and the cumulative size distribution of the inclusions.
Figure 11.
Supplemental figure images of the Allende (big) meteorite. The panels show a plain QM image (a) and a QM image with mapped inclusions (b), the average matrix and inclusion spectrum (c), the relative R brightness of individual inclusions (d), the relative spectral slope of individual inclusions (e), and the cumulative inclusion size distribution (f). Dashed and dotted lines in (d) and (e) indicate the mean and 1σ standard deviation. (The complete figure set (22 images) is available.)
Download figure:
Standard image High-resolution image