


Abstract
We report a new integrated framework that combines atomic-length-scale characterization via aberration-corrected scanning transmission electron microscopy with first-principles-driven thermodynamic modeling and dust-transport models to probe the origins of some of the first-formed solids in the solar system. We find that within one of the first solids that formed in our solar system, spinel, nominally MgAl2O4, occurs as a twinned inclusion within perovskite, CaTiO3, and contains vanadium segregated to its twin boundary as atomic columns. Our results support a scenario in which spinel condensed at 1435 K in the midplane of the solar protoplanetary disk and was later transported inward to a hotter region where perovskite condensed around it at 1681 K. The spinel became twinned as a result of a displacive phase transition in the perovskite after which it was later transported to cooler regions of the disk and incorporated into its parent asteroid. The condensation, transport, and phase transformation can all be explained within the developed self-consistent framework that reproduces the observed phase assemblage and atomic-scale structure. This framework suggests that planetary materials evolved within a thermodynamically open system and, moving forward, motivates such an approach in order to understand the thermodynamic landscape on which planetary materials formed.
Export citation and abstract BibTeX RIS

Original content from this work may be used under the terms of the Creative Commons Attribution 4.0 licence. Any further distribution of this work must maintain attribution to the author(s) and the title of the work, journal citation and DOI.
1. Introduction
Our solar system began as a rotating disk of gas and dust 4.567 billion years ago. Understanding the thermodynamic landscape and evolution of this disk remains a grand challenge in planetary science as it was within this cloud that the properties of the materials from which the planets formed were determined. Such understanding requires a robust quantitative model involving detailed information on the pressures and temperatures contained within the disk and how they varied with time and location. Important constraints on such parameters come from probing the materials within meteorites because locked up in their micro- and atomic-scale structures is a record of their formation histories, which were controlled by the collective suite of environments to which they were exposed.
Early models of the solar nebula described a hot disk in which solid materials were heated, melted, evaporated, and eventually recondensed (Cameron 1962). Such a system was imagined as having the bulk composition of our Sun, i.e., "solar," as determined from spectroscopic measurements of its photosphere and bulk compositions of meteorites that cooled monotonically with solid materials condensing out from it (Davis & Richter 2014). Thermochemical models aimed at quantifying such cooling and condensation were developed within a framework of closed-system equilibrium thermodynamics employing thermochemical databases derived from experimental studies. These calculations predicted a very specific set of mineral phases that formed in order of decreasing temperature under an assumed total pressure (Larimer 1967; Larimer & Anders 1967; Grossman 1972, 2010; Grossman & Larimer 1974). This "nebular condensation sequence" has served as the backbone of our understanding of how elements partitioned into solid materials out of the gas phase and became the building blocks for our planetary system (Lewis 1974). Indeed, the minerals that these previous studies predicted to form at the highest temperatures in the solar nebula matched those observed within calcium-aluminum-rich inclusions (CAIs). With radiometric age dates in excess 4.567 billion years (Amelin et al. 2002; Connelly et al. 2012), such CAIs are thought to be the first objects to have formed in the solar system. They represent time zero for our origins and point to a high-temperature origin for at least some of the materials that were incorporated into planets.
These early successes were encouraging, but the detail to which these calculations can be used is limited by the available thermochemical data. The calculations described above do not (i) include the full range of solute atoms for all phases that are observed or (ii) account for other types of structural perturbations and nonstoichiometry. The importance of both of these complications are observed in a variety of planetary materials, e.g., Brearley & Jones (1998), and directly affect the thermochemical properties of the materials, which in turn sets the temperatures at which these materials are predicted to form (Phillips 2004). Later modeling efforts incorporated limited solid solutions into metals, silicates, and oxides to describe equilibrium condensation in dust-enriched systems (Ebel & Grossman 2000), but recent observations of CAIs reveal microstructures and crystal chemistry that nonetheless still depart from equilibrium predictions (Han & Brearley 2016, 2017; Keller et al. 2018; Han et al. 2019). Moreover, previous studies of condensation have treated the problem with an underlying assumption that the gas cooled in a closed system. That is, the solids remained in contact with the same gas from which they formed. This is a valid first-order approach; however, one of the main challenges in modeling such condensation is capturing the effects of the dynamical evolution of condensed mineral phases, i.e., the transport and mixing of solids and gas within the solar protoplanetary disk. Evidence for such transport and mixing is seen in meteorites and comets as they are collections of materials that recorded very different formation conditions yet are intimately mixed on the scale of micrometers (Brownlee et al. 2006; Krot et al. 2009). Such evidence would suggest planetary materials saw a diverse array of physical conditions over their lives rather than simply recording monotonic cooling histories in a set of closed "boxes." Instead, protoplanetary disks such as the solar nebula require that such solids and gas decouple from one another along the path to forming planets. That is, in the simplest picture, solids settle to the midplane of these disks where planetesimals and planets are able to form, while the gas itself remains suspended due to internal pressures. Additional deviations in dynamical evolution are possible and likely as we will discuss later, but in all cases, solids would constantly see a different mix of gases than that from which they originally formed or were processed throughout their lifetime in the disk. In short, our ability to characterize accurately the thermodynamic origins of CAIs, and more generally, planetary materials, has been restricted.
Building on available models that have provided a framework to interpret the composition and microstructure of materials within primitive meteorites (Larimer 1967; Larimer & Anders 1967; Grossman 1972, 2010; Grossman & Larimer 1974; Ebel & Grossman 2000; Lodders 2003; Petaev & Wood 2005; Ebel 2006), here we build a multiscale paradigm that attempts to integrate the effects of mixing at astronomical units (au) with the thermochemistry down to the scale of atomic units (a.u.). Our motivation is to understand the micro- and atomic-scale structure of the materials reported herein, which defy existing thermochemical models of the early solar protoplanetary disk. To this end, we combine state-of-the-art nanoscale to atomic-scale characterization of several CAIs with quantum-mechanical, thermodynamic modeling and dust-transport calculations to explain their origin. We propose that such an integrated approach is an important step toward a more comprehensive paradigm for reverse engineering the microstructures observed within primitive meteorites and extracting from them the thermal and dynamic histories that they have recorded.
2. Materials and Methods
This study focuses on a petrographic thin section of the Allende CV3 chondrite (TS25, U. Chicago), which was previously found to contain a large fluffy type-A CAI (MacPherson & Grossman 1984; Cosarinsky et al. 2008). We report here on perovskite, nominally CaTiO3, which is the major Ti-bearing phase in fluffy type-A CAIs and is predicted to host rare-earth elements and (minor) lithophile elements (Lodders 2003). While our study is statistically limited, this work is part of a longer-term effort to deconstruct CAIs phase by phase, to examine their microstructures and crystal chemistry at length scales ranging from the micron level down to the atomic, and to use such information to gain insights into their origins.
To search for perovskite grains of interest, we used a Thermo Scientific (formerly FEI) Helios G3 focused-ion-beam scanning electron microscope (FIB-SEM) located in the Kuiper Materials Imaging and Characterization Facility at the Lunar and Planetary Laboratory (LPL), University of Arizona (UA) to image and map chemically local areas of the CAI using an EDAX energy-dispersive spectrometer (EDS). We selected four perovskite grains for detailed study based on their distribution and relationships. Electron images and EDS maps were acquired at 15 keV.
Planetary materials are heterogeneous, and the ion-beam milling of each sample for transmission electron microscope (TEM) analysis (described below), however standard the approach or recipe, is unique. Here we report detailed measurements on FIB section "b," which, with a projected thickness <50 nm, was suitably prepared for atomic-resolution imaging and spectroscopy. The other three sections, "a," "c," and "d," proved somewhat thick (closer to 100 nm thickness) for atomic-resolution imaging and spectroscopy but were thin enough for examination of microstructure and composition and comparison of broad trends with section "b." Data on sections "a," "c," and "d" appear in Appendix A. The selected perovskite grains were extracted using the EasyLift micromanipulator on the Helios and thinned to electron transparency using previously described methods (Zega et al. 2007) except these sections were mounted onto Omniprobe half grids in flagpole-style geometry. All samples were ion polished down to 5 keV acceleration voltage to remove the amorphous damage layer on each surface created by higher-voltage milling.
The FIB cross sections were analyzed using the newly developed 200 keV Hitachi HF5000 aberration-corrected scanning transmission electron microscope (S/TEM). We used the HF5000 located at Hitachi High-Tech Corp. (Hitachinaka, Ibaraki Prefecture, Japan) and the newly installed HF5000 located at UA (Tucson, AZ, USA). Each HF5000 is equipped with a cold-field-emission gun, a third-order spherical aberration corrector for STEM imaging, and bright-field and dark-field STEM detectors. The HF5000 is also equipped with two spectrometers: (1) an Oxford Instruments X-Max 100 TLE EDS system including twin, 100 mm2 silicon-drift detectors oriented normal to the axis of the sample rod and providing a large (up to 2 sr) solid angle for X-ray collection, and (2) a Gatan GIF Quantum ER electron energy-loss spectrometer (EELS). The HF5000 is capable of rapid (minutes) X-ray mapping of entire FIB sections and atomic-resolution imaging (78 pm point-to-point resolution in STEM mode via high-angle annular-dark-field, HAADF, imaging). All FIB sections were mapped with TEM-EDS for their overall composition. EDS spectra were acquired at 200 keV in STEM mode using a 300 pm probe. Spectrum images were acquired with mapping resolution set to 256 × 256 pixels, a dwell time of 2.7 ms, and a process time of 4. STEM-EELS was used to measure atomic-column chemical segregation in one of the samples. EELS spectrum images were acquired at 200 keV in STEM mode using a 100 pm probe, STEM condenser aperture of 30 μm, emission current of 10 μA, a 5.0 mm spectrometer entrance aperture, and dispersion of 0.1 eV per channel. The STEM convergence and EELS collection angles are measured at 30 and 25 mrad, respectively. The EELS spectrum image shown herein was acquired over an area of 6.7 nm × 1.34 nm using a pixel size of 0.12 nm and an exposure time of 0.2 s. To complement our experimental work and provide a framework for understanding our measurements, we carried out a series of computational efforts that we describe below.
Thermodynamic data for V-alloyed spinel, corundum, and perovskite were determined using first-principles density-functional theory (DFT). DFT has become the quantum-chemical method of choice for accurate characterization of properties such as lattice parameters, cohesive energy, free energy, defect-formation energies (e.g., twins, point defects, grain boundaries), defect-migration energies (e.g., diffusion activation barriers), electronic-band structures, as well as spectral information (e.g., EELS). Because DFT is a first-principles method, it does not require empirical parameters. Of particular relevance here is the ability of DFT to provide composition-dependent entropies and free energies at (extreme) pressure and temperature conditions, i.e., the thermodynamic landscape. We have previously demonstrated DFT in the application to planetary materials (Asaduzzaman et al. 2013, 2014, 2015, 2021; Bolser et al. 2016). Spin-polarized calculations were performed with the Vienna ab initio simulation package (VASP; Kresse & Furthmueller 1996). The ion–electron interactions are described by the projector-augmented wave (PAW) method (Kresse & Joubert 1999) within the generalized gradient approximation (GGA) as described by Perdew–Burke–Ernerzohf (Perdew & Zunger 1981; Perdew et al. 1996). A plane-wave cutoff energy of 520 eV, which is 30% higher than the default cutoff energy on the oxygen potential, is employed for the valence electrons. The Brillouin zone sampling of different oxides phases is performed using k-point meshes of different sizes based on the size of the unit cells. First-principles calculations of solid solutions of V-alloyed MgAl2O4-spinel, Al2O3, and CaTiO3-perovskite are performed using special quasirandom structures (SQS). In the case of spinel, while supercells with 168 atoms were calculated, supercells of 100 atoms were employed for the perovskite and corundum solid solutions. The supercells were relaxed for volume and ionic positions while preserving the symmetry of the crystals. The enthalpies of mixing are obtained from the so-relaxed SQS cells with preserved symmetry. The 〈111〉 twins in the V-alloyed MgAl2O4-spinel were calculated using 344-atom supercells.
Thermodynamic modeling of the phases was carried out within the Calculation of PHAse Diagram (CALPHAD) framework. The solution phases were modeled by using a compound-energy formalism model wherein the number of sublattices is chosen based on the crystal structure of the individual phases. The gas phase is modeled by incorporating all the relevant species (O, O2, O3, Al, Mg, Ca, Ti, V, Al1O1, Al1O2, Al2, Al2O1, Al2O2, Al2O3, Mg1O1, Ca1O1, Mg2, Ca2, H, H2, H2O1, H1O2, H1O1, H2O2, C, C1O2, C1O1, Si, Ti1O1, Ti1O2, V1O1, V1O2, Si1O1, Si1O2). The Gibbs free energy of various gas species is taken from Ansara et al. (2004). In addition to the solid-solution phases of V-alloyed Al2O3, MgAl2O4, and CaTiO3, the list of stoichiometric mineral phases that are considered in these calculations are Ca3Al2O6, CaAl2O4, CaAl12O19, CaTiAl2O6, CaAl4O7, Ca4Ti3O10, Ca3Ti2O7, CaTiO3, Ca2Al2SiO7, V2O3, and MgO. The MgAl2O4-spinel solid solution with V is modeled by using a four-sublattice model: (Al3+, Mg2+, V3+)1(Al3+, Mg2+, V3+, Va)2(Mg2+, Va)2(O2−)4 where Va refers to a vacancy. MgAl2O4-spinel, as a part of the MgO–Al2O3 pseudo-binary, was modeled previously (Hallstedt 1992; Zeinert & Fabrichnaya 2013). In this work, we have taken the MgO–Al2O3 descriptions reported by Zeinert & Fabrichnaya (2013) and assessed the parameters pertaining to V3+ in the spinel phase; the end-members involving V3+ in spinel are estimated by following the reciprocal relations (Hallstedt 1992; Zeinert & Fabrichnaya 2013). A three-sublattice model (Ca)(Ti4+, V4+)O3 is employed for the V-alloyed CaTiO3-perovskite solid solutions. The model parameters pertaining to CaTiO3 are assessed in this work, including free-energy descriptions of different polymorphs of perovskite, which undergoes phase transitions from cubic to tetragonal to orthorhombic structures as a function of decreasing temperature. The description of CaVO3 is taken from the literature (Yang et al. 2017), and the Al2O3 solid solution with V is modeled by a two-sublattice model, (Al3+, V3+)2O3. Additional details on the thermodynamic modeling are described in Appendix B.
We also were interested in tracking possible dynamical paths that grains may follow within the solar nebula and the resulting temperature/pressure histories that they would see. Due to their very old ages, CAIs likely sampled an early period of solar nebula history where mass and angular momentum transport were quite rapid. Such a setting has been shown to allow CAIs to form at high temperatures close to the Sun, then be transported outwards where they can be preserved for subsequent incorporation into planetesimals (Cuzzi et al. 2003; Ciesla 2010a; Jacquet et al. 2011). Here we adopt the classic α-viscosity formalism to describe the evolution of the solar nebula (Shakura & Sunyaev 1973; Hartmann et al. 1998) and follow the transport of individual grains within this dynamic setting.
For the case considered here, we set α = 10−3, and begin with a disk that has a surface density given by Σ(r) = 12,000(r/1 au)−1 g cm−2 from 0.1 to 10 au. The midplane temperatures are calculated assuming that the opacity of the disk everywhere was 1 cm2 g−1. While the opacity is likely to vary with location in the disk, the actual value is set by the composition and sizes of solids present in the disk and will evolve over time as solids are processed and grow. For simplicity, we adopt a constant value typical for protoplanetary disks. In calculating the dynamical evolution of the dust grains, we use the two-dimensional (radial and vertical) particle-tracking methods described in Ciesla (2010b, 2011). Particles are then released within the disk at a prescribed starting location, with the grains then moving as determined by the local radial drift velocity, advective flow of the gas, vertical settling, and random displacements associated with turbulence. At every time step, taken to be 0.01 yr, the location of the particle is updated and the local pressure and temperature recorded. A similar methodology was used in Ciesla (2015) in tracking the reaction of S with Fe grains. As perovskite was predicted to condense at T ∼ 1440 K at a pressure of 10−4 bar in this work, we release the 1 μm particles in our study at the disk midplane and at a distance of 1.5 au from the Sun. Particles were then followed for a period of 105 yr, and those that remained in the disk after this period of time were considered "survivors" that would be available for incorporation into planetesimals as they form over the rest of nebular history. Additional details on the particle-transport modeling appear in Appendix C.
3. Results
Figure 1 shows a backscattered electron (BSE) image of a local region of the Allende CAI in TS25. Its petrography was previously reported by Cosarinsky et al. (2008) and MacPherson & Grossman (1984) and so the interested reader can refer to those papers, but we provide a brief description of it here. Generally, the CAI has a nodular "fluffy" texture and contains abundant porosity, which ranges in size from the millimeter scale down to the submicron scale (Figure 1). It is ∼1.3 cm wide in its longest dimension, whereas the orthogonal dimension ranges between ∼2.5 and 5.5 mm (see Figure 5 of Cosarinsky et al. 2008). This "fluffy" type-A (FTA) CAI is dominated by melilite, a mineral solid solution that ranges between Ca2Al2SiO7 to Ca2MgSi2O7, together with lesser amounts of hibonite (CaAl12O19), spinel (MgAl2O4), and micrometer-sized grains of perovskite (CaTiO3). Accretionary matrix material, composed largely of Mg-rich silicates, surrounds the CAI and occurs within some of the pore spaces defined by its nodular structure (Figure 5 of Cosarinsky et al. 2008).
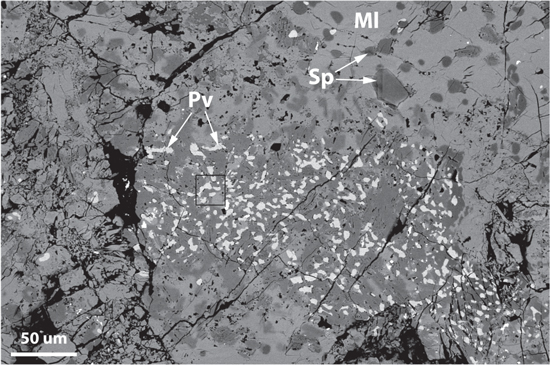
Figure 1. Backscatter electron image of a local part of the fluffy type-A CAI in Allende TS25. Melilite (Ml) is the most abundant phase in the core of the inclusion and occurs with spinel (Sp) and perovskite (Pv). The black rectangle outlines the area from which FIB section "b" was extracted.
Download figure:
Standard image High-resolution imageTo gain insight into the high-temperature origin of the perovskite phase in this CAI, we extracted four FIB sections transecting perovskite grains within the interior of the inclusion. The sections were created ∼450 μm away from the Wark–Lovering rim. The perovskite grains do not contain any local evidence of secondary alteration. One such section, "b," is shown in Figure 2. It contains perovskite adjacent to spinel, both of which reside on top of a larger (several micron) melilite grain (Figure 2(b)). High-magnification imaging and chemical mapping using EDS reveal that the perovskite grain contains inclusions of spinel measuring several hundred nanometers in size (see Figures 2(b)–(i)). We found inclusions of spinel within three out of the four perovskite grains that we extracted from this CAI (shown in Appendix A). The EDS chemical maps suggest that the bulk spinel crystal is MgAl2O4 with minor Ti and trace V (Figures 2(c)–(i)).

Figure 2. Microscale to nanoscale imaging and EDS spectroscopy of the CAI. (a) Backscatter electron image of a local region within the Allende CAI containing perovskite (Pv), spinel (Sp), and melilite (Ml). The black line indicates the location of the FIB transect. (b) STEM-HAADF image of a local part of the FIB section ("b") showing the relationship among the perovskite, spinel, and melilite grains. Inclusions of spinel (white arrowheads) occur inside of the perovskite crystal. (c)–(i) EDS maps as indicated (displayed as raw counts) acquired from a local area of the perovskite grain (white box in "b") with HAADF reference image. All maps are constructed from Kα X-ray lines, and the V Kα was deconvoluted from its overlap with Ti Kβ. The maps show the spinel is MgAl2O4 but contains minor V in the bulk and abundant V in the twin boundary. Scale bars equal 100 nm.
Download figure:
Standard image High-resolution imageUpon closer inspection, the spinel inclusion is twinned, and measurements of electron-diffraction patterns reveal that the twinning occurs along the [111] crystallographic direction (Figure 3). High-resolution (phase contrast) TEM (HRTEM) imaging suggests that the twinned spinel crystals are related by a mirror plane, and EDS mapping indicates that V is locally abundant in the twin boundary (Figure 2(i)). However, due to the overlapping energies of the Ti Kβ (∼4.93 keV) and V Kα (∼4.94 keV) X-ray lines, we combined aberration-corrected STEM imaging and chemical mapping with EELS to confirm the location of V and further explore its distribution at and around the twin boundary (Figure 4). The bulk spinel contains ordered columns of Al atoms (bright spots) in projection along the [011] direction. In comparison, the twin boundary contains relatively brighter columns, indicating higher atomic number (Figure 4(a)). EELS spectrum imaging shows that V and trace Ti occupy the bright columns at the twin boundary. A mirror plane along the [111] direction appears to relate the two crystals (see Figures 4(a), (b)), but close inspection of the twin boundary suggests a slight asymmetry in the cation distribution. We note that we did not observe any evidence of hydrated material or zoning profiles in the grains that might otherwise suggest secondary processing could have overprinted or altered the primary micro- to atomic-scale signatures of condensation.
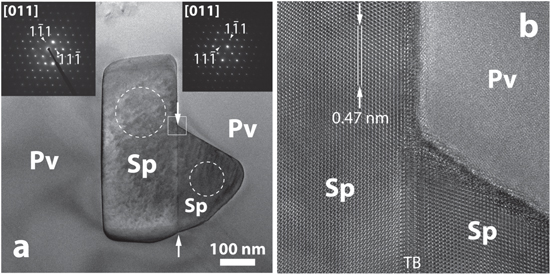
Figure 3. Nanoscale and high-resolution imaging of the perovskite-spinel assemblage. (a) Bright-field TEM image of the local region of the perovskite grain containing the spinel inclusion shown in Figure 1. Selected-area electron-diffraction patterns (inset) confirm the spinel orientation and mirror symmetry of the twinned crystals. (b) Phase-contrast image of the local spinel–perovskite interface (see the white box in "a"). The lattice-fringe contrast shows the mirror symmetry of the (111) planes. The twin boundary appears to be several atomic planes wide in this image; however, such phase contrast does not provide direct information on atomic structure and is sensitive to changes in the defocus value of the image-forming (objective) lens.
Download figure:
Standard image High-resolution image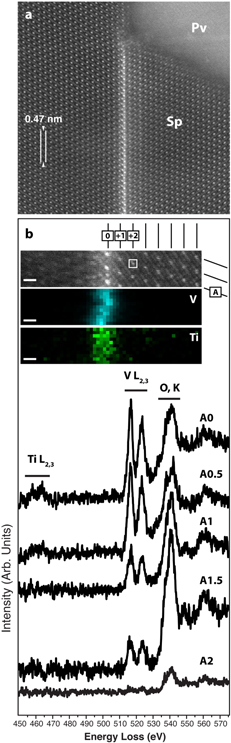
Figure 4. Aberration-corrected imaging and EELS spectroscopy of spinel. (a) Atomic-resolution STEM-HAADF image of the twin boundary in the spinel and its local interface with the host perovskite. The Al columns appear as bright spots in the bulk crystal. The twin boundary contains relatively brighter columns. (b, top) Unprocessed EELS spectrum image (SI). The numbers and letter along the top and sides, respectively, represent the grid system used to locate the extracted spectra. (b, below) EELS maps for V and Ti extracted from the SI showing the local distribution of V columns with minor Ti adjacent to the twin boundary. (b, bottom) EELS spectra, with background removed, showing Ti, V, and O edges acquired at various locations in the SI (see the grid system next to the SI above) and confirm V columns in the twin boundary. The white box in the SI shows the pixel size for extraction of the EELS spectra. O appears as a result of oversampling O columns.
Download figure:
Standard image High-resolution imageWe performed DFT calculations in conjunction with thermodynamic modeling to understand the phase and spatial relationships between spinel and perovskite. Figure 5 shows a phase-stability diagram expressed in terms of pressure–temperature (P–T) space. The model results, which include empirically and DFT-derived thermochemical data, show that perovskite is stable in a very narrow P–T region in the upper part of the composition space (Figure 5, green wedge), signifying its highly refractory nature. In comparison, spinel is stable at much lower temperature (Figure 5, gray to purple bands), suggesting more moderate refractory behavior.
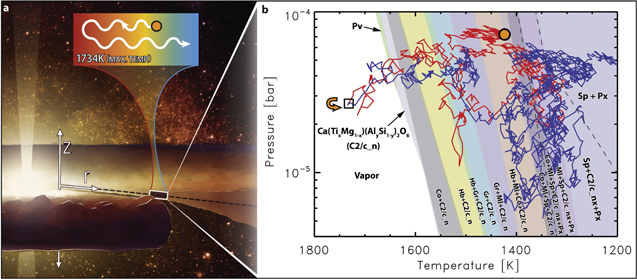
Figure 5. Particle tracking in a dynamic solar protoplanetary disk. (a) Artistic rendition of the solar protoplanetary disk. The cutaway shows the disk cross section, with an indicated coordinate system (Z is the height above/below the midplane indicated by the dashed black line; r is the radial distance from the Sun), and approximate location (white box located at 1.5 au), and illustrates the dynamic history that the modeled particle could have experienced. The callout box above the illustration (depicted with a false-color temperature scale where blue correlates to cooler temperature and red correlates to hotter temperature) shows qualitatively the direction the particle (orange circle with black outline) migrated (wavy lines indicate the random walk) and the maximum temperature it experienced. (b) Dynamic transport calculation for the 1 μm spinel particle (orange dot) that starts out at the midplane of the disk approximately 1.5 au from the Sun. The time between each point is approximately one orbital period (see Appendix C for details). After condensing, the V-bearing spinel (Sp) particle experiences a random walk through the disk to a hotter region (red curve), experiencing changes in pressure and temperature, and can enter the thermodynamic stability fields of more refractory materials such as melilite (Ml), corundum (Co), a solid solution (C2/c), grossite (Gr), hibonite (Hb), and perovskite (Pv). The C2/c solid solution exhibits a miscibility gap with two end-member phases, which are combined here into one name, "C2/c_n," for the sake of clarity. The phase regions separating these two end-members "C2/c_n" are therefore not shown on the phase diagram. The dashed lines show the approximate locations in P–T space where the C2/c end-member phases change their names to pyroxene because they incorporate Si concentrations consistent with pyroxene nomenclature. Out of the two end-members, one of them changes its name at the leftmost dashed line, whereas the other, "C2/c_nx," changes its name at the rightmost dashed line. For a more detailed explanation of the C2/c solid solution and pyroxene thermochemistry, see Appendix B. After the modeled spinel particle transported into a Pv-forming region, it reversed course (at the point inside the black box and highlighted by the orange arrow) and migrated to cooler regions of the disk (blue curve). Some of the thin overlapping phase fields are not labeled but can be inferred from neighboring phase regions.
Download figure:
Standard image High-resolution imageAs a next step, to investigate how spinel could be encased in perovskite, we traced the dynamical evolution of a collection of 1 μm-sized grains (approximately the size of the measured spinel grain) in an evolving protoplanetary disk using particle-tracking methods (Ciesla 2010a, 2011; Ciesla & Sandford 2012). We start with a disk that is very massive and hot, with temperatures of >1300 K inside ∼2 au, and release 1 μm grains where temperatures are ∼1440 K and pressures are ∼10−4 bar (around the midplane at 1.5 au where spinel could condense). We note that the details of the temperature profile of the disk would vary depending on the mass structure and viscous evolution of the disk as well as dust grain compositions and sizes, all of which remain poorly constrained for the time of interest. Our calculations are intended to show plausible thermochemical evolution seen by proto-CAIs in regions where turbulent diffusion is expected to operate and to investigate whether the properties of the grain of interest could be interpreted in this framework.
We followed 100 particles and found that 26 remained outside of 0.1 au for a period of 100,000 yr (the other 74 fall onto the Sun in the model). These "surviving" particles were then examined to see what conditions they were exposed to over their 105 yr lifetime in the disk. Figure 5 shows the pressure and temperature conditions seen by one of such particles, which migrated to hotter regions in the disk (maximum temperature of 1734 K) before migrating outward again to cooler temperatures. Such evolution was common in our simulations; as the predominant motion of gas and solids in the disk is inward, it was common for grains to experience some inward migration and exposure to higher temperatures early in their transits. However, the probability of survival of such grains is highest when they retreat from the high-temperature region early to avoid getting caught in the inward flow onto the star. As a result, a common feature in the surviving particles is that they are heated somewhat beyond their initial temperature but only briefly, meaning that while the details for each would vary, the general behavior shown here is a common feature of CAIs in the framework of the model presented here.
4. Discussion
Among CAIs, the FTAs are characterized by their nodular aggregate structures, primitive refractory bulk composition, and primitive isotopic composition (MacPherson 2014). The phases that occur within FTAs can retain the original signatures of condensation from the early solar nebula. In the case of spinel and perovskite, these "primary" phases are believed to have condensed out of the nebular gas (MacPherson & Grossman 1984), and depending on the total modeled pressure, closed-system thermodynamic modeling predicts that perovskite generally condenses prior to spinel from a gas of solar composition (e.g., Lodders 2003; Ebel 2006). The spinel inclusion inside of perovskite is therefore at odds with predictions, raising questions as to whether explanations other than condensation could explain the spatial relationship observed here. We note that secondary phases were reported within the inclusion we describe here (MacPherson & Grossman 1984), including nepheline, anorthite, grossular, sodalite, andradite, high-Ca pyroxene, and wollastonite, suggesting later-stage alteration (Cosarinsky et al. 2008). However, such alteration was reported to be more abundant in the outer margin of the CAI where it contacts the Wark–Lovering rim that surrounds it (Cosarinsky et al. 2008), which is hundreds of microns away from where we sectioned it. That we did not observe such phases locally suggests that such secondary processing is highly unlikely in explaining a spinel inclusion inside of the perovskite. Another possibility is that the spinel is presolar in origin, having formed in the circumstellar environment of a nearby star that was transported to the early solar system. Such a scenario would require the survival of the spinel grain during interstellar transport to the CAI formation region in the inner and early solar protoplanetary disk. O-isotopic measurements of the spinel, which are beyond the scope of this paper and at the spatial limit of modern secondary ion mass spectrometer techniques, would be required to confirm a presolar origin. That said, comparison of this spinel grain with that of presolar spinel argues against a circumstellar origin for several reasons. Compared to the spinel we report on here, TEM studies on presolar Mg–Al spinel have not, to our knowledge, revealed twinned structures, and presolar spinel grains tend to be anhedral (Zega et al. 2014, 2020). Second, presolar spinel occurs at the ∼200 ppm level in the matrices of primitive meteorites (Nguyen et al. 2007) and so the probability that we identified presolar spinel inclusions in three out of the four randomly chosen perovskite grains in this CAI is highly unlikely. We therefore rule out presolar and secondary alteration as origins for the spinel we observe here.
Thus, as revealed by the nano- to atomic-scale structure, the V-alloyed spinel condensed prior to perovskite, and compared to the available thermodynamic models, this order of condensation is the reverse of what is predicted. From a thermodynamics point of view, such a discrepancy could be due to the effect of V as a solute element on the condensation temperature of spinel, condensation occurring in a gas composition other than solar, the grain not following monotonic cooling profiles, or condensation not occurring in a closed system. The former hypothesis demands an extension of available thermodynamic models to one that includes a V-alloyed spinel solid solution, whereas addressing the latter requires an "open nebula" framework to describe the condensing system wherein spinel condensed in a lower temperature region of the disk and subsequently transported to a higher-temperature region where perovskite could condense around it.
Assuming a monotonically cooling gas of solar composition, as typical of previous studies, our calculations show that if V is included as a solute element, the temperature at which spinel condenses increases slightly but not enough to enable spinel and perovskite condensation in the same pressure–temperature (P–T) space. As shown in Figure 5, perovskite condenses between 1637 and 1682 K, depending on the total pressure, and there is a ∼200 K gap between the P–T space of perovskite and spinel. In short, even robust thermodynamic models of solid solutions, within a cooling closed system, do not explain the origin of this assemblage. Thus, a dynamically evolving system is required.
Due to the high temperatures at which their minerals form, CAIs have long been hypothesized to form in the hot, inner regions of the solar nebula. Preserving these objects for millions of years in order to accrete in the meteorite parent bodies in which they are found requires a dynamic disk that carries them outward to avoid falling onto the Sun. Models that follow the viscous evolution of the disk, where it expands radially to offset the inward accretion of mass, have shown such preservation is possible (Cuzzi et al. 2003; Ciesla 2010a, 2010c; Jacquet et al. 2011). In such models, the inner 1–3 au of the disk are initially at sufficiently high temperatures to allow for vaporization and condensation of the minerals found in CAIs. Due to turbulence and outward flows of gas, solids undergo a kind of random walk out of this CAI factory and migrate to larger radial distances, away from the Sun. As a result of the random motions associated with each particle's migration and the general cooling and decrease in disk mass, these solar nebula condensates will be exposed to an array of P–T conditions that will drive their chemical evolution over time. Our dynamical model (Figure 5) allows for such a spinel grain to see a range of P–T conditions, i.e., to migrate to hotter regions in the disk (maximum temperature of 1734 K) before migrating outward again to cooler temperatures. Grain growth into larger aggregates during transport is possible, but the lifetime before significant growth occurs is estimated between 100 and 1000 yr (Misener et al. 2019). Such transport raises questions about survivability and chemical alteration of the spinel grain as governed by the underlying thermodynamics and kinetics. In other words, under such conditions, we must examine how the grain may be altered from its original state.
There are several possible chemical reactions above 1430 K that could theoretically alter the spinel grain along its trajectory before or after it becomes encased within perovskite through diffusion-controlled processes. The most likely chemical pathways, based on the thermodynamic driving force (minimizing Gibbs free energy), include sublimation of the spinel grain, backreaction with the gas phase, or both to form corundum (Al2O3), hibonite (CaAl12O19), grossite (CaAl4O7), melilite (Ca2Al2SiO7), or pyroxene [Ca(Ti, Mg)(Al, Si)2O6], which are the other stable oxide phases in this temperature and pressure regime (Figure 5). For any such sublimation or backreaction to occur requires diffusion within the solid, which in this case is the spinel grain, and of the components in spinel, O has the smallest diffusion coefficient (Ando & Oishi 1974; Reddy & Cooper 1981; Chiang 1985; Sheng et al. 1992; Ryerson & McKeegan 1994). Using the diffusion coefficient, we can therefore make estimates of the survivability of spinel (see the notes in Appendix B and Table 2). Our model shows that the spinel particle spends three years at a temperature of approximately 1550 K, which is close to the average between the ∼200 K temperature gap between the P–T space of spinel and perovskite, i.e., 1430 and 1637 K, along its trajectory. Assuming this average temperature, we obtain an oxygen diffusion time of ∼1 yr for a spinel particle of 1 μm. We note that this is probably an upper limit given that diffusion need not necessarily have occurred across the entire 1 μm particle, i.e., it could have occurred from the center to the edge. In comparison, our model shows that the particle spends approximately 0.5 yr at a temperature of 1600 K, and at this temperature we obtain an oxygen diffusion time of approximately 0.3 yr. In other words, the timescales of particle transport and internal diffusion of oxygen are comparable, and so survival of the particle along the trajectory is distinctly possible.
The other possibilities of transport of corundum, hibonite, grossite, or pyroxene to perovskite P–T space and subsequent conversion to spinel, to explain the observed microstructure, is ruled out based on the TEM data. Such a conversion requires diffusion of Mg, Si, or both from the surrounding nebular gas into the perovskite hosting, respectively, a hibonite, corundum, grossite, or pyroxene grain. The tests of these hypotheses would be Ca or O nonstoichiometry, Ca inclusions, or residual Mg or Si in the perovskite or Ca or Si in the spinel (partial or full replacement of one phase by another and incorporating the host's solutes; e.g., Simon et al. 2019). Neither the EDS mapping nor the high-resolution imaging shows Ca inclusions. Regarding the phases, there is no indication of nonstoichiometry based on our EDS and SAED data. In terms of residual Mg or Si in the perovskite and Ca and Si in the spinel that would otherwise indicate incomplete solid-state reaction, we extracted from our maps summed EDS spectra in a region within the center of the spinel grain and a region in the bulk perovskite approximately 150 nm away from the spinel. We do not detect Ca or Si in the spinel grain or Mg or Si in the perovskite (see Appendix A and Figure 16). A further possibility is that the spinel could have been protected by another phase before perovskite condensed around it, but we do not observe any evidence for a third phase at the interface between the spinel and the perovskite.
Thus, we rule out these possibilities of other inclusions in perovskite getting converted to spinel or protection by a third phase and conclude that the spinel must have condensed in one location at ∼1430 K and was subsequently preserved as it was transported to a region of the disk where perovskite condensed around it at ∼1637 K. We cannot infer the timescales of such transport from the thermodynamic data, but it occurred in such a way that the spinel was protected and encased within perovskite before it could be destroyed.
While this is simply one of many possible locations for such a spinel grain to have condensed and traveled, our approach demonstrates a way in which thermal and protoplanetary disk models can be combined to probe the thermodynamic landscape of the early solar nebula. Indeed, an important realization from our calculations is that grains are likely to see a diversity of P–T conditions around the CAI formation zone, which will lead grains to experience a variety of chemical environments and reactions after the grain "forms." One obvious way for the spinel to have experienced higher temperatures is for it to have migrated inward toward the Sun. Such transport could also have brought the grain into a region where Ca–Ti–O molecules were condensing and provided a suitable surface on which they could heterogeneously nucleate, protecting the spinel surface from evaporation. While one could invoke a similar evolution, with kinetic inhibition of some reactions, within the framework of previous condensation models, we note that a natural outcome of the dynamic modeling presented here, and more generally all models of solids in protoplanetary disks, is that solids and gas will follow different dynamical paths within the solar nebula (e.g., Cuzzi & Weidenschilling 2006). In other words, the grain would separate from the vapor it was bathed in when the spinel first formed. Thus, this evolution necessitates an open-system framework and not the closed system on which previous thermodynamic models were based. Such condensation of spinel followed by its removal from its accompanying gas would represent a fractional condensation process that formed the observed microstructure. We note previous calculations (Petaev & Wood 2005) in which a fraction of condensable material was removed from further reaction with the residual nebular gas, thereby approximating open-system behavior, although transport was not explicitly modeled. Interestingly, assuming a total pressure of 10−4 bar, the calculations (Petaev & Wood 2005) show that perovskite condenses at ∼1620 K, whereas spinel condenses at ∼1420 K and is stable to ∼1360 K. While our calculations do not precisely match, they show reasonable agreement in the condensation temperatures as well as a ∼200 K gap between the perovskite and spinel stability fields, which would still necessitate transport.
We acknowledge that such open-system behavior may indeed change the bulk composition of the condensing system, in this case the high-temperature region of the disk where CAIs are expected to form. Approximating how chemical fractionation might have occurred is not trivial. Nonetheless, to get some insight into how condensation temperatures and the sequence of phases change as a result of fractionation in the disk due to dynamics, we performed additional calculations that vary the abundance of Mg, a major nebular and CAI chemical component, and hence the Mg/Si ratio relative to solar composition. We find that while the absolute temperature of condensation changes, the sequence in which these phases condense does not (see Appendix B, Table 1). Thus, transport of spinel to a higher-temperature region where perovskite is condensing is a viable hypothesis.
As demonstrated in previous modeling studies, the condensation temperatures of several of the CAI phases can indeed be very close to one another depending on the pressure in the system. Thus, it is tempting to suggest that changes in pressure in a closed system could reproduce phase assemblages reported here or those previously reported in the literature. However, the challenges with this approach are multifold: (1) a physical cause for the required changes in pressure needs to be stated just as we show here that the dynamical evolution of the early solar nebula would naturally lead to variations in temperature and open-system behavior, (2) the thermodynamic stabilities for these phases for the full range solute chemistry are not known, and related to these, (3) ad hoc assumptions about changes in disk chemistry may lead to inaccurate predictions.
Finally, we note that twinning in spinel structures has been the subject of study by many workers over the past decades. A detailed description of these studies is beyond the scope of this paper, but we provide a brief explanation for the purpose of understanding the atomic-scale structure and V segregation of the spinel observed here. We refer interested readers to early papers by Iida (1957) and Hornstra (1960). In general, twinning occurs as a result of faulty atomic stacking along specific directions. In spinel, such directions include the [110] and [111], and the nature of the resulting twin depends on which layer of the spinel lattice the slip plane coincides, e.g., the O layer, the mixed Al–Mg layer, or the Kagome layer (Hornstra 1960; Mitchell 1999). For {111}-type twins, the symmetry operation that relates the two crystals is either a reflection across a (111) plane or a 180° rotation about a [111] axis. For (111) twins, Daneu et al. (2007) used HRTEM to examine {111} twins in terrestrial spinel and found that they are best described by 180° rotation of the oxygen sublattice normal to the twin plane. Compared to these previous studies, the twin boundary of the spinel measured here (Figure 4) shows local asymmetry in the cation distribution, which would appear to argue against mirror symmetry across the (111) plane. However, the SAED patterns of the bulk spinel on either side of the twin boundary show clearly that such symmetry occurs. We note that HAADF imaging is sensitive to cations, i.e., in this case, Mg and Al (see Carter & Williams 2016). So, the mirror symmetry on the O sublattice, while not evident in the HAADF image, is represented in the SAED patterns (Figure 3). Thus, our data are consistent with the Daneu et al. (2007) model in which the (111) twin is best described by 180° rotation of the oxygen sublattice about an axis normal to the twin plane or a mirror reflection across the (111) twin plane (the two symmetry operations are equivalent on the oxygen sublattice). The nature of this twin boundary provides additional insight into temperature within the environment in which the perovskite and spinel formed.
Experimental studies have shown that CaTiO3 perovskite exhibits two displacive phase transitions from its high-temperature cubic structure to a tetragonal structure at ∼1573 K followed by tetragonal to orthorhombic at ∼1473 K (Becerro et al. 2002). We hypothesize that the perovskite that condensed on the surviving spinel grain at ∼1680 K imparted stress to the embedded spinel as a result of its displacive phase transitions in the solid state and caused twinning. V, which was originally homogeneously distributed in the spinel, as suggested by our EDS measurements (Appendix A and Figure 16), segregated to the twin boundary due to a favorable thermodynamic driving force. To test this hypothesis, we performed DFT calculations of (111) twins in spinel. Our calculations predict a twin-formation energy of 946 mJ m−2 in the pure spinel phase. In comparison, if V substitutes for Mg or Al in or near the twin boundary, the twin-formation energy in the spinel is favorably reduced. V segregation lowers the twin-formation energy by 54 and 94 mJ m−2 at Mg and Al sites in the mixed-cation layer, respectively. While the absolute value of the energy of twin formation has thermodynamic significance, what is more important in the context of testing the hypothesis here is the fact that the energy of formation decreases if V is included in the computation. In other words, the segregation of dissolved V in the spinel at (111) twin boundaries is therefore thermodynamically favorable, providing the driving force to explain V-decorated (111) twins in the spinel as observed in the Cs-corrected STEM measurements.
5. Conclusions
It is clear from the above observations and computational effort that some assemblages within the oldest solar system solids deviate from long-standing assumptions and, rather than remaining in contact with the same parcel of gas in a monotonically cooling system, are admixed into other regions, possibly warming once or multiple times before cooling down in the disk. Indeed, this mixing and transport are necessary for the preservation of CAIs for millions of years and the delivery of CAI-like grains to outer regions of the solar nebula to be accreted by comets as revealed by the Stardust mission (Brownlee et al. 2006). Accurate deduction of the thermal landscape of the solar nebula and characterization of equilibrium versus nonequilibrium processes demand an open-system framework with thermodynamic models that incorporate a full range of solid-solution chemistry for these refractory materials. As atomic-resolution analysis of planetary materials reveals fundamentally new chemistry, moving forward, it will play a crucial role in developing new paradigms to explain early solar system processes. Our work here shows that a combined approach incorporating DFT, thermodynamics, and dust dynamic modeling is a step forward in this direction and that integrating these efforts will allow us to better decipher the record of processes contained in meteoritic, cometary, and interplanetary samples.
Research supported by the NASA Emerging Worlds Program (NNX15AJ22G and 80NSSC19K0509, T.J.Z., K.M., V.R.M., and F.J.C.) and the NASA Origins Program (NNX14AG97G, F.J.C). The results reported herein benefited from collaborations and/or information exchange within NASA's Nexus for Exoplanet System Science (NExSS) research coordination network sponsored by NASA's Science Mission Directorate. T.J.Z. gratefully acknowledges NASA (grants #NNX12AL47G and #NNX15AJ22G) and NSF (grant #1531243) for funding of the instrumentation in the Kuiper Materials Imaging and Characterization Facility at the Lunar and Planetary Laboratory, University of Arizona. Resources supporting this work were provided by the NASA High-End Computing (HEC) Program through the NASA Advanced Supercomputing (NAS) Division at Ames Research Center. We also acknowledge the High Performance Computing (HPC) resources at the University of Arizona. We thank Jessica Barnes, Pierre Haenecour, and Prajkta Mane for a review of the manuscript, Dante Lauretta for discussions on thermochemistry, and members of the Planetary Materials Research Group at LPL for helpful discussions. We also thank Heather Roper and Erin Morton at LPL for help with graphics preparation. We thank Ian Cotton, Rod Baird, Phil Bryson and the Hitachi High-Tech Corp. Team for helping to build a partnership. We thank three anonymous referees for their constructive reviews that helped improve the manuscript.
Appendix A: Sample and Analytical Methods
Local parts of the CAI were mapped for their composition using EDS in the FIB, and the sections extracted from these local areas were mapped with STEM-EDS for overall composition (Figures 6–16). Of the four FIB sections we studied in detail, we identified spinel inclusions within three perovskite grains ("a," "b," and "c"). Figures 7, 8, 10, and 15 show dark-field images and corresponding EDS maps of areas of the perovskite grains containing the spinel inclusions. Correlative Mg and Al maps, revealing spinel, can be observed within the perovskite (correlative Ca and Ti maps) grains. This paper reports on inclusion "b" in detail. Figure 16 shows a summed EDS spectrum extracted from the bulk spinel crystal and the bulk perovskite crystal to test the hypotheses proposed in the main text.
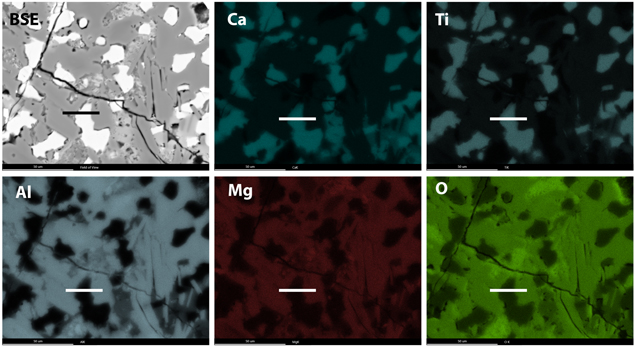
Figure 6. BSE image and EDS maps of a local part of an FTA from the Allende CV3 chondrite. The black line and white lines indicates the location of the FIB transect for perovskite grain "a."
Download figure:
Standard image High-resolution image
Figure 7. STEM data on perovskite grain "a." The high-angle annular-dark-field (HAADF) image and false-color EDS maps show that spinel (Sp) occurs within the perovskite (Pv) grain.
Download figure:
Standard image High-resolution image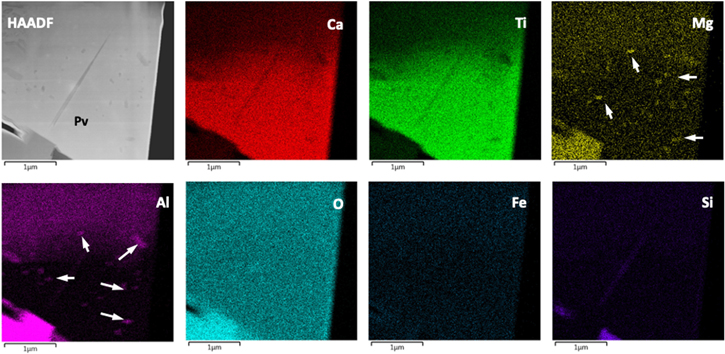
Figure 8. STEM data on the perovskite region in grain "a." Spinel (Sp) inclusions (white arrows) occur within the perovskite (Pv) grain.
Download figure:
Standard image High-resolution image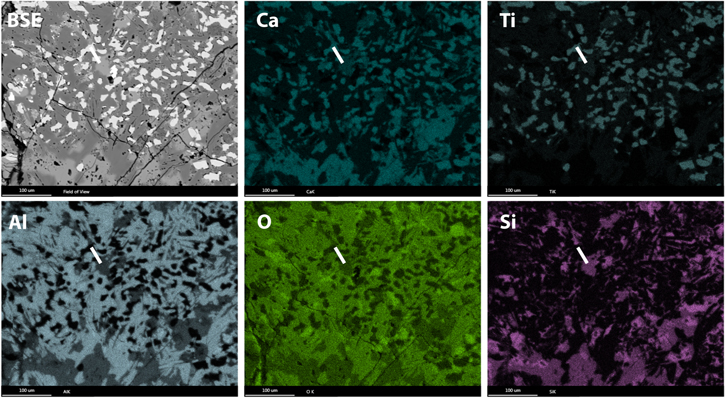
Figure 9. BSE image and EDS maps of a local part of an FTA from the Allende CV3 chondrite. The white line indicates the location of the FIB transect for perovskite grain "b," which we report on in the manuscript.
Download figure:
Standard image High-resolution image
Figure 10. STEM data on perovskite grain "b," which is the focus of the manuscript. The large spinel (Sp) grain (shaped like an iPhone) occurs inside of the perovskite. The dark rectangular region in the upper-left part of the HAADF image and the EDS maps (bright in the BF image) is a result of additional FIB thinning for EELS analysis.
Download figure:
Standard image High-resolution image
Figure 11. BSE image and EDS maps of a local part of an FTA from the Allende CV3 chondrite. The black line and white lines indicate the location of the FIB transect for perovskite grain "c."
Download figure:
Standard image High-resolution image
Figure 12. STEM data on perovskite grain "c." No spinel inclusions were found inside of the perovskite.
Download figure:
Standard image High-resolution image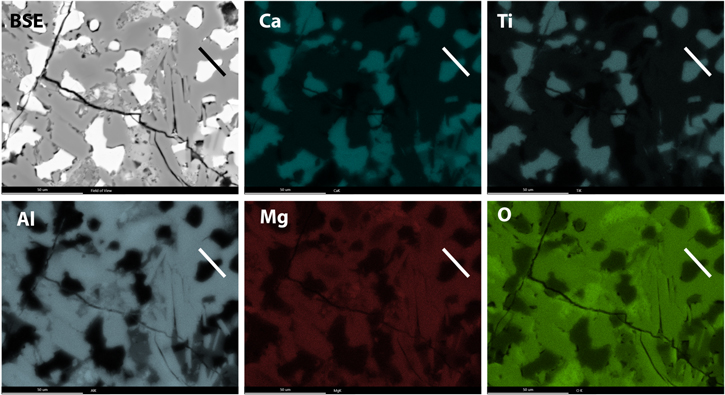
Figure 13. BSE image and EDS maps of a local part of an FTA from the Allende CV3 chondrite. The black line and white lines indicate the location of the FIB transect for perovskite grain "d."
Download figure:
Standard image High-resolution image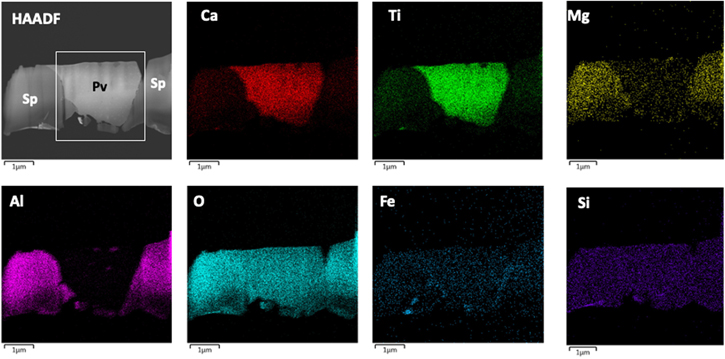
Figure 14. STEM data on perovskite grain "d." Spinel inclusions were identified within perovskite. The white box indicates the are from which higher resolution EDS maps were acquired as shown in Figure 15.
Download figure:
Standard image High-resolution image
Figure 15. STEM data on perovskite grain "d." Spinel inclusions (white arrows) occur within perovskite (see the Mg and Al EDS maps).
Download figure:
Standard image High-resolution image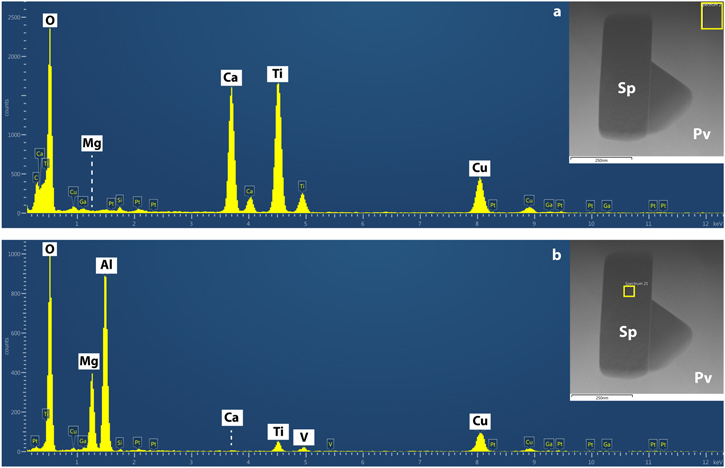
Figure 16. Representative EDS data from the bulk spinel and perovskite grains. (a) Summed EDS spectrum acquired from a region in perovskite located approximately 150 nm away from the spinel grain as shown by the yellow box in the HAADF image (inset). (b) Summed EDS spectrum acquired from the central part of the spinel grain as shown by the yellow box in the HAADF image (inset). Peaks of major elements labeled in white boxes; artifact peaks shown in blue boxes (Cu from the grid, Ga and Pt from FIB sample preparation, Si from a system peak). The perovskite grain contains Ca, Ti, and O as expected with no residual Mg or Si. The spinel grain contains Mg, Al, and O, with minor Ti and V, but no residual Ca or Si.
Download figure:
Standard image High-resolution imageAppendix B: Density-functional Theory (DFT) Calculations and Thermodynamic Modeling
B.1. Density-functional theory
The first-principles spin-polarized calculations are performed with VASP (Kresse & Furthmueller 1996). The ion–electron interactions are described by the PAW (Kresse & Joubert 1999) method within the GGA as described by Perdew–Burke–Ernerzohf (Perdew & Zunger 1981; Perdew et al. 1996). A plane-wave cutoff energy of 520 eV, which is 30% higher than the default cutoff energy on the oxygen potential, is employed for the valence electrons. The Brillouin zone sampling of different oxide phases is performed using k-point meshes of different sizes based on the size of the unit cells. First-principles calculations of solid solutions of V-alloyed MgAl2O4-spinel, Al2O3, and CaTiO3-perovskite are performed using SQS. In the case of spinel, while supercells with 168 atoms were calculated, supercells of 100 atoms were employed for the perovskite and corundum solid solutions. The supercells were relaxed for volume and ionic positions while preserving the symmetry of the crystals. The enthalpies of mixing are obtained from the so-relaxed SQS cells with preserved symmetry. The 〈111〉 twins in the V-alloyed MgAl2O4 spinel were calculated using 344-atom supercells.
The vibrational contributions to the free energy are predicted using the Debye–Gruneisen approach. The ground state energy as a function of volume is predicted from the DFT calculations and the so obtained E–V curve is described by Birch–Murnaghan, Equation (1), with a, b, c, and d representing the fit parameters:

The Debye temperature θD within the Debye–Gruneisen approach can be calculated from the properties obtained from the ground state equation of state (EOS) and in general is defined as follows (Birch 1947, 1978):

where
γ
is the Gruneisen constant describing the anharmonic effects of the vibrating crystal lattice and can be approximated either based on Slater (1939) or Dugdale & MacDonald (1953) expressions as given by ![$\gamma =\left[\tfrac{\left(1+B{{\prime} }_{0}\right)}{2}-x\right]$](https://content.cld.iop.org/journals/2632-3338/2/3/115/1/psjabf5e5ieqn1.gif) . Here "x" is an adjustable parameter and is 2/3 for high temperatures (greater than θD
) and 1 for low temperatures. A is a constant and
. Here "x" is an adjustable parameter and is 2/3 for high temperatures (greater than θD
) and 1 for low temperatures. A is a constant and  , V is volume/atom in Å3, B0 is the bulk modulus in GPa and M is the atomic weight. B0 and V0 are obtained from Equation (1), while the reported Debye temperature θD
was evaluated for V = V0. B' is the first derivative of B0 with respect to pressure. s is a scaling factor and is estimated based on a preliminary analysis for reproducing experimental θD
for the perovskite material. The Helmholtz free energy F(V, T) is obtained as follows:
, V is volume/atom in Å3, B0 is the bulk modulus in GPa and M is the atomic weight. B0 and V0 are obtained from Equation (1), while the reported Debye temperature θD
was evaluated for V = V0. B' is the first derivative of B0 with respect to pressure. s is a scaling factor and is estimated based on a preliminary analysis for reproducing experimental θD
for the perovskite material. The Helmholtz free energy F(V, T) is obtained as follows:
B.2. Thermodynamic Modeling
Thermodynamic modeling of the phases was carried out within the CALPHAD framework. The details of that computational method are discussed in the main text. Nonetheless, we provide the predicted condensation temperatures of various mineral phases at total pressures of 10−4 and 10−3 bar in Table 1. The stability of various mineral phases as a function of temperature is shown in Figure 17.

Figure 17. Thermodynamic stability diagram for various mineral phases shown as function of temperature assuming equilibrium condensation in a solar-composition gas (10−4 bar). The thermodynamic parameters of the pyroxene solid solution Ca(Ti, Mg)(Al, Si)2O6 was modeled using density-functional theory, and its stability was then calculated for the condensing system.
Download figure:
Standard image High-resolution imageTable 1. Predicted Equilibrium Condensation Temperatures (T) of Mineral Phases as a Function of Total Pressure (PT ) and Three Different Compositions of the System: Solar Abundances, a Mg-enriched Gas 10× Relative to Solar, and a Mg-depleted Gas 0.1× Relative to Solar
| Phase Composition | Phase Name | Condensation Temperature (K) [Solar] | Condensation Temperature (K) [Mg] × 10 | Condensation Temperature (K) [Mg] × 0.1 |
|---|---|---|---|---|
| CaTiO3-HT(SS) | Perovskite - high temperature (solid solution) | 1679 | 1679 | 1679 |
| Ca(Ti, Mg)(Al, Si)2O6 | C2/c solid solution including pyroxene | 1672 | 1672 | 1672 |
| Al2O3 | Corundum | 1657 | 1657 | 1656 |
| CaAl12O19 | Hibonite | 1636 | 1636 | 1635 |
| CaAl4O7 | Grossite | 1582 | 1582 | 1581 |
| Ca2Al2SiO7 | Melilite | 1533 | 1533 | 1532 |
| Mg(Al, V)2O4(SS) | Spinel solid solution | 1433 | 1471 | 1356 |
Note. Thermodynamic parameters for mineral solid solutions (SS) were modeled using density-functional theory as described above within the CALPHAD framework.
Download table as: ASCIITypeset image
Regarding the methodology here, we have for the sake of simplicity constrained ourselves to equilibrium thermodynamics. Our goal was to test whether thermodynamic modeling would predict spinel to condense at a higher temperature than perovskite, thereby matching the observed microstructure, if thermochemical data for a much larger range of solid-solution chemistry is included in the computation. One could test alternative scenarios within a closed-system framework to include (i) complete equilibrium calculations with different compositions and total pressures of nebular gas, (ii) deviations from equilibrium by inducing metastable phase relations, i.e., suppressing some of the stable phases and calculating other phases of interest, and (iii) incorporation of the effects of kinetics, i.e., by considering various cooling rates and supersaturations under the conditions of heterogeneous and homogeneous nucleation. We briefly describe how we considered these three scenarios. However, out of all the scenarios, the open-system explanation that was provided in the manuscript, we believe, is the simplest explanation to describe the observed spinel–perovskite condensation anomaly.
Under scenario (i) of complete equilibrium with different compositions and total pressures of the nebular gas, we tried changing the Mg/Si ratio of the solar gas to see if the 200 K gap between spinel and perovskite could be decreased. We find that the gap decreases by ∼38 K if we increase the Mg concentration by an order of magnitude, which still is not enough to allow simultaneous condensation of spinel and perovskite. See the discussion section of the article.
Within the partial or metastable condensation scenario (ii), we calculated the condensation temperature of perovskite and spinel while suppressing the other stable phases of hibonite, melilite, pyroxene, and grossite. There is no obvious reason why such suppression should have occurred within the solar protoplanetary disk itself, but we made this calculation for the sake of completeness if the gas was cooling so rapidly that some phases did not have time to nucleate. We find that by suspending the pyroxene solid solution, it is possible to have overlapping stability fields for spinel and perovskite (the low-temperature polymorph) at 10−4 bar. In a similar scenario, if we suppress all other high-temperature phases above 1400 K, spinel can condense at 1646 K and exhibit overlapping stability with perovskite.
We also considered scenario (iii) involving homogeneous and heterogeneous nucleation in conjunction with supersaturation (in the nebular gas) in which phases condense at temperatures different from their equilibrium condensation temperature. To be clear, we did not do any computational work along these lines because such a systematic study is a large effort in and of itself and beyond the scope of the present work. Nonetheless, based on work by Grossman et al. (2012), we find this scenario unlikely. In that study, they modeled homogeneous nucleation with supersaturation. For analogous materials like corundum and some more volatile materials like forsterite and metal, the supersaturation ratios have to be increased by three orders of magnitude above solar composition for their condensation temperatures to change up to 250 K. In comparison, for spinel's condensation temperature to drop over 200 K to condense prior to perovskite, the supersaturation ratio would have to be increased to similar levels or above. This scenario seems highly unlikely without invoking some ad hoc reason to change the nebular gas composition by such large amounts. If we extend this reasoning further, alternatively, for perovskite to condense at T < 1400 K after spinel, the assumptions of degree of supersaturation and absence of heterogeneous nucleation sites are also highly improbable. This scenario would require that previously condensed phases such as corundum, hibonite, and grossite, which could otherwise provide heterogeneous nucleation sites for the condensation of perovskite, be absent. In other words, this scenario is analogous to assuming that the entire condensation started at 1400 K.
We also note that from a modeling perspective, the gas phase is always in equilibrium with the local T and P field because the gas-diffusion coefficients are very fast. In comparison, the solid-state diffusion coefficients are much slower (by orders of magnitude), and so the solid does not evolve as rapidly. As a result, the structure and chemistry of the solid do not change appreciably between transport from one parcel of gas (stability field) to another. Although the dynamics imply separation of the particle from the gas it formed from, the thermochemical model considers the particle as moving from one gas box to another gas box with a new gas composition. So, in the model, there is no contribution from the original gas box in which the particle formed. The equilibrium modeling looks at the initial and final states of the system. To be clear, the equilibrium approach does not incorporate the rates of chemical reactions or the timescales of transport. Modeling such chemistry requires knowledge of the rates of a myriad of reactions, which are simply unknown at this time.
Lastly, we provide a brief note on the thermodynamic modeling and nomenclature of pyroxenes. The pyroxene phase is modeled by employing a four-sublattice model (Ca2+)(Ti4+,Mg2+)(Al3+, Si4+)2(O2−)6 involving only Ti4+. A complete model with Ti3+ will be described in a separate article including first-principles predicted thermochemical data and modeling of this phase. Here in this preliminary model, we find that the phase exhibits a miscibility gap with two end-member compositions: CaTiAl2O6 and CaMgSi2O6. It is important here to discuss the CaTiAl2O6 end-member in terms of its occurrence and thermochemical data. The pure CaTiAl2O6 phase has not, to our knowledge, been identified in earth and planetary materials or reported from any synthetic routes, although Mason (1979) suggested it might occur in the Angra dos Reis angrite. However, CaTiAl2O6 is reported in meteoritic and terrestrial pyroxene solid solutions as a constituent in various percentages (see Brearley & Jones 1998). Thus, there are limited attempts to assess the free energy of such an end-member in models of pyroxenes (e.g., Ottonello et al. 1992; Sack & Ghioroso 1994, 2017). Nonetheless, where such assessments are attempted, free energies are reported with conditions in terms of their validity range in the composition space of the pyroxene solid solutions.
In our work, as mentioned earlier, we are employing DFT to predict the enthalpy and entropic contributions to the free energies of the pure CaTiAl2O6 phase. A pertinent question to the modeling of this pure phase is about its dynamical stability and if this phase can have a "meaningful" entropy. It is a common practice to assign free energies to hypothetical and/or unrealized compounds, e.g., the CaTiAl2O6 end-member, in thermodynamic modeling methodologies, and there has been debate in the thermodynamics community about the meaning and limitations of such energies (Turchi et al. 2007). If C2/c CaTiAl2O6, in its pure form, is dynamically unstable, due to imaginary phonon modes in its phonon dispersion, then its vibrational entropy has no meaning and so its free energies are also meaningless (Turchi et al. 2007). We note that in this preliminary model, the free energies are assessed without examining them for dynamical stability. The DFT-predicted enthalpies from 0 K calculations resulted in ∼−62 kJ mol−1 for CaTiAl2O6 with respect to the CaO, TiO2, and Al2O3 reference states. While an assessed enthalpy of ∼−67 kJ mol−1 can be used, the preliminary model of CaTiAl2O6 is calculated with enthalpy and entropy of formation of ∼−75 kJ mol−1 and 16.35 J mol−1 K−1, respectively, based on end-member data from Barin (1995), with respect to the aforementioned reference states.
Using the DFT-derived enthalpy and entropy of formation, this model predicts CaTiAl2O6 to condense at 1660 K as a C2/c end-member. However, as mentioned earlier, such a pure compound has not yet been identified naturally or synthetically, which demands an examination of its stability at finite temperatures at least within the computational approaches. The phonon dispersion of the C2/c structure can reveal if there are any imaginary phonon modes to examine for its dynamical instability and for a "meaningful" vibrational entropy. If it is dynamically unstable in its pure form, a follow-on question to be investigated would be at what level solutes such as Mg or Si remove the dynamical instability and make the phase stable. Hence, the calculation of CaTiAl2O6, and its relationship with other phases in this P–T space can be claimed to be a true prediction after the aforementioned examination. A detailed discussion and a complete model will be presented in a separate modeling paper. For the purposes here, interested readers should consider the solid solution, rather than the pure CaTiAl2O6, as a stable phase in the modeled P–T space.
Further, regarding nomenclature, pyroxenes occur in orthorhombic and monoclinic structures and are accordingly referred to as orthopyroxenes and clinopyroxenes. Monoclinic or clinopyroxenes occur in three different space groups as C2/c, P21/c, and P2/n based on their composition and thermodynamic histories. According to the International Mineralogical Association, pyroxene as a mineral name is restricted to those phases where Si occupies at least 50% of the tetrahedral (T) site (Morimoto et al. 1988). Thus, here we refer to any modeled phase within the (Ca 2 +)(Ti4+, Mg2+)(Al3+, Si4+)2(O2−)6 solid solution containing less than 50% Si as simply "C2/c." When Si occupies ≥0.5 of the T site, we refer to it as pyroxene. This naming convention is shown in Figure 5.
B.3. Diffusion Timescales and Particle Survival
The survival of the transported spinel particle along its trajectory in the high-temperature regions above its stability field (see Figure 5) is dependent on the kinetics of its evaporation and/or chemical alteration of other phases. For spinel to remain intact as a phase, which our TEM data tells us it has, it must retain its cubic structure, space group Fd-3 m, and its stoichiometric MgAl2O4 composition. In other words, grain survival is material dependent. We can get some estimate of grain survival if grain sublimation in the solar protoplanetary disk is controlled by solid-state diffusion.
Thus, here we predict the survival times of a 1 μm spinel grain along its modeled trajectory (Figure 5). To that end, we employ the Einstein–Smoluchowski equation of diffusion (Mehrer 2007)

to predict the time for diffusion of O2−, which is the slowest-moving ion in spinel, across a 1 μm length scale (the size of the spinel grain—see Figures 1–3). In Equation (4),  is the tracer self-diffusion coefficient of O2−, f is a correlation factor that depends on the crystal structure and the diffusion mechanism (for fcc crystals like spinel, f is approximately 0.7–0.8), d is the diffusion length, and t is time. Table 2 shows the predicted timescales for O2− transport within spinel, which are comparable to the timescales of the particle's modeled transport within the disk.
Table 2. Diffusion Times for a 1 μm-sized Grain Using the Einstein–Smoluchowski Equation of Diffusion
| T (K) | D (m2 s−1) | f = 0.781 Time of Diffusion in Years (No Error) a | f = 0.781 Time of Diffusion in Years (Positive Error) a | f = 0.781 Time of Diffusion in Years (Negative Error) a | Particle-transport Time (yr) |
|---|---|---|---|---|---|
| 1500 | 1.88E-21 | 2.199 | 2.391 | 2.246 | 5 |
| 1550 | 5.34E-21 | 0.774 | 0.796 | 0.834 | 3 |
| 1600 | 1.42E-20 | 0.290 | 0.284 | 0.329 | 0.55 |
Note.
a Experimental diffusion coefficients and activation energy, which were reported in the form of an Arrhenius equation, were taken from the literature (Ryerson & McKeegan 1994). Errors on the diffusion prefactors and the activation energies of the Arrhenius fits were also taken into account to determine errors on diffusion timescales.Download table as: ASCIITypeset image
Ideally, a sublimation rate would have been measured for spinel under the kinds of conditions that we model here, and we could use that rate to estimate grain survival time. However, that parameter has not, to our knowledge, been measured for the kinds of conditions that Mg–Al (Ti, V) spinel might have experienced in the early solar protoplanetary disk (high temperatures, low pressures). Further, calculation of such kinetics for a full range of chemical reactions in the phase space of the solar nebula is a grand challenge well beyond the scope of the work presented here.
Having said the above, we note that vaporization of MgO from pure MgAl2O4-spinel was measured between 1973 K to 2273 K at 1.3 × 10⁻⁶ atm (Sata & Yokoyama 1973). These temperatures and pressures are respectively hundreds of kelvin above and three to four orders of magnitude below what we have modeled here. Nonetheless, to get some sense of how these sublimation experiments might translate to the conditions we thermodynamically modeled, we used the data in Sata & Yokoyama (1973) to estimate the activation energy (Ea ). Using an Arrhenius plot, we can calculate Ea :

and

and

and

where D is the diffusion coefficient (m2 s−1), D0 is the collision-frequency factor (m2 s−1), Ea is the activation energy (kJ mol−1), R is the ideal gas constant, and T is temperature. The Ea can be calculated from Equation (5) once the slope (m) is determined.
Figure 18 shows the data in Table 1 of Sata & Yokoyama (1973) in Arrhenius-plot form for three different spinels: "0.9-spinel," "2.8-spinel," and "polycrystalline spinel." The 0.9-spinel and 2.8-spinel were both examined experimentally in Sata & Yokoyama (1973), and the numbers in the sample name refer to the molar ratios of MgO to Al2O3. The polycrystalline spinel is reported in the same Table 1 for comparison but is referenced to Lukin & Poluboyarinov (1964). We determine from the plot activation energies of 217 kJ mol−1, 333 kJ mol−1, and 532 kJ mol−1, respectively, for the polycrystalline spinel, 2.8-spinel, and the 0.9-spinel using Equation (5)—see Table 3. We note further that "apparent activation energies" of 326 and 586 kJ mol−1 are reported for the 2.8-spinel during the "initial" and "later" stages of the experiment (their Table 2). Sata & Yokoyama (1973) note that the change in EA is due to the nature of the sublimation, i.e., that the later-stage vaporization leads to the formation of a corundum (Al2O3) layer at the surface due to the preferential evaporation of a MgO component. Thus, later-stage evaporation is controlled by O2− diffusion through a corundum layer, supporting our hypothesis of O self-diffusion as the critical parameter to spinel survival under such high-temperature, low-pressure conditions.

Figure 18. Arrhenius plot of data presented in Sata & Yokoyama (1973). Linear fits to the data are shown together with their respective correlation coefficients from the three different spinels discussed above.
Download figure:
Standard image High-resolution image
Table 3. Activation Energies Calculated from Figure 18
| Spinel Type | −m | R (J/K*mol) | Ea (J mol−1) | Ea (kJ mol−1) |
|---|---|---|---|---|
| Poly 1.0 spinel | 26045 | 8.314 | 216538 | 217 |
| 0.9-spinel | 64019 | 8.314 | 532254 | 532 |
| 2.8-spinel | 40047 | 8.314 | 332951 | 333 |
Download table as: ASCIITypeset image
We therefore used these activation energies to recalculate the timescale of O2− diffusion and hence, grain survival using Equation (1). Assuming the same 1 μm-sized grain, we find that the diffusion time can range from fractions of a second to more than 63,000 yr at temperatures between 1500 and 1600 K, depending on the activation energy (Table 4). At the lower activation energy of 216 kJ mol−1, diffusion time is rapid, lasting only fractions of a second, which would argue against grain survival. On the opposite extreme, Ea = 532 kJ mol−1 yields a diffusion time between ∼4000 yr to over 63,000 yr at temperatures ranging from 1600 K to 1500 K, respectively. An activation energy of 333 kJ mol−1 yields diffusion times in between with values reaching fractions of a second between 1500 and 1600 K.
Table 4. Diffusion Times for a 1 μm-sized Spinel Grain Using the Einstein–Smoluchowski Equation of Diffusion but with Activation Energies Calculated in Table 3
| T (K) | D (m2 s−1) | Time of Diffusion in Years (f = 0.781) | ||||
|---|---|---|---|---|---|---|
| EA = 216 kJ mol−1 | EA = 333 kJ mol−1 | EA = 532 kJ mol−1 | EA = 216 kJ mol−1 | EA = 333 kJ mol−1 | EA = 532 kJ mol−1 | |
| 1500 | 6.35E-15 | 5.57E-19 | 6.54E-26 | 6.50E-07 | 7.41E-03 | 6.31E+04 |
| 1550 | 1.11E-14 | 1.32E-18 | 2.59E-25 | 3.71E-07 | 3.13E-03 | 1.59E+04 |
| 1600 | 1.88E-14 | 2.96E-18 | 9.41E-25 | 2.20E-07 | 1.40E-03 | 4.38E+03 |
Download table as: ASCIITypeset image
Taking this line of reasoning one step further, we can calculate the grain survival time using the activation energies for corundum assuming different size grains. Oishi & Kingery (1960) reported the self-diffusion coefficient of O in single-crystal corundum at temperatures up to 1780 °C. Using their values for D0 (1.9 × 10⁻¹ m2 s−1) and Ea (636 kJ mol−1) and inserting them into Equation (5), we obtain diffusion timescales from ∼12 to 300 yr and ∼0.1 to 3 yr for 1 μm- and 100 nm-sized particles, respectively (Tables 5 and 6). In other words, the diffusion timescale for O in corundum for a 1 μm-sized grain exceeds the particle-transport time, whereas the diffusion timescale for a 100 nm-sized grain is comparable to the particle-transport time.
Table 5. Diffusion Times for a 1 μm-sized Corundum Grain Using the Einstein–Smoluchowski Equation of Diffusion
| T (K) | D (m2 s−1) | Time of Diffusion (yr) | Particle-transport Time (yr) |
|---|---|---|---|
| 1500 | 1.35E-23 | 305.7 | 5 |
| 1550 | 7.00E-23 | 59.0 | 3 |
| 1600 | 3.27E-22 | 12.6 | 0.55 |
Note. The correlation factor (f ) is set to 0.781.
Download table as: ASCIITypeset image
Table 6. Diffusion Times for a 100 nm-sized Corundum Grain Using the Einstein–Smoluchowski Equation of Diffusion
| T (K) | D (m2 s−1) | Time of Diffusion (yr) | Particle-transport Time (yr) |
|---|---|---|---|
| 1500 | 1.35E-23 | 3.06 | 5 |
| 1550 | 7.00E-23 | 0.59 | 3 |
| 1600 | 3.27E-22 | 0.13 | 0.55 |
Note. The correlation factor (f ) is set to 0.781.
Download table as: ASCIITypeset image
Our purpose here is not to use these data to say unequivocally whether the grain survived (we know that it did because it is preserved in the sample) but rather to use them as a guide to whether grain survival is possible over the dynamical timescales. The experiments and our calculations support such a possibility. In other words, the use of the O self-diffusion coefficient is a reasonable materials-specific estimate of grain survival. We also note that the modeled spinel is not sublimating into a vacuum but rather is theoretically surrounded by a gas where material can deposit on the solid surface. Having said the above, we also note that so long as the spinel grain enters and experiences the perovskite stability field, then that is all it needs for perovskite to condense on it. Also, we further emphasize that the spinel may not have been 1 μm originally. It could have been larger and what we see now is the spinel grain that is preserved after sublimation.
Appendix C: Particle Tracking in a Dynamic Protoplanetary Disk
Here we adopt the classic α-viscosity formalism for tracking the dynamic and thermal evolution of the solar nebula (Shakura & Sunyaev 1973; Hartmann et al. 1998). The code is the same that was used in modeling the evolution of the solar nebula as in Ciesla (2010a, 2010b). For the case considered here, we set α = 10−3 and begin with a disk that has a surface density given by Σ(r) = 12,000(r/1 au)−1 g cm−2 from 0.1 to 10 au. The midplane temperatures are calculated assuming that the opacity of the disk everywhere was 1 g cm−2. While the opacity is likely to vary with location in the disk, the actual value is set by the composition and sizes of solids present in the disk and will evolve over time as solids are processed grow. For simplicity, we adopt a constant, typical value for protoplanetary disks.
In calculating the dynamical evolution of the dust grains, we use the two-dimensional (radial and vertical) particle-tracking methods as described in Ciesla (2010a, 2010b, 2011). Particles are then released within the disk at a prescribed starting location, with the grains then moving as determined by the local radial drift velocity, advective flow of the gas, vertical settling, and random displacements associated with turbulence. At every time step, taken to be 10% of the local orbital timescale, the location of the particle is updated; the local pressure and temperature recorded every 10th time step (approximately every 1/6 of the local and orbital period). Thus, the time between each point in Figure 5 is approximately one orbital period. A similar methodology was used in Ciesla (2015) in tracking the reaction of S with Fe grains.
As perovskite was predicted to condense at T ∼ 1440 K at a pressure of 10−4 bar in this work, we release the 1 μm particles in our study at the disk midplane and at a distance of 1.5 au from the Sun. Particles were then followed for a period of 105 yr, and those that remained in the disk after this period of time were considered "survivors" that would be available for incorporation into planetesimals as they form over the rest of nebular history.