


Abstract
There has always been interest in the perceived colors of stars. They were key to the development of the Hertzsprung–Russell diagram, and they are also used widely in educational and public-outreach imagery. Thus, it is useful to develop tools to compute these colors from spectral energy distributions. This paper presents a collection of objective (CIE coordinate) and subjective (RGB triple) colors for main-sequence stars and brown dwarfs, as well as links to related codes and tables. Using the proposed conversion from CIE to RGB colors, O and B stars are bluer than equivalent blackbodies because of Paschen continuum absorption, and M dwarfs tend to be less red and more beige. Although brown dwarfs over a wide range of effective temperatures (400–2000 K) emit most of their flux in the infrared, their visible spectra are dominated by short wavelengths. Thus, they may appear violet to human eyes.
Export citation and abstract BibTeX RIS

Original content from this work may be used under the terms of the Creative Commons Attribution 4.0 licence. Any further distribution of this work must maintain attribution to the author(s) and the title of the work, journal citation and DOI.
Star colors, as perceived by eye, have been studied in both historical and scientific contexts (Murdin 1981; Malin 2002; Hughes 2004; Lynch & Mazuk 2005; Harre & Heller 2021). Although the associated colors of thermal blackbody spectra are useful in the interpretation of stellar appearances, they do not tell the entire story. In addition, once one crosses the substellar barrier to brown dwarfs and gas-giant planets, blackbody colors are even less relevant. This research note describes an attempt to calculate perceived colors corresponding to theoretical and observed spectral energy distributions (SEDs) of main-sequence stars and brown dwarfs.
The basic physiological response of the human eye can be modeled with color-matching functions defined by the Commission Internationale De L'Eclairage (CIE; see, e.g., Schanda 2007; Hunt & Pointer 2011; Fairchild 2013). Despite the existence of recent revisions, we use the more well-known 1931 color-space definitions—as updated and tabulated by Vos (1978)—to compute (x, y, z) tristimulus values corresponding to various spectra. Figure 1(a) shows these curves with an example brown-dwarf spectrum from Marley et al. (2021).
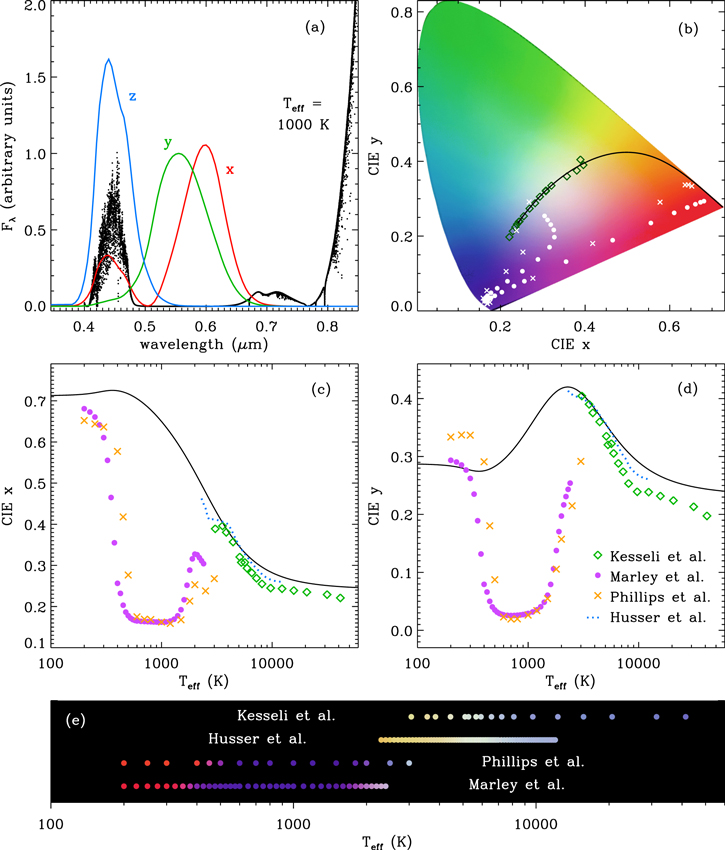
Figure 1. (a) CIE color-matching functions compared to an example brown-dwarf spectrum. (b) CIE color-space chromaticity diagram with blackbody colors (black curve) and computed star/brown-dwarf colors (symbols). Also shown are how the x (c), y (d), and estimated RGB colors (e) vary with Teff.
Download figure:
Standard image High-resolution image
CIE tristimulus values can be converted into red–green–blue (RGB) colors for the purposes of screen display or printing, but this process is highly subjective. Rather than wade into the morass of standard illuminants and gamma corrections, we decided to try an empirical approach: i.e., online images/scans of the CIE chromaticity diagram were obtained from six independent sources, normalized to the same image size, and averaged together on a pixel-by-pixel basis (see, e.g., Surowiecki 2004). Corresponding RGB triples were then found by interpolation for a given CIE (x, y) pair, and Figure 1(b) shows the result.
SED data were obtained from four sources: (1) observed spectral templates for main-sequence stars (Kesseli et al. 2017) with effective temperatures Teff estimated from Pecaut & Mamajek (2013),
1
(2) PHOENIX model atmospheres (Husser et al. 2013) with solar metallicities and  values that come closest to the Pecaut & Mamajek (2013) values, (3) chemical equilibrium brown dwarf models (Phillips et al. 2020), and (4) cloudless brown dwarf models (Marley et al. 2021). For the latter two, we used models with
  and solar metallicities. Figures 1(c)–(d) show how the CIE (x,y) values vary with Teff, alongside corresponding values for Planck-function blackbodies at the same temperatures (black curves). Figure 1(e) shows interpolated RGB colors.
Stars with Teff > 10,000 K appear blue, but the hottest stars are slightly bluer than even the Teff → ∞ end of the Planck blackbody locus. For these O and B type stars, the shortest visible wavelengths (redward of the Balmer jump) undergo the least absorption, while the rest of the visible spectrum experiences more absorption in the Paschen continuum. Thus, the ratio of emergent flux at 0.4 μm to that at 0.6 μm can be ∼30% higher than from a blackbody. Solar-type stars (i.e., 5000–7000 K) appear off-white, and K/M dwarfs appear slightly beige rather than distinctly orange or red. Note that we do not take account of absorption by the Earth's atmosphere, which produces non-negligible reddening even for zenith lines of sight (Lynch & Mazuk 2005).
For late-type M dwarfs and the hottest L dwarfs (i.e., 2000–3000 K), there is a clear discrepancy between the stellar SEDs and the brown-dwarf model grids. For wavelengths longer than ∼0.5 μm (including all of the infrared), all four sets of spectra agree with one another reasonably well. However, the models of Phillips et al. (2020) and Marley et al. (2021) tend to show excess emission at 0.4–0.5 μm. These differences likely arise because of different treatments of alkali-metal (e.g., Na, K) absorption and molecular condensation in the model atmospheres. Burrows et al. (2001) realized that the Na I D line wings can be strong enough to absorb much of the middle part of a brown dwarf's visible spectrum, leaving only some combination of red and blue/violet which produces a magenta or purple appearance (see also Trimble & Aschwanden 2001). For Teff values between about 400 and 2000 K, the spectra used in this paper exhibit clear flux maxima near the local minimum in the Na I cross section at 0.4–0.5 μm (see Figure 22 of Burrows et al. 2001). This contributes to the dominance of purple or violet in the computed colors. For the coolest objects (Teff < 400 K) nearly all of the sodium atoms become bound in molecules and the visible spectrum begins to resemble the red end of the Planck blackbody locus.
We note that neither of the brown dwarf models utilized here includes a full treatment of clouds or aerosols. At the L/T spectral-type transition, clouds produce a shift from redder infrared colors (for Teff > 1000 K) to a "bluer" infrared (for Teff < 1000 K) because cooler atmospheres start to undergo cloud condensation below the photosphere (Allard et al. 1996; Marley 2000; Kirkpatrick 2005). The lower optical depth at short wavelengths opens a window to deeper and brighter layers, and it is unclear how this may affect the optical part of the spectrum. Gao et al. (2021) computed RGB color visualizations of irradiated exoplanet atmospheres that contain additional photochemistry, and it would also be interesting to include the effects of surface inhomogeneities such as starspots and zonal bands.
Additional data from this paper—including tabulated information for Figure 1 and example IDL code for computing CIE and RGB values from an object's flux spectrum—have been published to a third-party repository (Cranmer 2021). However, the algorithm described above for computing RGB triples ought to be considered as a preliminary first step; i.e., it needs to be tested by comparing the results to other proposed ways of converting astronomical spectra to perceived colors (e.g., Kohman 2005; Savino & Comins 2015; Cardiel et al. 2021; Harre & Heller 2021).
The author gratefully acknowledges Mark Marley for helpful discussions.
Footnotes
- 1
Version 2021.03.02. https://www.pas.rochester.edu/~emamajek/EEM_dwarf_UBVIJHK_colors_Teff.txt.