


Export citation and abstract BibTeX RIS
1. Background
When analyzing data cubes produced by radio telescopes or integral field units, astronomers frequently aim to produce a map of velocity as a function of pixel coordinate or time. In some cases, the spectral dimension is dominated by a single line and the operation of inferring a velocity is simplified to a question of determining the centroid of the line. For this problem, there exist multiple popular methods (see, for example de Blok et al. 2008), however the most common are the "intensity weighted average velocity" (also known as the "first moment" method) and the velocity of the maximum intensity, called the "ninth moment,"3 as they are implemented by CASA (McMullin et al. 2007). Even when the emission is dominated by a single line component, these methods do not offer the accuracy or precision required to extend studies to small scale structures.
The "first moment" approach is strongly affected by the noise in the spectrum and any asymmetry in the line profile. Sigma clipping is typically used to circumvent these issues, however this can result in the addition of spurious features or the masking of astrophysically interesting features in the resulting velocity map. "Ninth moment" maps are more robust to these issues, however the precision of this approach is limited by the velocity resolution of the data.
Other approaches involve fitting a model line profile (e.g. a Gaussian) to the data, but these methods are both more computationally expensive and more sensitive to the details of the line shape. In the case of a double-Gaussian profile, due to radial infall, for example, the line center for a single Gaussian component (or a higher order expansion) will therefore be offset to account for this double component.
In this note we present a new method for inferring line centroids that is simple, computationally efficient, and robust to noise and errors in line shape.
2. Technical Details
It has been demonstrated that the centroid of photometric sources can be determined with near-optimal precision by fitting a quadratic surface to the brightest central pixels of the point-spread function (Vakili & Hogg 2016). Here we apply this method in one dimension to estimate the centroid of spectral lines. The fundamental idea is that we can fit a quadratic model to the brightest pixel and one pixel on either side to estimate the curvature of the line profile near maximum.
The procedure is as follows:
- 1.We find the pixel of maximum intensity in the spectrum and extract that pixel value I0 and the one to the left I− and right I+.
- 2.We model these three intensities as a quadratic functionwhere x0 is the pixel coordinate of maximum intensity and x is in units of pixels. Given the intensities in the three target pixels, we find


- 3.The maximum of Equation (1) is at
 and this is our estimate for the centroid of the line in pixel coordinates.
We can also estimate the statistical uncertainty on xmax by linearizing and propagating the uncertainty from the fluxes to the centroid estimate. If we assume that the intensity uncertainties are normal, independent, and homoskedastic with standard deviation σ, we find the following approximation for the statistical uncertainty on xmax

We emphasize that this only includes the statistical uncertainty and any application of this method to real data will also require a treatment of systematic uncertainties.4
3. Demonstration of Method
The top row of Figure 1 compares different methods for estimating a line centroid the case of an asymmetric line profile, modeled as the sum of two Gaussian components. Both the first moment and Gaussian fit results are biased by the asymmetry of the line. Although the "ninth moment" approach avoids this bias, its precision is limited by the velocity resolution of the data.

Figure 1. Top row: comparisons of different line centroid methods applied to simulated data. Left: a Gaussian fit to the data is shown in green and the quadratic fit to the peak pixels is in blue. Vertical ticks show the velocity inferred using the other approaches with the same colors as in the right panel. Right: the difference between the inferred centroid and the truth for the methods listed along the x-axis. The error bars indicate the statistical uncertainty of each method. Bottom row: application of the three methods to observations of HD 135344B.
Download figure:
Standard image High-resolution image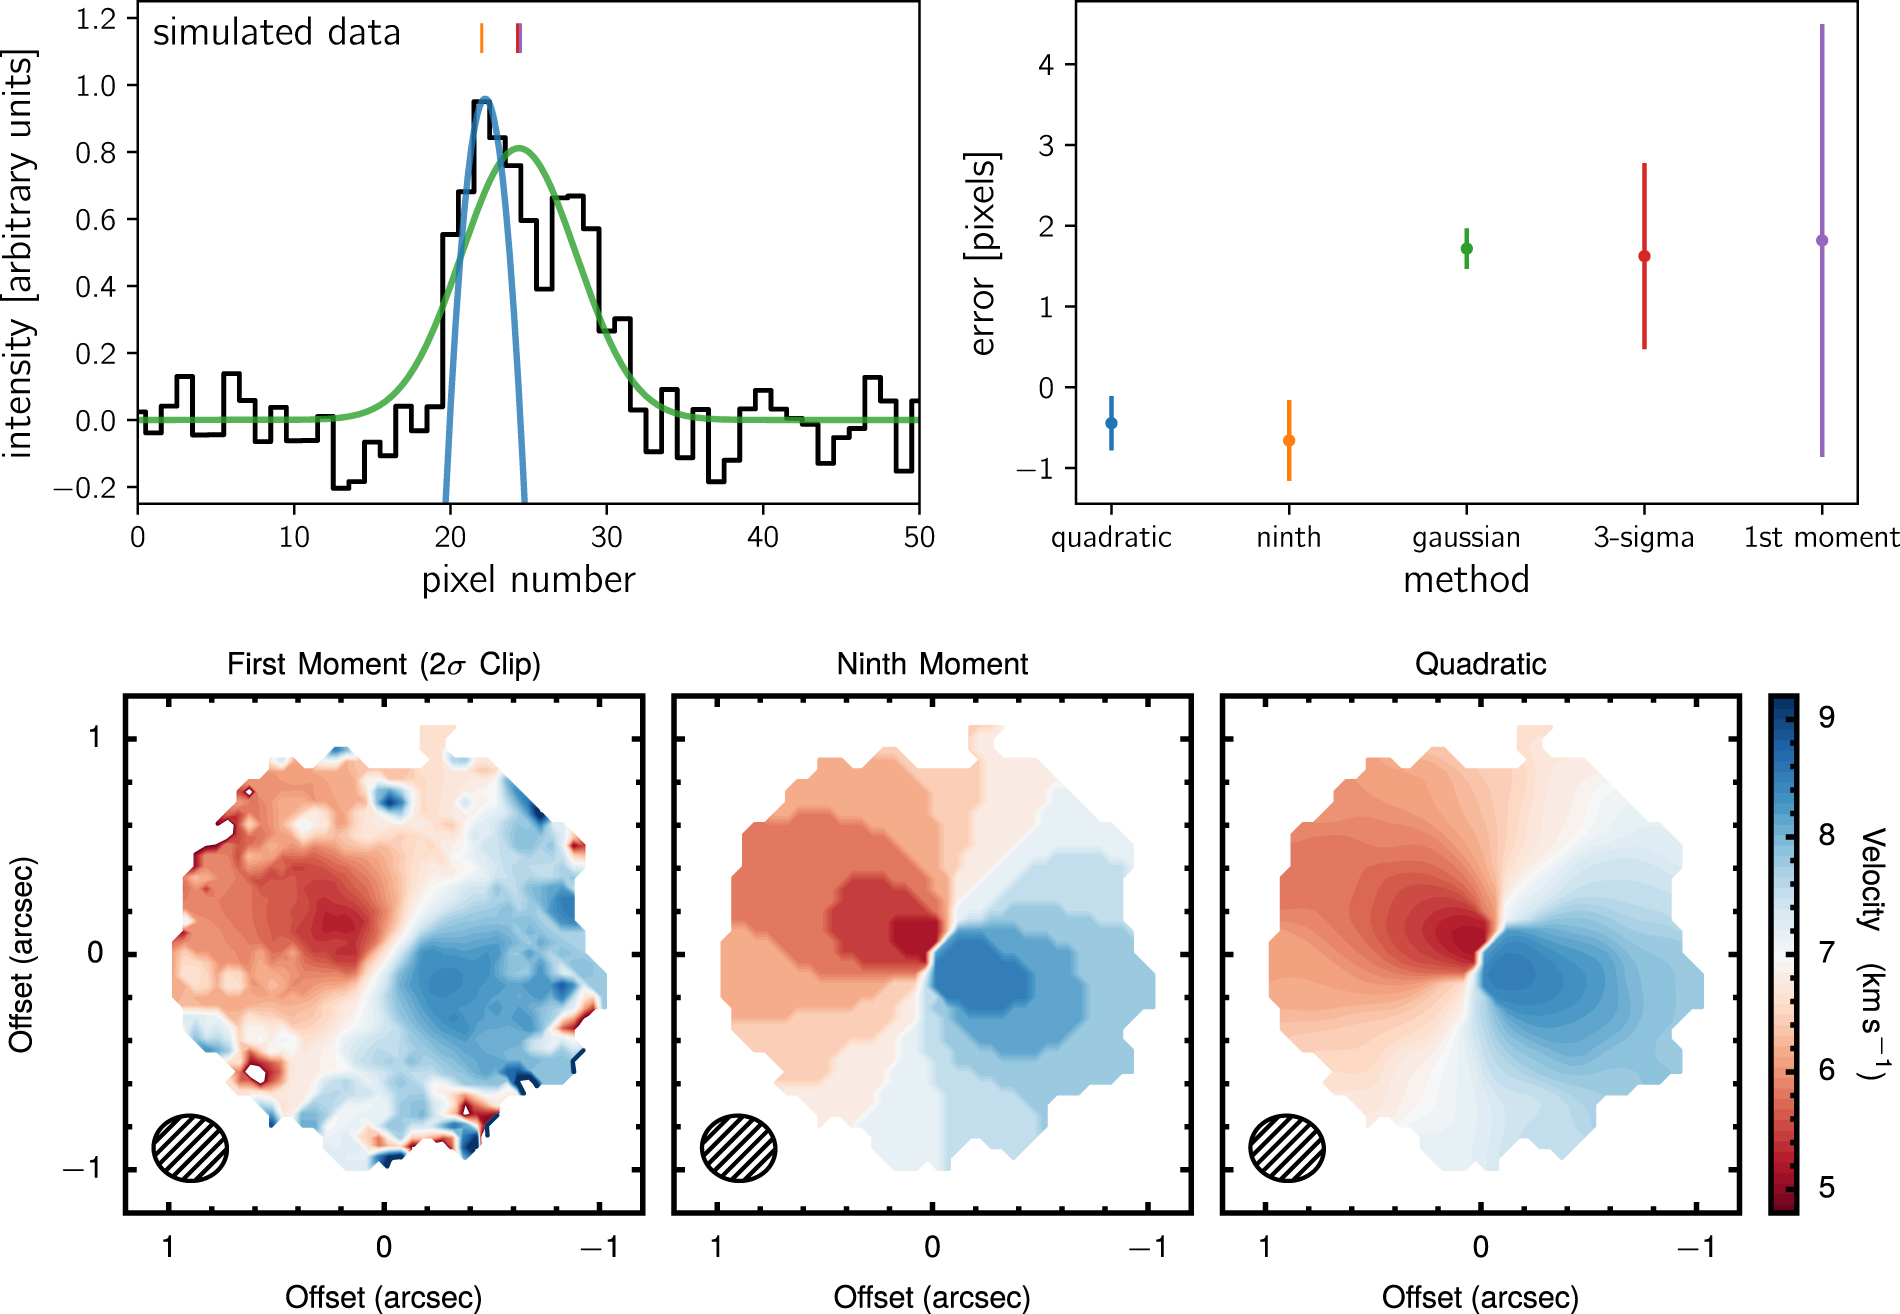
The bottom row shows velocity maps of 13CO from the protoplanetary disk, HD 135344B (van der Marel et al. 2016, ALMA Project 2012.1.00158.S), imaged at a velocity resolution of 330 m s−1. With a 2σ clip applied to the data, a "first moment" approach results in a noisy map, making it hard to distinguish real structures from noise. As with the asymmetric spectrum, the "ninth moment" is less affected by the noise but the resulting map loses fidelity due to the coarse velocity resolution of the data. The quadratic approach does not suffer from noise features while maintaining a high precision on the inferred velocity and achieving a statistical uncertainty of 47 m s−1, or 15% of the velocity resolution.
The code used to generate this figure and an open source implementation of this method is available at https://github.com/richteague/bettermoments. Version v1.0 used in this note is available at https://doi.org/10.5281/zenodo.1419754.
Software: bettermoments (Teague & Foreman-Mackey 2018).
Footnotes
- 3
We emphasize that this is a misnomer as it does not relate to any statistical moment.
- 4
The code released alongside this note includes an implementation and proof of more general noise models at https://github.com/richteague/bettermoments.