


 t 19c, 4000 Liège, Belgium
Abstract
T-type brown dwarfs present an opportunity to explore atmospheres teeming with molecules such as H2O, CH4, and NH3, which exhibit a wealth of absorption features in the mid-infrared. With JWST, we can finally explore this chemistry in detail, including for the coldest brown dwarfs that were not yet discovered in the Spitzer era. This allows precise derivations of the molecular abundances, which in turn inform our understanding of vertical transport in these atmospheres and can provide clues about the formation of cold brown dwarfs and exoplanets. This study presents the first JWST/MRS mid-IR spectrum (R ∼ 1500–3000) of a T dwarf: the T8.5+T9 brown dwarf binary WISE J045853.90+643451.9. We fit the spectrum using a parameterized P–T profile and free molecular abundances (i.e., a retrieval analysis), treating the binary as unresolved. We find a good fit with a cloud-free atmosphere and identify H2O, CH4, and NH3 features. Moreover, we make the first detections of HCN and C2H2 (at 13.4σ and 9.5σ respectively) in any brown dwarf atmosphere. The detection of HCN suggests intense vertical mixing (Kzz ∼ 1011 cm2 s−1), challenging previous literature derivations of Kzz values for T-type brown dwarfs. Even more surprising is the C2H2 detection, which cannot be explained with existing atmospheric models for isolated objects. This result challenges model assumptions about vertical mixing and/or our understanding of the C2H2 chemical network, or might hint towards more complex atmospheric processes such as magnetic fields driving aurorae or lightning driving ionization. These findings open a new frontier in studying carbon chemistry within brown dwarf atmospheres.

Original content from this work may be used under the terms of the Creative Commons Attribution 4.0 licence. Any further distribution of this work must maintain attribution to the author(s) and the title of the work, journal citation and DOI.
1. Introduction
Brown dwarfs provide a laboratory for studying the physics and chemistry of cold atmospheres. Their atmospheres are similar to those of low-irradiation exoplanets, though with some differences due to their higher mass and surface gravity. Further, their atmospheres are relatively accessible with spectroscopic characterization, without some of the observational complications that arise for exoplanets (which are typically overwhelmed by the light of a much brighter host star). Brown dwarfs and exoplanets are both spectrally classified as late-M, L, T, and Y-type objects (M. C. Cushing et al. 2006, 2011). As they cool, more molecules are able to form in their atmospheres, leading to increasingly complex atmospheric chemistry and corresponding emission spectra, though at the very lowest temperatures chemistry is kinetically inhibited.
T-type objects have strong water and ammonia absorption features in the mid-IR (G. Suárez & S. Metchev 2022). In cool T dwarfs with high surface gravity, carbon is predicted to be primarily in the form of CH4, with the CO atmospheric content correlating with the vertical mixing strength (e.g., K. J. Zahnle & M. S. Marley 2014). Mid- to late-T type brown dwarfs should have relatively clear atmospheres, since they are cold enough that silicate clouds in the atmosphere have sunk deep into the atmosphere, but warm enough that water- and ammonia-ice clouds are not expected.
K. J. Zahnle & M. S. Marley (2014) predicted that HCN might be present for high-gravity brown dwarfs with very strong vertical mixing (parameterized through an eddy diffusion coefficient (Kzz, with very strong vertical mixing corresponding to Kzz ⪆ 1010 cm2 s−1). HCN is only produced through chemical reactions at higher temperatures and pressures, but can become "quenched" (i.e., the mixing timescale becomes shorter than the chemical reaction timescale, leading to a vertically constant abundance; R. G. Prinn & S. S. Barshay 1977) and reach observable abundances higher in the atmosphere. However, S. Mukherjee et al. (2024) demonstrated that vertical mixing is relatively weak in field brown dwarfs. They studied the spectra of a sample of nine early- to late-T dwarfs observed with Spitzer and AKARI, and derived typical vertical mixing values in the atmosphere of Kzz ∼ 101–104 cm2 s−1. A more recent study of a Y0 dwarf with JWST NIRSpec/PRISM and MIRI/LRS found a preference for models with (S. A. Beiler et al. 2023), but that work highlights that the strong vertical mixing is required to match the deep CO and NH3 features. This strong mixing is inconsistent with the PH3 nondetection in that object, possibly indicating the need for a more complex vertical mixing prescription (though see S. A. Beiler et al. 2024 for additional discussion of the PH3 nondetection).
![${\rm{log}}({K}_{{zz}}[{{\rm{cm}}}^{2}\,{{\rm{s}}}^{-1}])\geqslant 4$](https://content.cld.iop.org/journals/2041-8205/981/2/L31/revision1/apjladb4ecieqn1.gif)
C2H2 was not predicted in the atmospheres of nonirradiated brown dwarfs, but both HCN and C2H2 should be formed by photodissociation in irradiated objects (e.g., A. G. Sharp et al. 2004; J. I. Moses et al. 2011), and in these cases they are a tracer of a carbon-rich atmosphere (O. Venot et al. 2015). In the case that C2H2 is produced by photodissociation, it should appear primarily at very high altitudes/low pressures (e.g., O. Venot et al. 2015 predicted C2H2 abundance to exceed a molar fraction of 10−12 at above ∼10−3 bar, and peak at a molar fraction of ∼10−5–10−4 at ∼10−6 bar in a 500 K atmosphere with external radiation).
JWST provides the opportunity to characterize these T dwarfs to a level of detail not previously possible. The medium-resolution spectrograph (MRS; M. Wells et al. 2015; I. Argyriou et al. 2023) of the JWST/MIRI instrument (G. H. Rieke et al. 2015; G. S. Wright et al. 2015) provides high-sensitivity spectra at R ∼ 1500–3500 from 4.9 to 27.9 μm. For cold atmospheres, this unveils a rich forest of molecular absorption features. Throughout this work, we will refer to the 1–5 μm wavelength range as the near-IR and to λ > 5 μm as the mid-IR.
No MIRI/MRS spectra of T-type brown dwarfs have to date been published, though a few publications have studied L-type (B. E. Miles et al. 2023) and Y-type (D. Barrado et al. 2023; H. Kühnle et al. 2024) objects. In this work we present the first MIRI/MRS spectrum of a T dwarf: observations of the brown dwarf binary WISE J045853.90+643451.9 (hereafter WISE-0458), providing an opportunity to search for new chemistry and to constrain the atmospheric structure of a cold object. WISE-0458 was the first ultracool brown dwarf identified by the Wide-field Infrared Survey Explorer (WISE) mission (J. D. Kirkpatrick et al. 2011; A. Mainzer et al. 2011). It was originally classified as T9 or T8.5 by A. Mainzer et al. (2011) and M. C. Cushing et al. (2011) respectively, and has strong near-IR H2O and CH4 absorption bands, as well as tentative evidence for NH3 absorption in the near-IR (A. J. Burgasser et al. 2012). The system is at a distance of pc (S. K. Leggett et al. 2019), and has no identified markers of relative youth, suggesting it is a field-age object with high surface gravity.

WISE-0458 was soon resolved as a binary brown dwarf in Keck high-resolution images by C. R. Gelino et al. (2011), who found spectral types T8.5 and T9 and temperatures ∼600 K and ∼500 K respectively for the two components. The pair has a semimajor axis of au ( mas), and at the epoch of JWST observation were at a predicted mutual separation of 330 ± 40 mas, based on the orbit fit of S. K. Leggett et al. (2019). This corresponds to a separation of 1.3× the diffraction limit at 5 μm, and 0.45× the diffraction limit at 18 μm (D. R. Law et al. 2023), i.e., the pair is barely resolved at the shortest MRS wavelengths and unresolved at the longest. We therefore treat the pair as an unresolved binary throughout this work, and assume identical atmospheres for both objects; the similarity in spectral type and temperature between the two objects justifies this approach.


For any binary, in the extreme cases either (1) the flux of one object dominates, and models would constrain only the physical parameters of that object, or (2) the objects are identical, in which case models can also constrain all the physical parameters of both objects, but will return a radius inflated by (corresponding to twice the emitting area of one object). In the intermediate case (both objects contribute to the flux, but have different atmospheres) retrievals may be more degenerate and measured parameters can be biased. For WISE-0458, the pair of brown dwarfs have similar fluxes and temperatures: S. K. Leggett et al. (2019) find the pair to be ∼1 mag different in brightness in the near-IR and derive temperatures of ∼600 K and ∼500 K respectively for the two atmospheres. If we infer that both formed via a star formation pathway and at the same time and location, they should also have similar atmospheric compositions. For this work, we therefore approximate the spectrum as a single atmosphere and assume a common effective temperature and composition, though we intend to revisit this assumption in a future work. As the library of late-T and Y dwarfs with JWST spectra grows, it will be important to understand the biases that are introduced when modeling the atmospheres of a binary brown dwarf in this way—this is likely particularly important in temperature ranges where the atmosphere is changing rapidly (e.g., the L–T transition and the T–Y transition).

The paper is structured as follows: we first present the observations and data reduction in Sections 2 and 3 respectively. In Section 4 we qualitatively describe the mid-IR spectrum of WISE-0458, and in Section 5 describe our retrieval analysis to constrain its atmospheric structure and composition. In Section 6 we discuss the molecular content of the atmosphere, and in particular the detections of HCN and surprisingly of C2H2, and the implications of these detections. Finally, we present some more general discussion and concluding remarks in Sections 7 and 8 respectively.
2. Observations
We observed WISE-0458 with the JWST/MIRI instrument on 2022 November 21, using the MRS. Observations were collected as part of the European MIRI GTO consortium. NIRSpec observations of WISE-0458 were also collected by another GTO team and will be presented in a future paper (B. W. P. Lew et al. 2025, in preparation). To reduce overheads, both the MRS and NIRSpec observations were collected through the same program (PID 1189).
The MRS has four channels (1 through 4) that cover consecutive wavelength regions and are observed simultaneously; together these four channels span 4.9–27.9 μm. These channels can be observed with any one of three grating settings (referred to as short, medium, and long or as A, B, and C), each covering one-third of each channel, for a total of 12 subchannels with unique grating/channel combinations. For WISE-0458, we integrated for 2997 s with each grating setting. At the longest wavelengths the brown dwarf signal becomes overwhelmed by thermal and background noise, and in this work we only consider channels 1–3 (4.9–18.0 μm). Observations were performed in the FASTR1 readout mode and in a two-point point-source optimized dither pattern to provide better sampling of the point-spread function; this dither also has the advantage of providing a contemporaneous observation that can be used for background subtraction. For each of the three grating settings, we collected one integration per dither position with 180 groups per integration.
3. Data Reduction
Data reduction was performed using the public jwst pipeline21 (version 1.12.5; H. Bushouse et al. 2023) with the corresponding CRDS file version 11.17.10 and context files jwst_1183.pmap. The reduction consists of three distinct stages. The first stage of the pipeline calculates the rate of photoelectric charge accumulation from the ramp files. The second stage, after assigning a world coordinate system to the data, includes applying several calibrations such as correcting for the flat field, the characterized scattered light internal to the MIRI detectors, the fringes in the spectral direction, and the photometric flux calibration (for additional discussion of the flux calibration of MIRI/MRS, see D. R. Law et al. 2025). After this step, the background is removed by subtracting one dither from the other (i.e., a nod subtraction). The final stage uses the generated and corrected detector files to produce image cubes. The algorithm to project from the 2D to 3D cube in this case is the "drizzle" weighting algorithm (D. R. Law et al. 2023). Before generating the cubes, an outlier detection is performed to mask out cosmic rays and similar residual outliers.
From the cube, the one-dimensional spectrum is extracted by placing an aperture around the source. For WISE-0458, we center the aperture around the brightest point in the collapsed data cube for each channel, using the built-in ifu_autocen() function. We use a radius of twice the analytical FWHM around the source, which varies between ∼03 and ∼1" over the MIRI wavelength range; this ensures flux from both brown dwarfs (separation ∼330 mas) is captured within the aperture. The spectrum is extracted with the extract_1d() function built into the jwst pipeline.

3.1. Residual Background Effects
With the pipeline data reduction as described above, the backgrounds are imperfectly corrected, and large-scale systematics remain in the 3D cubes (see Appendix C for a demonstration, and I. Argyriou et al. 2023 for detailed discussion of the MIRI in-flight performance and systematics). We therefore developed a custom, data-driven postprocessing treatment to correct background systematics in the 3D cubes, which is described in detail in Appendix C.
4. The mid-IR Spectrum of WISE-0458
The full MIRI/MRS spectrum of WISE-0458 is shown in Figure 1, with the key molecular absorptions highlighted. H2O, CH4, and NH3 all have a forest of molecular lines in the mid-IR. In particular, H2O dominates the shape of the spectrum between 5 and 7 μm and a very clear NH3 feature is visible between 10 and 11 μm. CH4 and NH3 also contribute to the forest of molecular lines beyond ∼7 μm.

Figure 1. The MIRI/MRS spectrum of WISE-0458, and our best-fit model. Panel (a) shows the full spectrum, binned to 1/10th the original spectral resolution for visual clarity. Colors represent each individual subchannel of the MRS detector (labeled 1A–3C), and we also label the locations of prominent molecular absorption features in this brown dwarf atmosphere. Panels (b), (d), and (f) show the best-fit model (black) compared to the data for each channel (at R = 1000). Our model is a free retrieval using pRT (see Section 5), including a parameterized pressure–temperature profile and seven molecular species; five molecules are confidently detected (H2O, CH4, NH3, HCN, and C2H2). Panels (c), (e), and (g) show the residuals, taking the 10b factor (see Section 5) into account.
Download figure:
Standard image High-resolution imageAbsorption features from HCN and C2H2 are visible at 13.75 μm and 14 μm respectively (Figure 2; these detections are both confirmed with a retrieval analysis (Sections 6.1, 6.2). Neither species has previously been observed in a brown dwarf atmosphere. While there are several mid-IR brown dwarf spectra measured by Spitzer (G. Suárez & S. Metchev 2022), we here present the first T dwarf spectrum with JWST/MIRI/MRS, and therefore the first T dwarf spectrum with this resolution and signal-to-noise ratio in the mid-IR, meaning that we are more sensitive than any previous observations to HCN and C2H2. Among the heavily irradiated exoplanets, detections of both HCN and C2H2 have been claimed in the atmosphere of HD 209458b (G. A. Hawker et al. 2018; P. Giacobbe et al. 2021), though the detections of both species are disputed based on JWST data (Q. Xue et al. 2024) and on high-resolution data at ∼3 μm (D. Blain et al. 2024). Finally, we note that both species are commonly seen as emission features in disks of young stars and brown dwarfs with Spitzer (I. Pascucci et al. 2013) and more recently JWST (B. Tabone et al. 2023; A. M. Arabhavi et al. 2024; T. Henning et al. 2024).

Figure 2. Comparison of the data and best-fit models with and without including the molecules HCN and C2H2. Here we show our retrieved spectra for a "basic" model with only H2O, CH4, NH3, CO, and CO2 (brown), and a model that also includes HCN and C2H2 (green), alongside the data (black, including our retrieved uncertainty inflation). The lower panel shows the residuals (data – model) for both models, and shading in the background of both panels indicates regions of high opacity for HCN (pink) and C2H2 (blue). The plot shows only the 13.4–14.6 μm region of the spectrum, where HCN and C2H2 absorption features are significant (see also Figure 3), but these species have a small continuum effect across more of the mid-IR.
Download figure:
Standard image High-resolution image5. Retrieval Modeling Approach
We modeled the spectrum of WISE-0458 using a retrieval analysis. For simplicity, we assumed both brown dwarfs to have the same P–T structure and atmospheric composition; this is a valid approximation since the spectral types of the two components are very similar (T8.5+T9, S. K. Leggett et al. 2019). We used the petitRADTRANS22 retrieval package (hereafter pRT; P. Mollière et al. 2019; E. Nasedkin et al. 2024), which allows for emission spectra to be generated, and used a nested sampling technique (J. Skilling 2004) as implemented in pyMultiNest (F. Feroz & M. P. Hobson 2008; J. Buchner et al. 2014) to probe the parameter space and derive posterior distributions for atmospheric properties.
We binned the MRS data from a native resolution of between 1500 and 3500 to λ/Δλ = 1000 when running retrievals. This allows for an efficient opacity treatment with correlated-k opacities (rather than line-by-line opacities), where 1000 is pRT's finest wavelength spacing in correlated-k, and thereby minimizes computation time. We modeled the atmosphere with a free pressure–temperature (P–T) profile with 10 temperature nodes, spaced equidistantly between 10−6 and 103 bar in log-space. The temperature at each "node" is a free parameter, and the full P–T profile is calculated by quadratic interpolation between these nodes. This led to a "wiggly" P–T profile, with several kinks in the posterior distribution, so we therefore also regularized the profile following M. R. Line et al. (2015; see also D. Barrado et al. 2023). Briefly, this approach penalizes rough profiles (defined based on their ) and includes a free parameter γ that dictates the degree of smoothing. We also inflated the pipeline-derived observational uncertainties, and retrieved an inflation term following M. R. Line et al. (2015), namely, we calculate inflated uncertainties for each data point following the formula , where b is a free parameter in the retrieval and σred is the observational uncertainty on each data point, derived from the jwst pipeline and binned to R = 1000 assuming uncorrelated errors. This allows a converged fit even in the presence of underestimated uncertainties in the data and/or missing physics in the model. A more physically accurate model is then expected to have a lower b parameter and smaller inflated uncertainties; this approach also accounts for the underestimated uncertainties in the jwst pipeline (see below).


Our basic model for the retrieval includes CH4, CO2, CO, H2O, and NH3, the main species that are expected in cold atmospheres. We assumed all molecules to have vertically constant abundances that were retrieved freely, which is a common assumption for brown dwarf modeling and is likely accurate across the pressures we probe with MRS spectra. We did not include clouds in our model. Line-lists for these species are from HITEMP for CO, CO2 (L. S. Rothman et al. 2010), and CH4 (R. J. Hargreaves et al. 2020), and from ExoMOL for H2O (O. L. Polyansky et al. 2018) and NH3 (P. A. Coles et al. 2019). Alongside these five abundance parameters, our model has 11 temperature/pressure free parameters (10 nodes and the γ parameter used in the P–T profile regularization), two additional physical parameters ( and radius of the brown dwarf), and the b parameter to inflate uncertainties, for a total of 19 free parameters in the basic model. We also tested for the presence of other molecular species, in each case adding the molecule individually to the retrieval and repeating the analysis. Line-lists for additional species are from HITRAN2012 for H2S and C2H2 (L. S. Rothman et al. 2013), HITRAN2020 for 15NH3 and C2H6 (I. E. Gordon et al. 2022), ExoMol for C2H4 (B. P. Mant et al. 2018) and PH3 (C. Sousa-Silva et al. 2015), and G. J. Harris et al. (2006) for HCN.

6. Molecules in the WISE-0458 Atmosphere
We found a well-fitting model that includes H2O, CH4, NH3, HCN, and C2H2 with our retrieval approach. Neither CO nor CO2 is detected; the nondetection of CO2 is consistent with models while the nondetection of CO is expected only for relatively weak vertical mixing. This model is shown in Figure 1; no strong features remain unexplained with this model and there are no obvious wavelength-dependent systematics. There is some hint of CO2 in the models without HCN, but this disappears when HCN is included and we infer it is a false-positive detection. Aside from the sharp 14 μm detection feature, HCN has some nonnegligible opacity between ∼12 and 16 μm (Figure 3), and correspondingly slightly changes the broadband spectral shape throughout this region; in a model without HCN, the retrieved CO2 abundance is elevated to explain this broadband spectral shape. We also see some correlation between the retrieved HCN and C2H2 for the same reason: both have a similar impact on the broadband spectral shape between ∼12 and 16 μm, and in a model with only one of these species included, the abundance of that molecule is overestimated to better fit the broadband shape of the other molecule. A full table of posteriors and a corner plot of molecular abundances are included in Appendix A.

Figure 3. Opacities of molecules in our best-fit model, with abundances matching the best-fit value (for H2O, CH4, NH3, HCN, and C2H2) and 2σ upper limits (for CO and CO2) from our best-fit model. Opacities in the upper panel are at R = 100 and those in the lower panel are at R = 1000 (matching the resolution used in our pRT retrievals). In the lower panel we highlight the regions where HCN and C2H2 absorb most strongly in the near- and mid-IR. For the WISE-0458 abundances, both species are only detectable in the mid-IR around 14 μm in the WISE-0458 atmosphere. With sufficiently high abundances (higher than those observed here), both species might become detectable in the near-IR, at 3 and 1.5 μm.
Download figure:
Standard image High-resolution imageThe derived atmospheric C/O ratio for this retrieval is 0.35 ± 0.03 (driven mainly by the H2O and CH4 abundances), and the atmospheric metallicity is solar, i.e., a slightly supersolar metallicity and slightly subsolar C/O ratio. The derived effective temperature is K. For the retrieval without HCN and C2H2, we find consistent C/O values (0.33 ± 0.03) but a slightly higher metallicity and effective temperature ( solar; 580 ± 5 K). While these calculations formally include the CO and CO2 abundances returned by the retrieval, the abundance upper limits on both species are sufficiently constraining that they do not impact the derived C/O and metallicity.


In the following text we discuss in detail the newly detected molecules HCN and C2H2, and then briefly also mention several molecules that are not detected in the current spectrum.
6.1. Hydrogen Cyanide Detection
A clear hydrogen cyanide (HCN) absorption feature is visible at 14 μm (Figure 2), as well as a smaller feature at 14.3 μm; in both cases the data clearly match the absorption in the best-fit model from the retrieval. We find a Bayes factor of 37.0 between the model with and without HCN (including C2H2 in both cases), corresponding to an HCN detection significance of 13.4σ.
In a theoretical study, K. J. Zahnle & M. S. Marley (2014) predicted that HCN would only be present in the atmospheres of brown dwarfs with very strong vertical mixing and a high surface gravity (corresponding to a compressed scale height), using a one-dimensional chemical kinetics code coupled with a physically motivated P–T profile. Our observed HCN abundances are broadly consistent with the HCN abundances predicted by their model with the strongest vertical mixing. For a 600 K model atmosphere with and metallicity = 1× solar, K. J. Zahnle & M. S. Marley (2014) predict a quench-point HCN abundance (volume mixing ratio, hereafter VMR) of 7.8 × 10⁻⁷ for their most vigorously mixed model with Kzz = 1011 cm2 s−1; in our retrievals we observe a VMR of . For a more modest value of Kzz = 104 cm2 s−1, K. J. Zahnle & M. S. Marley (2014) predict an HCN VMR of 1.1 × 10⁻⁹, well below the abundance observed here. These models have predicted NH3 VMRs of 2.2 × 10⁻⁵ and 2.0 × 10⁻⁵; both values are ∼2σ below our retrieved the NH3 abundance (). The HCN/NH3 abundance ratio is less sensitive to the surface gravity than the HCN abundance, and as such could provide a better proxy for the vertical mixing in the atmosphere. For WISE-0458, both HCN and NH3 are slightly enhanced relative to the K. J. Zahnle & M. S. Marley (2014) predictions, consistent with the slightly higher surface gravity of WISE-0458 relative to their models; the HCN/NH3 abundance ratio is as expected for a high-gravity object with strong vertical mixing (Kzz = 1011 cm2 s−1). However, these results indicate much stronger vertical mixing than previously inferred for T and Y dwarfs (S. Mukherjee et al. 2024; S. A. Beiler et al. 2023; J. W. Xuan et al. 2024).


A strongly enhanced metallicity could also promote a higher HCN abundance in the brown dwarf atmospheres. K. J. Zahnle & M. S. Marley (2014) include model atmospheres with 3× solar metallicity, but do not simultaneously model a temperature of 600 K with an atmospheric metallicity of 3× solar. At 500 K, their model with 3× solar metallicity has ∼5× the HCN content of the model with 1× solar metallicity (values are 1.2 × 10⁻⁶ and 2.0 × 10⁻⁷ respectively). This suggests that even a significant enhancement in metallicity would be insufficient to reconcile our observed HCN abundance with that predicted for a Kzz = 104 cm2 s−1 atmosphere. Further, our derived atmospheric metallicity ( solar) is only minimally enhanced relative to solar and cannot solve the conflict between our high HCN abundance and the previously claimed weak vertical mixing. Similarly, high C/O could promote production of HCN, but the observed C/O ratio of WISE-0458 is not in this regime.

CH4 is favored over CO in cool T dwarfs with high surface gravity, regardless of the vertical mixing, though the CO abundance in the prescriptions with the highest vertical mixing is increased almost to the same abundances as CH4 (K. J. Zahnle & M. S. Marley 2014). In WISE-0458, we detect CH4 and not CO, which is more in line with a lower Kzz atmosphere than the HCN abundance suggests. Generating the high HCN abundances we observe without also generating detectable levels of CO is challenging for models. Upcoming analysis of NIRSpec data for this target (B. W. P. Lew et al. 2025, in preparation) will significantly improve the CO constraints for WISE-0458, which primarily absorbs shortwards of 5 μm (Figure 3), and may provide further clues about the atmospheric mixing in WISE-0458.
6.2. Acetylene Detection
Aectylene (C2H2) is readily visible in the WISE-0458 spectrum, most notably with a clear absorption feature at 13.7 μm (Figure 2). In our retrieval analysis for WISE-0458, the best-fit model with C2H2 is favored with a Bayes factor of 18.4 over the model without (including HCN in both cases), corresponding to a C2H2 detection significance of 9.5σ. As with HCN, the only clear absorption features appear around 13–14 μm, but there is also some impact on the continuum flux level at other wavelengths. C2H2 also has a prominent 7.7 μm feature, as seen in some protoplanetary disk spectra (e.g B. Tabone et al. 2023), but in the WISE-0458 spectrum this feature is overwhelmed by the strong H2O, CH4, and NH3 absorption.
C2H2 has not previously been seen in a brown dwarf atmosphere and is an unexpected discovery. At first glance, the presence of C2H2 is consistent with the detection of HCN: both species are indicators of disequilibrium chemistry and likely form together deeper in the brown dwarf atmosphere. However, several brown dwarf model atmospheres (M. S. Marley et al. 2021; S. Mukherjee et al. 2024) include C2H2 and suggest that the atmospheric abundance of C2H2 should be extremely low. Our observed abundance () of C2H2 in the WISE-0458 atmosphere cannot be explained within a "normal" disequilibrium chemistry model, which assumes that the species is in chemical equilibrium deep in the atmosphere and is quenched at higher altitudes due to vigorous vertical mixing.

C2H2 is observed in Jupiter (G. R. Gladstone 1999; T. Fouchet et al. 2000), where it is formed via photochemistry from CH4 (S.-M. Tsai et al. 2021), but there is no star to drive photochemistry in WISE-0458, and the brown dwarfs (with mutual separation au, S. K. Leggett et al. 2019) are not emitting UV flux sufficient to drive this photochemistry. Note also that photodissociation driven by an external source should lead to C2H2 high in the upper atmosphere (above 10−3 bar), while our MIRI observations are primarily sensitive between 0.1 and 10 bar.

We modeled the WISE-0458 atmospheric chemistry with VULCAN to further explore the conditions under which C2H2 should be expected in a nonirradiated atmosphere with no thermal inversion. VULCAN is a chemical kinetics code that computes atmospheric composition considering mixing thermochemistry and optionally photochemistry, which has been validated against measurements of Jupiter as well as several exoplanets (S.-M. Tsai et al. 2017, 2021). The code assumes a one-dimensional model atmosphere, >300 chemical reactions (here we use the N–C–H–O chemical network), and uses eddy diffusion to mimic atmospheric dynamics. For this experiment, we used a P–T profile from E. F. Linder et al. (2019) with Teff = 500 K and . For our simple toy model we first assumed solar abundances, a vertically constant mixing profile with Kzz = 1011 cm2 s−1, and no photochemistry. In this model, the expected C2H2 volume mixing ratio is ∼10−14—orders of magnitude below our measured value (Figure 4, left). We then tested how varying the vertical mixing (Kzz), the metallicity, or the C/O (via adding carbon atoms, that is, not conserving solar metallicity) impacts predicted C2H2 values. While increasing any of these parameters does promote C2H2 production, unphysically high values are required to reach close to the observed value of C2H2 (Figure 4, right).

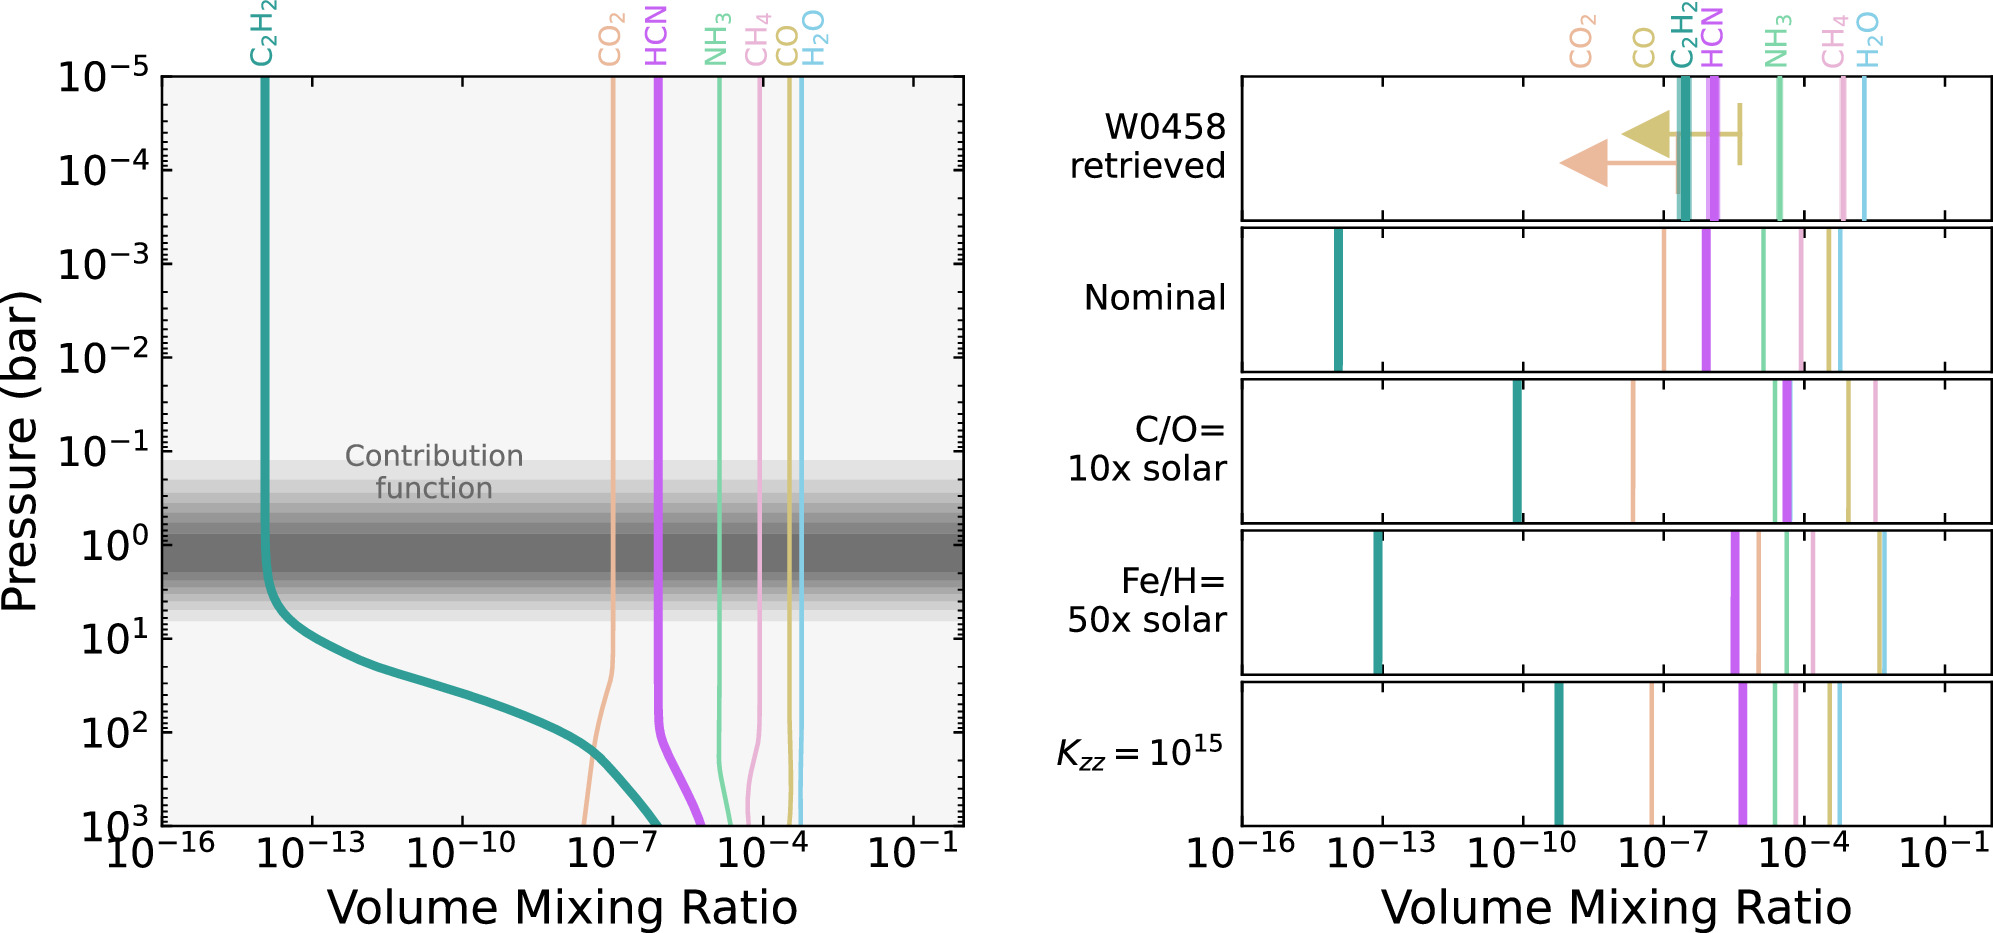
Figure 4. Predictions of atmospheric abundance for varying assumptions about the chemistry and vertical mixing, compared with our retrieved abundances in the WISE-0458 atmosphere. Left: atmospheric profiles for a nominal model (Kzz = 1011 cm2 s−1, C/O = 1 × solar, Fe/H = 1 × solar). With strong vertical mixing, we probe only the quenched abundances of these species; HCN is underpredicted and C2H2 is drastically underpredicted in these models relative to our observations. Right: quenched atmospheric abundances, for the nominal model and three models with increased Kzz, C/O, and Fe/H, alongside the retrieval abundances. Even unphysical values for the vertical mixing, C/O or metallicity are insufficient to boost C2H2 to the observed levels; raising the C2H2 abundance by increasing C/O or Fe/H also increases CO abundance to well above our upper limit. All models are produced with VULCAN (S.-M. Tsai et al. 2017, 2021).
Download figure:
Standard image High-resolution imagePerhaps, then, there is another unidentified process in the atmosphere. One possibility is that gravity waves are dissipating significant heat in the upper atmosphere, as modeled by C. Watkins & J. Y. K. Cho (2010). Alternatively, perhaps one or both brown dwarfs are magnetically active, driving aurorae and in turn generating UV photons and/or heating the upper atmosphere and driving a temperature inversion. For the brown dwarf WISE J193518.59-154620.3 (F. Marocco et al. 2019), an auroral process was inferred based on the observation of methane emission features as observed in JWST/NIRSpec G395H spectra (J. K. Faherty et al. 2024). However, NIRSpec data for WISE-0458 do not show the 3.325 μm emission feature that was used by J. K. Faherty et al. (2024) to identify aurorae. Galactic cosmic rays have also been theorized to be able to generate C2H2 in the upper atmosphere (P. B. Rimmer et al. 2014), though this would likely only produce smaller quantities of C2H2 than observed and at higher altitudes than our contribution function indicates. Another possibility is a more exotic scenario, such as a tidally heated exoplanet or exomoon (similar to Io in orbit around Jupiter) providing additional heat to the upper atmosphere. While occurrence rates of small bodies orbiting brown dwarfs are not known, in this case we would expect significant stochasticity in the occurrence and abundance of C2H2, based on the presence and exact properties of orbiting small bodies in different systems. Finally, substantial lightning discharges might ionize species in the atmosphere and drive the observed chemistry—a process that has previously been theorized to generate HCN in brown dwarf atmospheres (C. Helling & P. B. Rimmer 2019).
Even additional energy sources would only be expected to produce C2H2 in a carbon-rich (C/O > 1) environment, and not the carbon-poor atmosphere observed here. The detection of C2H2 remains a challenge for atmospheric models, suggesting a shortcoming in our understanding of vertical transport and disequilibrium processes, in our understanding of the energy sources of this atmosphere, or in our understanding of C2H2 chemistry (e.g., V. Saheb et al. 2018).
6.3. Other Hydrocarbons
Motivated by the detection of C2H2, we also searched for other hydrocarbon species in the WISE-0458 spectrum, namely C2H4 and C2H6. Our choice of test hydrocarbons is motivated by the detailed chemical study of O. Venot et al. (2015), which modeled irradiated atmospheres with and without photodissociation. Without photodissociation, and for a cool (500 K) atmosphere, they predict low volume mixing ratios (<10−7) for all carbon species except CO, CO2, CH4, and CH3. With photodissociation, HCN, C2H2, C6H8, C2H4, and C2H6 are predicted to have maximum mixing ratios >10−7 and may become relevant for the atmosphere. In each case, the abundance is somewhat higher when C/O is greater than unity. Of course, the thermal profile of these irradiated atmospheres is somewhat different than the expected thermal profile of WISE-0458, but in the absence of more suitable models that explain the surprising detection of C2H2, this work provides the least worst predictions of relevant hydrocarbon species. We therefore searched for C2H4 and C2H6. There is no evidence for C2H6, for which we place an upper limit of 2.34 × 10⁻⁵ (at 3σ). Our model shows tentative evidence for C2H4 (Bayes factor 1.8, corresponding to a 3.3σ detection) at a volume mixing ratio of . However, the posterior distribution includes model atmospheres with no C2H4, and when visually examining the best-fit spectra with and without C2H4 we do not see any clear absorption features attributed to it, but only subtle changes to the absorption features for other molecules. Without further analysis, it is premature to claim a C2H4 detection in WISE-0458, especially before the uncertainties and correlations in the MIRI/MRS data are well understood. We did not search for C6H8, which is a remarkably complex molecule to form without an external irradiation source (see O. Venot et al. 2015).

6.4. Nondetections of 15NH3, PH3, and H2S
We tested for 15NH3 in the WISE-0458 atmosphere. 15NH3 abundance ratios may indicate the formation pathways of brown dwarfs and exoplanets (H. Nomura et al. 2022; D. Barrado et al. 2023), and 15NH3 has been detected in other cold brown dwarfs. Our retrievals indicate a 3σ upper limit of 15NH3 < 2.8 × 10⁻⁶ and a ratio 14N/15N > 115. This is consistent with the 14N/15N ratio in cold atmospheres where 15NH3 has been measured: WISE J1828 (∼380 K) and WISE J0855 (∼285 K) have 14NH3/15NH3 ratios of 670 and 349 respectively (D. Barrado et al. 2023; H. Kühnle et al. 2024); Jupiter has 14NH3/15NH3 = 435 ± 50 (T. Owen et al. 2001) and for the interstellar medium (ISM) 14N/15N = 274 ± 18 (A. M. Ritchey et al. 2015). The WISE-0458 lower limit is consistent with all of these values, meaning that our upper limit on 15NH3 abundance does not have the power to differentiate between formation models.


The detection of the isotopologue 15NH3 is strongly temperature-dependent, as has also been theoretically demonstrated for isotopologues of C- and H-containing molecules (P. Mollière & I. A. G. Snellen 2019). While the absolute flux of warm atmospheres is higher, the absorption features of the main isotopologue species are dominant and blanket any features from other isotopologues. At lower temperatures, this blanketing effect is reduced and absorption features of the minor isotopologue can also be observed. We demonstrate this for NH3 in Appendix B. 15NH3 will likely only be detectable in planets and brown dwarfs colder than ∼500 K, though a precise analysis of the trade-off between source flux, 14NH3 abundance, and 15NH3 detectability is beyond the scope of this work.
We tested for PH3 in the WISE-0458 atmosphere, and constrain the volume mixing ratio to <2.5 × 10⁻⁶ at 3σ. This is consistent with other early JWST observations of cold brown dwarfs (S. A. Beiler et al. 2023, 2024). While the species is known in the atmospheres of Jupiter and Saturn (F. C. Gillett & W. J. Forrest 1974; R. G. Prinn & J. S. Lewis 1975; S. T. Ridgway et al. 1976), phosphine has not yet been detected in any exoplanet or brown dwarf except very recently in WISE-0855 (M. J. Rowland et al. 2024) at a volume mixing ratio of or (1.23 ± 0.2) × 10−9 depending on the data set used, and possibly in UNCOVER-BD-3 (A. J. Burgasser et al. 2024) though this is disputed (S. A. Beiler et al. 2024). NIRSpec observations in the 4–5 μm range are more sensitive to PH3 than our data, though a sufficiently high PH3 abundance would also be visible in MIRI/MRS spectra at 8.9 and 10.1 μm.

Finally, we tested for the presence of H2S, which has been seen in a few other cold brown dwarfs with JWST (C. E. Hood et al. 2024; B. W. P. Lew et al. 2024), but we do not detect the species and place a modest upper limit of 1.8 × 10⁻³. This is unsurprising without NIRSpec data, since H2S has no strong features beyond 5 μm.
7. Discussion
The mid-IR spectrum of WISE-0458 is well fitted with a clear atmosphere model, and the retrieved temperature–pressure profile is broadly consistent with predictions from self-consistent forward models (see Figure 5), indicating that our P–T parameterization within the pRT setup is sufficient to describe this atmosphere. Our model shows evidence for five molecules: H2O, CH4, NH3, HCN, and C2H2.

Figure 5. Retrieved pressure–temperature profile of the two brown dwarfs (blue), with the 1σ, 2σ, and 3σ intervals shaded, and the contribution function (gray). The P–T profile is broadly consistent with a self-consistent profile (here an ATMO model (brown) with 550 K, = 5.5, and chemical equilibrium (M. W. Phillips et al. 2020) for reference). The retrieved profile has slightly less curvature, which is unsurprising, given that we use a regularization term for the P–T profile (see text).

Download figure:
Standard image High-resolution imageWe measure a radius of for each brown dwarf (assuming the two binary components have equal radii and based on the effective radius of determined for the pair in our retrievals), while the ATMO evolutionary models predict a radius of 0.84RJup for a single field-age 40MJup brown dwarf and 0.93RJup for a single field-age 20MJup brown dwarf. The measured uncertainty on the effective radius is very small (0.01RJup), while the difference in effective radius between our two models (Table 1) is 0.05RJup: this highlights the model dependence of the radius, which is also degenerate with the measured temperature and molecular abundances. Further, the distance is fixed to 9.24 pc in our calculations, and the distance uncertainty (±0.15 pc) has not been incorporated into the radius uncertainty. Taking this into account, the retrieved radius is broadly consistent with predictions of evolutionary models.


Table 1. Best-fit Parameters for our Retrievals
| Parameter | Prior | Basic Model | Model with HCN, C2H2 |
|---|---|---|---|
| Physical parameters | |||
| log(g[cm s−2]) | Uniform [2.5, 6.0] | ||
| Measured radius [RJup] | Uniform [0.46, 2.74] | ||
| Pressure–temperature profile | |||
| Base temperature (Node0) [K] | Uniform [100, 9000] | ||
| Temp. ratio Node1/Node0 | Uniform [0.2, 1.0] | ||
| Temp. ratio Node2/Node1 | Uniform [0.2, 1.0] | ||
| Temp. ratio Node3/Node2 | Uniform [0.2, 1.0] | ||
| Temp. ratio Node4/Node3 | Uniform [0.2, 1.0] | ||
| Temp. ratio Node5/Node4 | Uniform [0.2, 1.0] | ||
| Temp. ratio Node6/Node5 | Uniform [0.2, 1.0] | ||
| Temp. ratio Node7/Node6 | Uniform [0.2, 1.0] | ||
| Temp. ratio Node8/Node7 | Uniform [0.2, 1.0] | ||
| Temp. ratio Node9/Node8 | Uniform [0.2, 1.0] | ||
| γ | Gaussian, σ = 1, μ = 1 | ||
| Molecular abundances [volume mixing ratio] | |||
| H2O | Uniform in log(mass fraction) between [−10, 0] | ||
| CH4 | Uniform in log(mass fraction) between [−10, 0] | ||
| NH3 | Uniform in log(mass fraction) between [−10, 0] | ||
| HCN | Uniform in log(mass fraction) between [−10, 0] | ⋯ | |
| C2H2 | Uniform in log(mass fraction) between [−10, 0] | ⋯ | |
| Abundance upper limits [volume mixing ratio] | |||
| CO | Uniform in log(mass fraction) between [−10,0] | <4.1 × 10⁻⁶ | <4.2 × 10⁻⁶ |
| CO2 | Uniform in log(mass fraction) between [−10,0] | <5.8 × 10⁻⁷ | <2.0 × 10⁻⁷ |
| Other parameters | |||
| b | Uniform [−14.259, −7.150] | ||
| Derived parameters | |||
| Teff [K] | ⋯ | ||
| C/O [atomic ratio] | ⋯ | ||
| Fe/H [× solar] | ⋯ | ||
| Radius/√2 [RJup] | ⋯ | ||
| Mass [MJup] | ⋯ | ||
| Fixed parameters | |||
| Distance [pc] | ⋯ | 9.24 | 9.24 |


Note. We show the values for both our "basic model" (with five molecules: H2O, CH4, NH3, CO, and CO2) as well as our preferred model, which is the same as the basic model except for the addition of HCN and C2H2. Listed uncertainties are 1σ.
Download table as: ASCIITypeset image
We derive a mass of for each brown dwarf based on the retrieved values of and radius values, corresponding to a total mass of for the pair. This is higher than expected from evolutionary models, based on the low temperature of the pair. The retrieved mass is also somewhat higher than the dynamical mass estimated for the pair of brown dwarfs (, S. K. Leggett et al. 2019), though we note that using a single value in our retrievals for the binary is an oversimplification. Future works should use the resolved brown dwarf astrometry from MIRI and/or NIRSpec to improve this orbital fit, and make a more robust comparison between the spectroscopically derived and dynamically derived masses.


Analysis of the NIRSpec observations of this target (B. W. P. Lew et al. 2025, in preparation) will likely improve our CO and CO2 constraints and help determine a more precise C/O ratio for the atmosphere. This may shed further light on the carbon chemical network of WISE-0458, which will be relevant for explaining the presence of C2H2. We do not expect this to significantly alter the constraints, since H2O and CH4 are the main carriers of oxygen and carbon respectively in a cool, high- atmosphere (e.g., K. J. Zahnle & M. S. Marley 2014), and our CO and CO2 upper limits are much lower than the measured CH4 abundance, which suggests that CH4 is a sufficient proxy for atmospheric carbon content. Note also that sufficiently high CO2 abundance would lead to an absorption feature at 15 μm, which would be readily detectable with MIRI/MRS data but is not seen in the WISE-0458 spectrum. If there is any sequestration of oxygen in cloud species, then this would lead to an even lower C/O ratio than our measured value (and not the strongly supersolar C/O regime that might be needed to promote C2H2 formation in current models).

7.1. Uncertainty Inflation
We inflated the pipeline-derived flux uncertainties, as discussed in Section 5. For the model including HCN and C2H2, we retrieved a b-parameter value of −8.208 ± 0.017, corresponding to an uncertainty inflation factor of 19 ± 4 (full range 9–34) depending on the wavelength. In fact, this relatively high inflation is a natural consequence of a known issue in the JWST data reduction: the uncertainty calculated by the pipeline is underestimated;23 this underestimation can be up to 10–50×. The proposed workaround is to bootstrap errors based on the science spectra; in our analysis the inclusion of a b parameter inflating the uncertainties is functionally equivalent to this suggested bootstrapping. Taking this known issue into account, the uncertainty inflation is reasonable, indicating that the atmospheric structure and chemical composition of the brown dwarf atmosphere of WISE-0458 are relatively well-captured in our best-fit model. An ideal solution to the underestimated errors would also reflect any wavelength dependence of this uncertainty (whereas our b parameter applies the same scaling factor, added in quadrature, across all wavelengths). However, this would introduce additional free parameters; the residuals (Figures 1(c), (e), (g)) do not show any strong wavelength dependence, indicating that the b-parameter approach is sufficient to model the underestimation of error in this case. This assumption should be revisited if a future pipeline update improves the error estimation.
7.2. Optimal Wavelengths for HCN and C2H2 Detection
HCN and C2H2 are most detectable at mid-IR wavelengths with the JWST/MIRI MRS instrument. In Figure 3 we present opacities of the molecular species in our best-fit model, based on the retrieved abundance value or upper limit from our best-fit model; HCN and C2H2 are highlighted with bold lines in this plot. For this figure we used a nominal temperature of 600 K and a pressure of 0.1 bar. In the lower panel, we highlight regions of the NIRSpec (left) and MRS (right) wavelength ranges where HCN and C2H2 have the highest opacities. At the abundances observed in WISE-0458, the only significant absorption features of HCN are at 14 and 14.3 μm, and the only significant feature of C2H2 is at 13.7 μm. Both species also have a significant impact on the continuum, especially between ∼12 and 16 μm.
Considering the 1–5 μm wavelength range (i.e., the wavelengths observable with JWST/NIRSpec), neither HCN nor C2H2 is likely to be detectable at the abundance measured in WISE-0458: for an R ∼ 1000 spectrum and the WISE-0458 abundances, HCN is the strongest absorber only for a single data point at 3.06 μm, where the H2O opacity briefly dips and before the CH4 opacity becomes strong. For a sufficiently elevated abundance, HCN may become visible around 3 μm and possibly 1.5 μm in NIRSpec observations. C2H2 has an even lower opacity in this region, and we do not expect C2H2 to be observable in the near-IR. Further, neither species should be detectable with MIRI/LRS, which is optimized for sensitivity between ∼5 and 12 μm (S. Kendrew et al. 2015). The MIRI/MRS instrument is therefore uniquely sensitive to low abundance detections of HCN and C2H2 in brown dwarf atmospheres, and subchannel 3B is required for both molecules.
7.3. Future Prospects for HCN and C2H2 Detection
WISE-0458 is the first T-type brown dwarf observed with MIRI/MRS, and as such the first T-type brown dwarf where HCN and C2H2 are readily detectable. Two Y-type objects have MIRI/MRS spectra (D. Barrado et al. 2023; H. Kühnle et al. 2024), but HCN and C2H2 are not detected in either object.
It remains to be seen how common these species are in other T-type atmospheres. In particular, in-hand observations of the T8 object Ross-458 (ExoMIRI consortium, N. Whiteford et al. 2025, in preparation) and upcoming observations of the brown dwarf binary Eps Ind BA/BB (T1+T6, R. R. King et al. 2010; E. C. Matthews et al. 2024) will provide a valuable comparison of how HCN and C2H2 abundances vary with temperature. The T-type exoplanets COCONUTS-2b (T9, J. D. Kirkpatrick et al. 2011; Z. Zhang et al. 2021) and GJ 504b (T8, M. Janson et al. 2013) are also scheduled for MIRI/MRS observations (P. A. Patapis et al. 2023, 2024), though these have much lower surface gravity, and lower HCN abundances are expected in the low regime (K. J. Zahnle & M. S. Marley 2014). Nondetections of HCN in these low-surface-gravity objects would provide further indications that HCN is indeed driven by strong vertical mixing, as modeled in K. J. Zahnle & M. S. Marley (2014). The detection or absence of C2H2 as a function of effective temperature and surface gravity may explain why we are detecting such a surprisingly high C2H2 abundance in WISE-0458.

8. Conclusions
In this work, we have presented a mid-IR spectrum of WISE-0458 at resolution >1000 between 4.9 and 18.0 μm and treated the system as an unresolved binary. This is the first JWST/MIRI/MRS spectrum of any T-type object and is well modeled by a clear, molecule-rich atmosphere in our retrieval analysis. Our key findings are the following.
- 1.HCN is detected at 13.4σ in the WISE-0458 atmosphere, suggesting very strong vertical mixing (Kzz ∼ 1011 cm2 s−1), in tension with previous studies of T dwarf vertical mixing.
- 2.C2H2 is detected at 9.5σ in the WISE-0458 atmosphere; this discovery is surprising and cannot be explained with a standard prescription of quenching, i.e., a deep-atmosphere equilibrium species brought to higher altitudes (lower pressure levels) with vertical mixing using a single Kzz value.
- 3.PH3 and 15NH3 are not detected. The PH3 nondetection is consistent with other JWST spectra of late-type brown dwarfs. The 15NH3 nondetection is consistent with the observed 15N enrichment of other cold brown dwarfs, and we highlight that 15NH3 will be most readily detectable in cold brown dwarfs (Teff ≲ 500 K).
- 4.The atmosphere of WISE-0458 is well fitted by our retrievals with a cloud-free model. The required uncertainty inflation is consistent with the known underestimation of MRS uncertainties in the jwst pipeline.
This spectrum demonstrates the power of MIRI MRS to characterize cold brown dwarfs. Future works should study the HCN and C2H2 in more detail and determine whether these species are present in other cold brown dwarfs of similar temperature to WISE-0458. Our data challenge existing prescriptions for atmospheric mixing and/or C2H2 chemistry and hint toward a new era in brown dwarf chemistry with an increasing number of carbon species detectable in these cold atmospheres.
Acknowledgments
This work is based on observations made with the NASA/ESA/CSA James Webb Space Telescope. The data were obtained from the Mikulski Archive for Space Telescopes at the Space Telescope Science Institute, which is operated by the Association of Universities for Research in Astronomy, Inc., under NASA contract NAS 5-03127 for JWST. These observations are associated with program #1189. All the JWST data used in this paper can be found in MAST under the DOI 10.17909/0tbz-1635.
We used pyMultiNest (J. Buchner et al. 2014), which in turn builds on MultiNest (F. Feroz & M. P. Hobson 2008; F. Feroz et al. 2009, 2019) for the nested sampling analysis. We used various functions from astropy (Astropy Collaboration et al. 2013, 2018, The Astropy Collaboration et al. 2022), pandas (W. McKinney 2010; pandas development team 2021), scipy (P. Virtanen et al. 2020), matplotlib (J. D. Hunter 2007), and seaborn (M. L. Waskom 2021) to carry out analysis and create figures.
P.P. thanks the Swiss National Science Foundation (SNSF) for financial support under grant No. 200020_200399. N.W. acknowledges support from NSF awards #2238468 and #1909776, and NASA Award #80NSSC22K0142 P.-O.L acknowledges funding support by CNES. S.-M.T. acknowledge support from NASA through Exobiology grant No. 80NSSC20K1437. B.V., O.A, I.A, and P.R. thank the European Space Agency (ESA) and the Belgian Federal Science Policy Office (BELSPO) for their support in the framework of the PRODEX Programme. O.A. is a Senior Research Associate of the Fonds de la Recherche Scientifique – FNRS. D.B. is supported by Spanish MCIN/AEI/10.13039/501100011033 grants PID2019-107061GB-C61 and PID2023-150468NB-I00. G.O. acknowledge support from the Swedish National Space Board and the Knut and Alice Wallenberg Foundation. J.P.P. acknowledges financial support from the UK Science and Technology Facilities Council and the UK Space Agency. For the purpose of open access, the author has applied a Creative Commons Attribution (CC BY) licence to the Author Accepted Manuscript version arising from this submission. E.v.D. acknowledges support from A-ERC grant 101019751 MOLDISK. T.P.R. acknowledges support from the ERC grant 743029 EASY. G.Ö. acknowledges support from SNSA.
Appendix A: Posteriors of Best-fit Retrievals
Here we present the full posteriors of the retrieval analysis, as described in Section 5. In Table 1 we provide posterior values (median and 1σ confidence intervals) for all parameters, for our "basic" retrieval (molecules CH4, CO2, CO, H2O, and NH3) and our retrieval with HCN and C2H2 (and otherwise identical to the "basic" retrieval).
In Figure 6 we provide a corner plot for the retrieved volume mixing ratios for all molecules in the atmospheres, for our "basic" model and for models with HCN added, and with C2H2 added, and with both HCN and C2H2 added. The abundances of HCN and C2H2 are somewhat correlated, since both have a similar effect on the continuum between 12 and 16 μm. The basic model and the model with C2H2 added show a hint of a CO2 detection, in the form of a peak in the posterior at a volume mixing ratio of ∼10−7 but a long tail toward lower abundances. However, this posterior peak disappears when including HCN; we infer that the CO2 detection was a false positive to explain the effect of HCN on the broadband spectral shape.

Figure 6. Corner plot for molecular abundances in the pRT retrievals. Abundances shown are volume mixing ratios. We show the posteriors for our basic model (gray, including H2O, CH4, NH3, CO, CO2) as well as with HCN added (brown), with C2H2 added (pink), and with both HCN and C2H2 added (green). HCN and C2H2 have some overlapping features around 14 μm and have similar impacts on the continuum (see Figure 3; this causes the abundances to be correlated and the inclusion of one species alters the retrieved abundance of the other. For the models without HCN, a spurious tentative detection of CO2 is present in the posteriors, as discussed in the text; this disappears when HCN is included in the models. The retrieved abundances of H2O, CH4, and NH3, all of which have strong features in the MRS spectrum, are largely unchanged by the addition of HCN and C2H2.
Download figure:
Standard image High-resolution imageAppendix B: Detectability of 15NH3
15NH3 is not observed in the WISE-0458 atmosphere, even though it has been seen in other MRS observations of cold brown dwarfs. For the cold brown dwarf WISE J1828 (380 K) 15NH3 was detected (D. Barrado et al. 2023), and for the coldest known brown dwarf WISE J0855 (∼285 K), the 15NH3/14NH3 ratio is very well constrained (H. Kühnle et al. 2024). We infer this is a temperature-dependent effect (similar to that described for isotopologues of C and H by P. Mollière & I. A. G. Snellen 2019).
In this appendix we provide a comparison of the 15NH3 and 14NH3 opacities, at a reference pressure of 0.1 bar and three reference temperatures of 300 K, 500 K, and 700 K, and generated with pRT (Figure 7). For this comparison we assume an abundance ratio of 250, similar to the ISM value. At higher temperatures, the 14NH3 opacity is much higher than the 15NH3 opacity at all wavelengths, and 15NH3 is not detectable. At lower temperatures, selected 15NH3 opacity features begin to protrude over the 14NH3 opacity, meaning that a sufficiently high-quality mid-IR spectrum would detect both isotopes. For sufficiently cold planets (e.g., the 300 K example in Figure 7), many 15NH3 features clearly emerge over the 14NH3 opacity. These plots highlight the strong temperature dependence of the detectability of 15NH3, which will likely only be detectable in planets and brown dwarfs colder than ∼500 K.

Figure 7. Relative opacities for 14NH3 and 15NH3 at three nominal temperatures, assuming an abundance ratio of 250:1 (similar to the ISM ratio for 14N/15N, A. M. Ritchey et al. 2015), and the ratio between the two opacities in each case. A simplified assumption is that 15NH3 is detectable if it has any features with local opacity stronger than the 14NH3 opacity, i.e., in the green region of the lower panel for each temperature. 15NH3 is only detectable in the coldest brown dwarfs.
Download figure:
Standard image High-resolution imageAppendix C: Custom Background Treatment
After dither subtraction, the background remains poorly corrected: there is significant spatial structure, primarily in the form of "striping," i.e., linear regions across the detector that are significantly nonzero. Even more concerning, this poorly corrected background varies as a function of wavelength, meaning that wavelength-dependent systematics introduce spurious "features" into the spectrum or change the shape of true molecular features. Given the 2D nature of this structure, an annulus subtraction is insufficient to correct the background contribution to extracted photometry. This in turn adds a systematic to the 1D spectrum: aperture photometry on each slice of the 3D cube is biased since the local background contribution is not zero within the aperture, and instead contributes a wavelength-dependent positive or negative flux to the photometry procedure. When the MRS cube is built in the ifualign orientation (i.e., in the instrument plane, as opposed to the skyalign, where the cube is built with north up and east left), these background variations appear as horizontal and vertical stripes in each slice of the 3D cube. This suggests that they are associated with large-scale detector systematics, with pixels that are physically close in the detector space showing correlated values.
Figure 8 illustrates this issue: here we show an example integral field unit (IFU) cube (*s3d.fits), extracted in the ifualign orientation and collapsed across wavelength and with the source masked. Significant striping in the background is clear, especially in the horizontal direction. The right and lower panels show the mean and variation of the pixels in each row/column, with colored traces demonstrating how this background evolves with wavelength through a single IFU cube.

Figure 8. Background systematics in the MIRI/MRS data. The central image shows the channel 2A IFU cube (*s3d.fits) collapsed along the wavelength direction, with the source location and the two negative copies of the source (due to the dither strategy of these observations) masked. Even after dither subtraction, the background of these frames is significantly divergent from 0 and varies with wavelength. In the right-hand and lower panels, black lines and gray shading indicate the mean and 1σ variation of the pixel value along each row/column; orange, green, and purple traces indicate the mean and 1σ values for each 1/3 of the wavelength range of the data. These traces show strong variation in the "normalized" background through the cube, which introduces systematics into the spectrum, especially for faint targets such as WISE-0458.
Download figure:
Standard image High-resolution imageTo correct for this effect, we performed a data-driven postprocessing on the 3D cubes. The code for this correction is available at https://github.com/ecmatthews/mirimrs_destripe. We found that a relatively simple treatment was effective: in the ifualign orientation, we subtracted the mean value of each row and each column from that row/column, in order to "flatten" the background and remove large-scale structures. We then used the standard Extract1dStep from the jwst pipeline to extract a spectrum from these "flattened" *s3d.fits files. While this does not account for systematics that change within a row/column, we found that these are rarely present in the background of our frames. In Figure 9 we highlight the impact of this correction on the extracted spectrum. The correction can impact the overall slope of the spectrum (e.g., around 7.6 μm) as well as introduce sharper features and change the shapes of absorption features (e.g., around 8 μm).

Figure 9. Spectrum of the target before (light colors) and after (dark colors) the residual background correction (Appendix C). We show the full spectrum in the upper panel and zooms of channels 1B and 2A in the middle and lower panels. The correction significantly impacts the overall shape of the spectrum, as well as altering the shapes of some features in the spectrum. In both cases the spectrum is extracted using an aperture radius of 2× FWHM to ensure that the flux of both components of the brown dwarf binary is captured. Each different color represents a different subchannel of the MIRI MRS.
Download figure:
Standard image High-resolution imageThese changes in turn bias the outcome of retrieval analyses on the measured spectrum. We illustrate this in Figure 10 with a retrieval on data without this background correction, where extended wavelength-dependent systematics are visible, with the same physical model as for Figure 1. There are clear, wavelength-dependent systematics remaining in the residuals (unlike in Figure 1 above) that cannot be explained with an atmosphere model. Further, the shapes of key molecular features are distorted, and the retrieved abundances of molecules in the atmosphere are correspondingly biased.

Figure 10. Same as Figures 1(b)–(g), but for the spectrum without the background correction applied (see Appendix C for details). The dispersion of data points around the model is larger than in Figure 1, and wavelength-dependent systematics can clearly be seen in the residuals (lower panel), which show structured deviations from 0. Systematics impact the shape and presence of absorption features; retrieved abundances are correspondingly biased.
Download figure:
Standard image High-resolution image
Future works should explore more sophisticated corrections to this residual background term. In particular, a data-driven postprocessing in the calibrated detector images produced by the stage 2 pipeline (*cal.fits) might allow for large-scale structures in the residual background term to be modeled and removed. We further recommend that several different dither positions be used when collecting spectra (as opposed to the two dither positions used in the present work) to provide a larger data set with which to model and remove the background emission.
Footnotes
- 21
- 22
- 23