


Abstract
We report the first results from a deep near-infrared campaign with the Hubble Space Telescope to obtain late-epoch images of the Hubble Ultra Deep Field, 10–15 yr after the first epoch data were obtained. The main objectives are to search for faint active galactic nuclei (AGN) at high redshifts by virtue of their photometric variability and measure (or constrain) the comoving number density of supermassive black holes (SMBHs), nSMBH, at early times. In this Letter, we present an overview of the program and preliminary results concerning eight objects. Three variables are supernovae, two of which are apparently hostless with indeterminable redshifts, although one has previously been recorded as a z ≈ 6 object precisely because of its transient nature. Two further objects are clear AGN at z = 2.0 and 3.2, based on morphology and/or infrared spectroscopy from JWST. Three variable targets are identified at z = 6–7 that are also likely AGN candidates. These sources provide a first measure of nSMBH in the reionization epoch by photometric variability, which places a firm lower limit of 3 × 10⁻⁴ cMpc−3. After accounting for variability and luminosity incompleteness, we estimate nSMBH ≳ 8 × 10⁻³ cMpc−3, which is the largest value so far reported at these redshifts. This SMBH abundance is also strikingly similar to estimates of nSMBH in the local Universe. We discuss how these results test various theories for SMBH formation.

Original content from this work may be used under the terms of the Creative Commons Attribution 4.0 licence. Any further distribution of this work must maintain attribution to the author(s) and the title of the work, journal citation and DOI.
1. Introduction
The search for active galactic nuclei (AGN) in the early Universe proceeds for several reasons. Each counted AGN means at least one supermassive black hole (SMBH) is identified, which places a lower limit constraint on the abundance of SMBHs at early times. Accurate determination of this abundance may in turn be used to test SMBH formation theories (e.g., Rees 1978; Volonteri 2010; Banik et al. 2019; Inayoshi et al. 2020; Singh et al. 2023). The recovered number density and associated SMBH seeding mechanisms may in turn be used as an empirically motivated input to galaxy formation simulations, where AGN are fundamentally implicated in galaxy evolution, luminosity functions, quenching, and other phenomena.
Some theoretical models (e.g., Banik et al. 2019) predict that large numbers of AGN exist in the reionization epoch, and recent observations from JWST may (at least in part) confirm the abundance to be larger than general community-wide expectations from before 2022 (e.g., Harikane et al. 2023; Larson et al. 2023; Maiolino et al. 2023). Most specifically, the families of "little red dots" at z > 4 (Furtak et al. 2023; Matthee et al. 2024; Kokorev et al. 2024; Wang et al. 2024) mark an unexpected discovery. These compact objects are identified at high-z with a smoothly rising red spectral energy distribution (SED) and often showing broad Balmer emission lines. While it is not settled that the majority of these contain AGN, spectroscopic studies show that a substantial fraction may do so, which could imply large numbers of AGN in the reionization era. With AGN expected to exhibit high hydrogen ionizing photon production efficiencies and escape fractions, they could (once more) become implicated in reionization scenarios.
The challenge to this field comes from the fact that identifying AGN at the luminosity regimes of typical galaxies (below L⋆, with MUV ≳ −20) is observationally difficult. There are numerous tracers of accretion-powered excitation in galaxies, including, but not limited to, X-ray or radio continuum emission that is too bright to be produced by star formation, the presence of broad emission lines, the presence of emission lines with ionization potentials too high to be explained by stellar photoionization or shocks, various ratios of emission line fluxes, and mid-infrared (MIR) colors consistent with dust heated to temperatures of ∼1000 K. Yet the heterogeneous population of AGN typically satisfies subsets of these criteria, which become observationally more challenging/less complete at different rates as surveys target higher redshifts. This leads to SMBHs probably being undercounted, with potentially large numbers going unnoticed among the ostensibly star-forming galaxy population at high-z. Multiple diagnostics are mandatory to place stronger constraints on the AGN abundance.
Here we argue that the photometric variability that results from changes in the mass accretion rate of SMBHs can provide a completely independent and complementary probe of AGN. Monitoring for variability selects AGN from imaging data directly by phenomena related to the SMBH, without any biases of photometric preselection (color, luminosity, compactness, etc), and has been used successfully at intermediate redshifts in deep Hubble Space Telescope (HST) imaging (Cohen et al. 2006; Pouliasis et al. 2019; O'Brien et al. 2024). However, the highest redshifts require monitoring at infrared wavelengths in order to even detect galaxies: JWST would obviously be the best tool, but as such a recent observatory, it will take years to build the requisite time baselines when accounting for cosmological time dilation. HST provides a head start. WFC3 was mounted in 2009 and almost immediately began imaging some of the best-studied extragalactic fields at λ = 1–1.6 μm. The deepest of these is the Hubble Ultra Deep Field (HUDF), which was imaged in 2009 and 2012 (Bouwens et al. 2010 and Ellis et al. 2013, respectively) and provides the optimal field for a search for faint AGN at high redshifts.
We reimaged the HUDF in 2023 to search for variable sources over a 10–15 yr time window. This is critical for very high-z systems where time dilation reduces this delay by a factor of (1 + z), to time spans of just ∼1 yr in the rest frame. In this Letter, we present an overview of our survey and the observational data sets (Section 2) and some selected preliminary results (Section 3) that include supernovae, independently confirmed AGN at z = 2–3.5, and newly discovered transients whose photometric/spectroscopic redshifts are consistent with sources in the reionization era. We provide some discussion regarding the SMBH abundance at z > 6 in Section 4 and the implications for SMBH seeding mechanisms.
2. Observations, Data, and Methods
2.1. Observations and Reductions
In order to maximize our sensitivity to high-z variable AGN, we elected to target the HUDF because this field has provided samples at the highest comoving volume density. The field was first observed in the optical with the Advanced Camera for Surveys (ACS; Beckwith et al. 2006) and then with the critical near-infrared (NIR) mode with WFC3/IR in 2008–2009 under GO 11563 (UDF09; PI: Illingworth), which conducted imaging in three filters (F105W, F125W, and F160W) over 192 orbits. In 2012, the field was imaged again under GO 12498 (UDF12; PI: Ellis), which substantially deepened the F105W and F160W observations and added a fourth filter, F140W, to search for Lyman break galaxies at z ∼ 8. With the singular goal of searching for photometric variability in all sources in the HUDF IR footprint, we reimaged the field in 2023 September in the F140W filter, matching the precise center, field orientation, and depth (30 orbits) of the GO 12498 observation.
We reduced the F140W image with the calwfc3 pipeline and astrodrizzle (STSCI Development Team 2012) software using the high-level science products (HLSP) obtained from the Mikulski Archive for Space Telescopes as reference images. We also rereduced the F140W image from the UDF12 campaign to verify that our methods match the depth of the HLSP image. At the same time, we produced independent reductions of the F105W and F160W images at the 2009 and 2012 epochs to search for variable sources over the shorter, earlier time baseline. Full details of the observations and data reduction will be presented in V. Cammelli et al. (2024, in preparation) and A. Young et al. (2024, in preparation). This facilitates variability searches at three epochs: the span 2009–2012 is sampled by the F105W and F160W filters, while the duration 2012–2023 is sampled by the F140W filter only (see Table 1 for details).
Table 1. Observing Epochs and Times
| Year | Filters | Orbits | GO No./PI |
|---|---|---|---|
| 2008–2009 | F105W | 24 | 11563/Illingworth |
| F160W | 53 | ||
| 2012 | F105W | 72 | 12498/Ellis |
| F140W | 30 | ||
| F160W | 26 | ||
| 2023 | F140W | 30 | 17073/Hayes |
Download table as: ASCIITypeset image
2.2. The Search for Variable Sources
We searched for variables in each matched pair of filters using two techniques: comparison of the nuclear/central photometry of galaxies at different epochs and detection of residual sources in pair-subtracted images. We avoid regions toward the edge of the image where the dithering pattern has led to excess noise and consider only a central pointing of the HUDF covering 123'' × 139''. The photometric comparison follows a similar method to that of O'Brien et al. (2024): for each of the six WFC3/IR images, we identify sources using Source Extractor (Bertin & Arnouts 1996). In contrast to performing "global" galaxy photometry (e.g., with Kron-like or moment-centered apertures as Source Extractor would do), we seek to obtain photometry centered upon the brightest unresolved sources within each galaxy. We therefore rely only upon the brightest pixel coordinates reported by Source Extractor and the background images it produces as part of its background subtraction procedure. We first use astropy's photutils package to produce precisely recentered coordinates in the immediate vicinity of the {XPEAK_IMAGE,YPEAK_IMAGE} for each source. At this coordinate, we then uses photutils to perform aperture photometry in 4 pixel diameter (0 26) apertures with a local background subtraction to remove local (noncompact) galaxy light. However, this would not include Poissonian uncertainties from the sky background, which we calculate from the background-level images stored by Source Extractor (stored with CHECKIMAGE flags) using the same determined effective gains and add in quadrature to the error per source using the local photometry. We verified that this approach produces values comparable to Source Extractor's MAG_APER measurements but with more precise centroiding inside extended sources.
For each of the six images we use for detection, we also perform photometry in identical apertures in the other image obtained in the same filter, similar to "dual image mode" in Source Extractor. Thus, for each image, we obtain photometry of each galaxy nucleus in detection and comparison bands, working in both directions. We contrast these local aperture magnitudes in each of the images with respect to the photometric uncertainty of each source. However, we must also account for the artificially underestimated uncertainties that result from the signal being correlated between adjacent pixels during the drizzling process (e.g., Casertano et al. 2000; Fruchter & Hook 2002). We examine the global distribution on the Δm versus m diagram (V. Cammelli et al. 2024, in preparation), where here mdet is the magnitude in the image used for source detection, and mtest is the magnitude in the image used to test for photometric variability.

We first correct a ≃0.01 mag systematic offset that is identified at all magnitudes, probably because of slightly imperfect zero-points being reported to images obtained many years apart. We then proceed by assuming that the overwhelming majority of sources in the field are not variable. We compute the one-sided standard deviation of the Δm distribution in bins of 0.5 mag, where we include only sources that are brighter in mtest compared to mdet (hence the matched-aperture photometry in both directions). We contrast the resulting standard deviations with the propagated uncertainty on the magnitude difference derived from our photometric catalogs: . We then compute the total scale factor that scales the combined uncertainty reported by astropy/photutils to reproduce the global Δm distribution. This ensures that, for example, 31.7% of our sources have Δm/σm ≥ 1, 4.5% of sources have Δm/σm ≥ 2, etc. See O'Brien et al. (2024) for a more detailed discussion.

To be identified as a variable source, an object must be detected at Δm/σm ≥ 2 in two or more filters or Δm/σm ≥ 3 in one filter. Should those two filters be the F105W and F160W that were taken at the same epochs, we further demand that Δm has the same sign (i.e., that the source is consistently inferred to be brightening or fading over 2009–2012). If one of the filters is F140W, we enforce no sign constraints on Δm, allowing for a source to brighten and then fade, or vice versa. We have verified that for the number of sources in the images, these selections result in a negligible suspected level of contamination from nonvarying sources (V. Cammelli et al. 2024, in preparation) at magnitudes as faint as 29. For the matched sources, we compute their "total significance of variability" as the quadrature addition of Δm/σm in two bands (or three if the source is variable in all filters).
In addition, we produced pair-subtracted images for each filter to search for variable sources that may have been missed by photometric comparison and to verify the compact nature of variables. We first smoothed each image with a very small Gaussian kernel of 0.5 pixels and directly subtracted images obtained in the same filters. This produced six "difference images." We ran Source Extractor on the difference images after recomputing the effective gains for each image, as the subtraction increases the sky noise and mimics a shallower integration time. Each source was inspected by eye, and spurious artifacts were removed. We retain sources that have 5σ significance as variables.
2.3. Redshift Determination
We cross-correlate each of these sources against positions in known redshift catalogs, including catalogs from the Very Large Telescope (VLT)/MUSE (spectroscopic; Bacon et al. 2023), the JADES program using both NIRSpec for spectroscopic redshifts (Bunker et al. 2023) and NIRCam+HST for photometric redshifts (Rieke et al. 2023), and the Ultraviolet UDF (UVUDF) photometric catalogs (Rafelski et al. 2015). We also cross-correlate with known AGN in the GOODS-S field, compiled by Lyu et al. (2022). Further, we extract our own photometry from all HST filters (11 bands from WFC3 and ACS; Beckwith et al. 2006; Bouwens et al. 2010; Ellis et al. 2013; Koekemoer et al. 2013; Teplitz et al. 2013), JWST in nine broadband filters from JADES (Rieke et al. 2023), and five intermediate-band filters from the JEMS program (Williams et al. 2023). Finally, we have reduced the deep slitless spectroscopy obtained from JWST/NIRISS (Pirzkal et al. 2024) under the NGDEEP campaign (GO 2079; PI: Finkelstein) and extracted spectra at the location of all variable sources, recentering on sources detected in NIRISS direct imaging. See V. Cammelli et al. (2024, in preparation) for the redshift distribution of the variable sources and A. Young et al. (2024, in preparation) for an analysis of their morphologies and photometric inferences.
3. Selected Variable Sources in the HUDF
In total, we can identify 71 sources with photometric variability greater than 3σ over all epochs and filters. These have redshifts in the range 0–7 but are concentrated at lower z. We present preliminary results in this Letter, with the focus upon a subset of interesting variable objects. These include two confirmed AGN at z = 2–3.2, which demonstrate the variability method in finding convincing AGN at redshifts where they can be independently confirmed. The HUDF is arguably the best-studied region of the extragalactic sky and has been targeted across the electromagnetic spectrum: independent AGN confirmation methods include deep optical and NIR spectroscopy from VLT/MUSE and HST/grism, the deepest X-ray imaging from Chandra, radio continuum imaging, and deep Spitzer imaging to measure MIR colors (see Section 4.1 for more details). We also show results for three transients that are most likely supernovae, of which one in particular appears at z ≃ 6 but is in fact an interloper at lower redshift. We finally present our confident variable sources with redshifts in the range z > 5–7.
3.1. Variable AGN at Intermediate Redshifts
To demonstrate the utility of photometric variability as an AGN probe, we draw attention to objects 1051264 and 1052126 in Figure 1 and Table 2.

Figure 1. Photometric variability of 1051264 at z = 2 (upper panels) and 1052126 at z = 3.2 (lower panels) sources. We show difference images of F105W and F140W to the left, where the earlier epoch is subtracted from the later. The color bar is symmetric around 0, so black objects get brighter with time and white objects become fainter. Panels to the right show the ACS/F606W image taken in 2005, averages of the F105W and F140W images over both epochs at which they were observed, and the JWST F277W image. Intensity images are calibrated in MJy Sr−1 with color bars shown to the side. Cutouts are 24 × 24.
Download figure:
Standard image High-resolution imageTable 2. Properties of Two Example Intermediate-redshift AGN Detected by Variability
| ID | R.A. | Decl. | Mag 2009 | Mag 2012 | Mag 2012 | Mag 2023 | Redshift | Source |
|---|---|---|---|---|---|---|---|---|
| J2000/Gaia | J2000/Gaia | F105W/F160W | F105W/F160W | F140W | F140W | |||
| 1051264 | 53.180819 | −27.787328 | 26.006 ± 0.013 | 26.332 ± 0.013 | 24.890 ± 0.015 | 24.909 ± 0.016 | 1.95 | NIRISS |
| 1052126 | 53.178480 | −27.784036 | 24.493 ± 0.006 | 24.378 ± 0.003 | 24.092 ± 0.004 | 24.596 ± 0.006 | 3.190457 ± 0.000038 | MUSE |
Download table as: ASCIITypeset image
Object 1051264—This source lies in the center of an edge-on disk galaxy. Image subtraction (Figure 1) shows the object is pointlike. It decreased in brightness by 0.3 mag between 2009 and 2012 at very high significance (Table 2), although the magnitude of this variation is small—(0.08 ± 0.025 mag) by global (Kron) photometry—because of dilution by the host galaxy. Its absolute magnitude is MUV = −20.3, suggesting an AGN origin. Variability is confirmed in both F105W and F160W images, but no variability was detected in 2012–2023 in the F140W image. The source is obviously pointlike after the host is subtracted and is located at the nucleus of the galaxy, suggesting probable AGN activity.
The source is identified by Rafelski et al. (2015) and has a photometric redshift of 1.887. In Figure 2, we present the NIR spectra obtained using the F115W, F150W, and F200W filters of NIRISS. Emission lines of [O ii], [O iii], and Hα are unambiguous, which securely anchors the redshift to z = 1.95, but there are no obvious signatures of AGN activity in this low-resolution spectrum.

Figure 2. JWST/NIRISS spectra of the sources shown in Figure 1. The three different wavelength regions show the F115W, F150W, and F200W filters, while the two spectra per wavelength range show extractions when the spectra are dispersed in the direction of rows or columns.
Download figure:
Standard image High-resolution imageObject 1052126—This object has a spectroscopic redshift of 3.1905 from VLT/MUSE. It is identified as a strong emitter of Lyα He ii 1640, C iv 1550, and Si iii 1883, as well as other high-ionization lines (Bacon et al. 2023), and is clearly an AGN. It is comparably bright, with mF140 = 24.1, and has varied by −0.53 and +0.50 mag from 2009 to 2012 and 2012 to 2023, respectively (brightening then dimming). The flux in the variable component alone amounts to an absolute magnitude of −21.3, corresponding approximately to the luminosity of an L⋆ galaxy.
The complex of [O iii] λ λ4959, 5007 Å and Hβ is unambiguous in the NIRISS spectrum (Figure 2) at about 2.1 μm, anchoring the redshift to z = 3.2, which is fully consistent with VLT/MUSE. Hγ emission is also clear in the F200W filter. The F150W filter shows an obvious line of [Ne iii] λ3869, but more interestingly, there is a weak line at λobs = 14400 Å. This is identified as the [Ne v] λ3426 line, which requires a source of photons with h ν > 97 eV or dense coronal gas with temperature T > 105 K. This can only be produced by an AGN. A strong Mg ii feature is also identified in the F115W filter. Hβ is broader than the [O iii] lines that are observed in the same filter, with an FWHM of ≃4600 and ≃1400 km s −1, respectively, where [O iii] is consistent with instrumental broadening but Hβ is not. Hγ is of course weaker but appears to be as broad as Hβ, and Mg ii shows a consistent FWHM. Most forbidden lines are too weak to provide reliable measurements of their velocity dispersion, but from the [O iii] lines alone we see the familiar situation where permitted lines probe gas in the broad-line regions (BLRs) but BLR densities are sufficiently high that forbidden lines are collisionally deexcited, and [O iii] emission probes only the more extended narrow line-emitting region.
3.2. Supernova Candidates
We show images of the three supernova candidates in Figure 3 and present general properties in Table 3.

Figure 3. Same as Figure 1 for the probable supernovae.
Download figure:
Standard image High-resolution imageTable 3. Same as Table 2 but for the Supernova Candidate Sources
| ID | R.A. | Decl. | Mag 2009 | Mag 2012 | Mag 2012 | Mag 2023 | Redshift | Source |
|---|---|---|---|---|---|---|---|---|
| J2000/Gaia | J2000/Gaia | F105W/F160W | F105W/F160W | F140W | F140W | |||
| 1402129 | 53.154885 | −27.793421 | ... | ... | 28.235 ± 0.042 | 26.575 ± 0.01 | JADES phot | |
| 1402146 | 53.134812 | −27.788965 | ... | ... | ≳30.0 | 27.234 ± 0.02 | ... | ... |
| 1051237 | 53.143873 | −27.793327 | 26.927 ± 0.017 | ≳30.1 | ... | ... | 6.86 | R15 |

Download table as: ASCIITypeset image
Object 1402129—This is a clear stellar transient source exploding near the edge of a disk galaxy and is clearly not associated with nuclear activity. It is identified in our later epoch of F140W imaging and has increased in brightness by almost 2 mag—a 2012 magnitude is reported in Table 3, but this corresponds to the host galaxy in a matched aperture. Despite being relatively bright, the host galaxy only has a redshift reported from JADES photometry, which confirms the galaxy at z ≃ 1.07. With an absolute magnitude of −16.9 in the rest-frame R band, the supernova could have been of any type. Since this redshift would provide a factor of only ≃2 in cosmological time dilation, we expect the supernova to have been relatively recent: the slowly evolving superluminous supernovae (SLSNe) would typically have faded by 4 mag in 1 yr, with ordinary Type Ia and core-collapse supernovae fading faster still.
1402146—This is a remarkable transient source that was identified in our second epoch F140W imaging and exploded between 2012 and 2023. No host galaxy is apparent in the HST/IR imaging, but a faint source is just visible in the ACS imaging. Of our 15 visits in the observing program, one failed because of guide-star acquisition and was repeated 1 month after the remainder of the observations. 1402146 was also visible in the repeat visit and had not moved, suggesting that it lies at cosmological distances and is not a solar system object. The source in the ACS image is not detected in redder bands and is so faint it does not enter any photometric redshift catalogs, so the distance to this source cannot be determined.
1051237—This object appears very similar to 1402146, except it had become fainter between the 2008 and 2012 images in the F105W and F160W filters, vanishing from 26.9 mag (both filters) to undetected. This source is intriguing, since it has a photometric redshift in the Rafelski et al. (2015) catalog of 6.84 and appears to be a supernova mistaken for a galaxy. 1051237 is visible in all the NIR filters of the HUDF09 campaign, and, while it is not visible in data from HUDF12, still appears in deep stacks that combine the two epochs. When the ACS optical data were obtained in 2005, the source had not yet exploded, but it had subsequently faded by the time the UVUDF (Teplitz et al. 2013) imaging was obtained. Consequently, in HST imaging only, the source is visible throughout the NIR but not in the UV/optical. In multiband photometry, it therefore appears as a z-band dropout and is assigned a best photometric redshift of ∼7. The two galactic sources that lie about 1'' to the north in the HST images have redshifts of 6, but other objects with redshifts in the range 0.2–1.1 lie within 2''.
3.3. Three Variable Sources in the Reionization Era
After cross-correlating the coordinates of our variable objects with existing redshift catalogs (Section 2), we identify three sources with significance greater than 3σ and best redshifts greater than 6. These are, naturally, much fainter than the sources identified at mid-z above. They will be studied in detail in upcoming papers (V. Cammelli et al. 2024; A. Young et al. 2024; both in preparation), and here we present the three sources at z > 6 that are detected at better than 3σ in Figure 4 and Table 4. We also extracted NIRISS spectra from the NGDEEP survey but found no convincing detections of either continuum light or emission lines in any of the three. Given the faintness of these targets and the insensitivity of low-resolution spectroscopy to weak emission lines (expected in the UV), this is not surprising.

Figure 4. Same as Figure 1 for the z = 6–7 sources.
Download figure:
Standard image High-resolution imageTable 4. General Properties of the z > 6 Variable Sources
| ID | R.A. | Decl. | Mag 2009 | Mag 2012 | Mag 2012 | Mag 2023 | Redshift | Source |
|---|---|---|---|---|---|---|---|---|
| J2000/Gaia | J2000/Gaia | F105W/F160W | F105W/F160W | F140W | F140W | |||
| 1052123 | 53.161915 | −27.786990 | 28.308 ± 0.070 | 27.996 ± 0.028 | 27.595 ± 0.024 | 27.764 ± 0.029 | JADES phot | |
| 1052156 | 53.154051 | −27.766003 | 28.391 ± 0.067 | 28.181 ± 0.034 | ≳29.9 | ≳29.9 | 6.234 | JADES spec |
| 101159 | 53.160519 | −27.785931 | 28.961 ± 0.366 | ≳30.1 | ≳29.9 | ≳29.9 | JADES phot |


Download table as: ASCIITypeset image
Object 1052123—This is our highest-significance variable source at z > 6. It is detected as variable in all three photometric bands and is visible in the pair-subtracted images of Figure 4. Its light curve is shown in Figure 5. It is pointlike and brightens between 2009 and 2012 (both F105W and F160W) by about 0.3 mag, with a very similar change in brightness detected at both wavelengths implying a constant color of the variable source. Interestingly, its F105W–F140W color is 0.42 mag, while the F140W–F160W color is 0.02 mag (both measured in 2012 epoch data). This is probably due to a Lyα break at 9400 Å, which produces a flux deficit in F105W leading to a photometric redshift of z ≃ 6.75, while the continuum slope is flat at redder wavelengths (β = −1.88 ± 0.05). The object then fades again to 2023, decreasing in brightness by 0.17 mag (4.5σ significance).

Figure 5. Light curve for object 1052123. The lower x-axis shows the year of observation, while the upper x-axis shows the time since 2008 accounting for (1 + z). The left axis shows the observed apparent magnitude, while the right axis shows the absolute magnitude for z = 6.74. Filters are shown in color.
Download figure:
Standard image High-resolution imageThe source is assigned a photometric redshift of 6.44 by Rafelski et al. (2015) and 6.74 in the JADES redshift catalog, and we lean toward the higher value because the spectral break must lie within the F105W filter. Assuming this redshift and that the entire variable component can be attributed to an AGN, it would have an equivalent absolute magnitude of −19.3 AB. This is much less luminous than the variable AGN recovered at mid-z (Section 3.1), which have MUV = −20.3 and −21.9.
The whole duration of the light curve in Figure 5 is 15 yr, which corresponds to 2 yr in the rest frame, at filters probing λrest ≃ 1300–2000 Å. These timescales exceed what is seen even for SLSNe, which are the slowest-evolving and most UV-bright supernova class known (Lunnan et al. 2018; Angus et al. 2019; Perley et al. 2020). In particular, while the peak UV luminosity is well within reach for an SLSN, the UV generally fades away on a timescale of approximately months due to cooling temperatures as the supernova expands (Yan et al. 2017). Similarly, while pair-instability supernovae are predicted to have very slow light curves due to their extremely high ejecta masses, they are also predicted to have red spectra thanks to the copious amounts of iron-peak elements produced in the explosion, which blankets the UV flux (Kasen et al. 2011; Dessart et al. 2013). We therefore favor an AGN over an extreme supernova interpretation.
Object 1052156—This object is identified as variable in the F105W and F160W filters (2009–2012) but is not found to be variable in the later epoch. The variability is clear in the pair-subtracted images, and if all the variability can be attributed to a single new source, its equivalent magnitude would be −18.5. This magnitude is also consistent with the object being a supernova, but given the change in brightness of 0.2 mag in 5 yr, it seems implausible (using the same argumentation as for 1052123). The combined significance across the two filters is only 3.5σ in this case, but even at ≈28 mag there is still not an enormous parent sample of sources, and we do not expect to find one with a magnitude difference that is 3.5σ outside its distribution from pure chance. It is therefore probable that this source is a genuine variable. This source has a spectroscopic redshift of 6.23 (Bunker et al. 2023), as well as various photometric redshift estimates consistent with this.
Object 101159—The final object, 101159, is a remarkable variable source. It is clearly identified by the image subtraction method as a pointlike variable source that was visible in 2009 but not in 2012 or 2023. It is not visible in the ACS optical imaging obtained in 2006, implying a possible high redshift. It is clearly detected in the NIRCam/F277W image from JADES, which is the deepest in the JADES survey. The source likely comprises three diffuse clumps within the 1'' region centered on the coordinates of the transient source, each of which is particularly faint, with magnitudes around ≃29 in the F277W filter. The southern region is coincident with the location of the transient, which has no entry in the JADES catalogs. JADES reports a best-fit photometric redshift for the northwestern source of z = 6.54, although the 1σ range is 3.84–8.99. The northeastern source has a photometric redshift of 5.86, consistent with the object nearest our transient source. If genuinely at z > 6, the morphology of these sources is unlike most galaxies typically identified at high redshifts, where source identification is biased toward compact galaxies. This source has unfortunately decreased in brightness since 2008. The source could be an SLSN or an AGN, but in either case it outshines the host galaxy, which is only detectable by JWST at later epochs in redder images. We favor the AGN scenario for similar reasons to object 1052123: the probability of an SLSN explosion in our volume is ∼10−4, and these transients typically exhibit red colors and are hard to detect in the rest UV. We have verified that the source is visible in a deep stack of all the JADES imaging at NIR wavelengths and invisible in a stack of the ACS optical filters, again suggesting the object lies at high z.
A note on interloping sources—We initially identified another high-significance (7σ) variable at α, δ = 53.1828095, −27.7760521, with mF140W = 28.1. This object has a photometric redshift of 6.74 in the JADES catalog but is assigned zphot ≃ 1.7 by Rafelski et al. (2015) and is clearly detected in ACS/F606W, implying that a low-z solution must be correct.
4. Discussion
4.1. Variability as a Method to Find AGN and Estimate nSMBH
We have identified several variable sources in the HUDF using photometric monitoring at three epochs: 2008, 2012, and 2023. In forthcoming papers (V. Cammelli et al. 2024, in preparation; A. Young et al. 2024, in preparation), we will present many more variable sources in the field at redshifts between 0 and 7. Here we have presented preliminary results for eight interesting targets, two of which are clear AGN at z ≃ 2–3, and three are probable supernovae that are also likely to have exploded at intermediate redshifts. We find three variable sources at redshifts greater than 6. Based upon their absolute magnitudes, which are measured at a rest wavelength of ≃1300 Å, we believe these variable sources to be AGN.
We argue that variability searches provide a valuable and efficient technique for finding AGN in deep imaging surveys. While only a fraction of AGN are detectable by variability, the advantage of monitoring is that it provides a complete, 100% multiplexed survey of everything in the field with no preselection. Furthermore, there is no additional challenge related to the different depths attainable for AGN diagnostics, as is the case for radio or X-ray surveys: if an object can be observed in imaging, it can be tested for variability.
Luminous quasars have been known at higher redshifts for some time (Fan et al. 2006; Mortlock et al. 2011; Bañados et al. 2018) and are all ≳4 mag more luminous than our sources, and potentially higher-redshift AGN have also been reported (Harikane et al. 2023; Larson et al. 2023; Maiolino et al. 2023) at luminosities closer to L⋆. However, as our survey examined only the volume of the HUDF and finds three probable AGN at 6 < z < 7, this yields a higher comoving number density of AGN than previously reported.
Our survey samples a volume of ≃10,500 comoving Mpc3 between redshifts 6 and 7, leading to a number density of nSMBH ∼ 2.9 × 10⁻⁴ cMpc−3. However, only a fraction of AGN in a given luminosity range are expected to be detected by variability. Lyu et al. (2022) have recently published a sample of confirmed AGN in the GOODS-S field, within which the HUDF is entirely contained. Thirty-one of their AGN fall in the HUDF footprint that we target and have been identified by combinations of X-ray brightness, UV-to-MIR SED properties, optical spectral features, MIR colors, radio-loudness, continuum shape, and variability. We recover eight of these 31 AGN that have redshifts between 0.6 and 3.2 (object 1052162) by photometric variability. Lyu et al. (2022) identified these AGN by MIR colors (four), X-ray luminosities (seven), radio-loudness (seven), or optical spectroscopy (one). Some are obviously identified by more than one tracer. Importantly, none of our 71 prime candidates have been reported previously by photometric variability: this includes the HST imaging used in Lyu et al. (2022), who identified three variable AGN in the HUDF area, and Cohen et al. (2006), who reported 45 further sources. We note that all this imaging is shallower and obtained at shorter wavelengths and over shorter time baselines than our HUDF reimaging campaigns and should not necessarily match NIR long-baseline studies. None of our z > 6 AGN are in the Lyu et al. catalogs, almost certainly because they are too faint to be independently verified by the above techniques at current observational depths. See V. Cammelli et al. (2024, in preparation) for a more detailed discussion. From the ratio 8/31, we derive a crude estimate of this variability completeness correction factor of 3.85. After such a completeness correction is applied, nSMBH ∼ 1.1 × 10⁻³ cMpc−3.
Next, it should be noted that our survey is only sensitive to AGN above a minimum luminosity of MUV ≃ −18.6, so this estimate is still a lower limit on the true value of nSMBH. Harikane et al. (2023) have detected AGN via the presence of broad emission lines and estimated nSMBH from z ∼ 4 to 7 by extrapolating down an assumed luminosity function to MUV ≃ −17. For a fair comparison of our results to those of Harikane et al. (2023), we carry out the same method and estimate a luminosity function (assuming L⋆ = −20 and α = −2) correction factor of ∼7, which boosts nSMBH ∼ 7.7 × 10⁻³ cMpc−3. Note that to the extent that not all AGN are detected down to MUV ≃ −17, this should still be regarded as a lower limit. In fact, at these redshifts, an empirical estimate of nSMBH can only be efficiently made by counting AGN and will include only SMBHs in a rapidly accreting state. The true comoving density would also need a final correction for the fraction of SMBHs that are currently dormant. The fact that we have no observational basis on which to estimate this final correction leads us to present all these densities as lower limits.
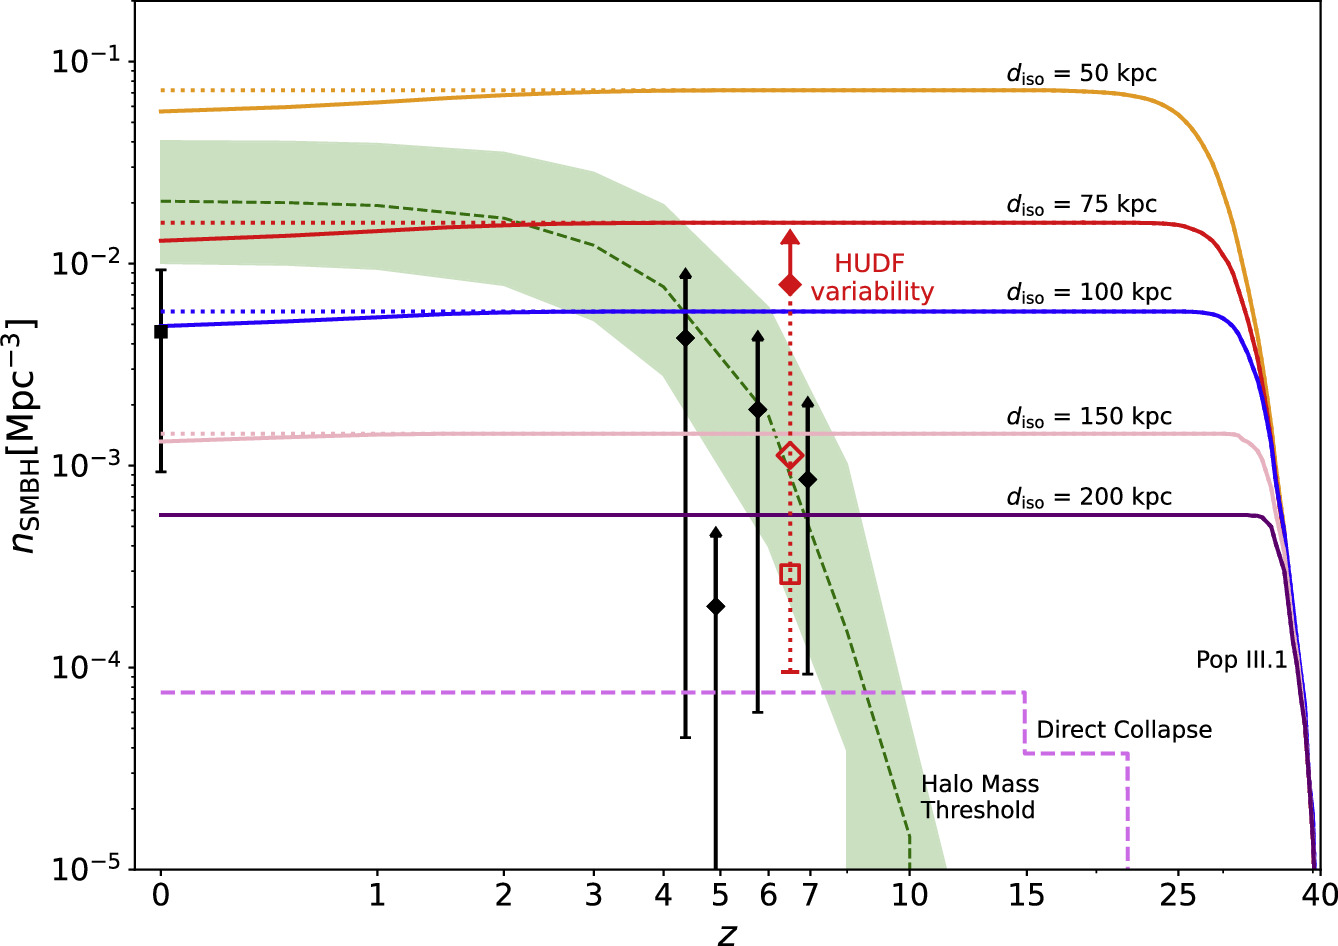
Our estimates of nSMBH at z = 6–7 in the HUDF via variability and those of Harikane et al. (2023) via the presence of broad spectral lines from z = 4 to 7 are shown in Figure 6. Here we also show a data point at z = 0, i.e., nSMBH(z = 0) ≃ 4.6 × 10⁻³ cMpc−3 with an uncertainty ranging from 10−3 to 10−2 cMpc−3 (Banik et al. 2019). This is calculated by assuming that each galaxy with luminosity greater than hosts an SMBH, with the error bar around this point assuming a range of from 0.1 to 1.0 L⋆ (see also Vika et al. 2009 for a similar estimated value of 8.79 × 10⁻³ cMpc−3). We see that our estimate of nSMBH in the HUDF is a factor of several higher than that of Harikane et al. (2023) at the equivalent redshifts but very similar to their estimate at z ∼ 4 and the local estimate at z = 0. Figure 6 also shows some predictions of theoretical models, which are discussed in the next section.


Figure 6. Cosmic evolution of SMBH abundance. The comoving number density of SMBHs, nSMBH, is plotted vs. redshift, z. The observational constraint derived by counting z = 6–7 AGN in the HUDF variability survey is shown by the red open square, and the lower bound shows the Poisson uncertainty. The red open diamond corrects for variability incompleteness, and the red filled diamond is for luminosity incompleteness (see text). Previous observational estimates at z = 0 from local galaxies (Banik et al. 2019) and at z = 4–7 from broad emission line sources (Harikane et al. 2023) are shown with the black square and diamonds, respectively. For the z ∼ 4–7 sources, we are unable to make any correction for the fraction of nonaccreting SMBHs and leave all points as lower limits. Various Pop III.1 formation models (Banik et al. 2019; Singh et al. 2023) with isolation distance parameters, diso, from 50 to 200 kpc (proper distance) are shown by the colored solid lines. At low redshifts, these decrease compared to the maximum value attained (dotted lines) due to mergers. The green dashed line shows SMBH seeding based on an HMT above a mass of 7.1 × 10¹⁰ M⊙ (Vogelsberger et al. 2014), with the shaded region illustrating a factor of 2 variation in this mass scale. The magenta dashed line shows results from a model of SMBH formation via "direct collapse" (Chon et al. 2016).
Download figure:
Standard image High-resolution image
4.2. Implications for SMBH Formation Theories
Our estimate of nSMBH(z = 6–7) ≳ 8 × 10⁻³ cMpc−3 has implications for SMBH seeding schemes and formation theories. Many implementations of SMBH seeding in cosmological simulations use simple threshold conditions. For example, a "halo mass threshold" (HMT) model was used in the Illustris and Illustris-TNG simulations (e.g., Vogelsberger et al. 2014), which seeded SMBHs in halos reaching a mass of 7.1 × 10¹⁰ M⊙. The abundance of such massive halos and associated SMBHs is shown as a function of redshift in Figure 6. By z ≃ 6.5, this model has nSMBH ∼ 10−3 cMpc−3 but with its value rising rapidly as the Universe evolves to lower redshifts. By z = 0, it has reached nSMBH ≃ 2 × 10⁻² cMpc−3, which is marginally consistent with observational estimates nSMBH(z = 0) ∼ 10−3–10−2 cMpc−3 (Vika et al. 2009; Banik et al. 2019). However, note that if there is a significant population of SMBHs that have been ejected from their host galaxies and/or have very low luminosities, then nSMBH(z = 0) may have been underestimated.
"Direct collapse" is a physical model of SMBH formation from metal-free, UV-irradiated, atomically cooled (i.e., relatively massive) halos that has been proposed as a way to form massive seeds early in the Universe (e.g., Bromm & Loeb 2003). However, simulations of this mechanism have struggled to produce sufficient numbers of SMBHs compared to the known z = 0 population. For example, Chon et al. (2016) found nSMBH ∼ 10−4 cMpc−3, while Wise et al. (2019) estimated a global nSMBH ∼ 10−7–10−6 cMpc−3.
The "Pop III.1" SMBH formation model (Banik et al. 2019; Singh et al. 2023) invokes the physical mechanism of dark matter annihilation changing the structure of primordial protostars (Spolyar et al. 2008; Natarajan et al. 2009; Rindler-Daller et al. 2015) allowing efficient accretion of the baryonic content of their minihalos to become supermassive stars with masses of ∼105 M⊙, which then collapse to SMBHs. However, only the first minihalos to form in each local region of the Universe, i.e., being pristine and undisturbed by external feedback, are Pop III.1 sources and undergo this evolution. The vast majority of minihalos are Pop III.2, i.e., irradiated by UV and/or shocked by supernova blast waves leading to enhanced hydrogen–deuterium cooling and formation of relatively low-mass stars with ∼10 M⊙ (Greif & Bromm 2006; Johnson & Bromm 2006). Banik et al. (2019) and Singh et al. (2023) have predicted the evolution of the comoving number density of SMBHs forming from Pop III.1 seeds. The main parameter of the Pop III.1 model is the "isolation distance" (diso), defined as the minimum separation distance a Pop III.1 source needs to have from already formed sources, with this expected to be set by the physical mechanism of radiative feedback. To reproduce the known population of low-z SMBHs with nSMBH(z = 0) ∼ 5 × 10⁻³ cMpc−3 requires diso ≃ 100 kpc (proper distance), i.e., ∼3 cMpc at the typical epoch of formation at z ∼ 30. These models predict that nSMBH is approximately constant with redshift from z ∼ 25 down to z = 0, with only modest decreases due to mergers (see Figure 6).
The HUDF variability estimate of nSMBH(z = 6–7) ≳ 8 × 10⁻³ cMpc−3 places constraints on diso to be ≲100 kpc. For HMT models, it requires the HMT for SMBH formation to be ≲3 × 10¹⁰ M⊙. However, such models begin to have more severe tension by having significantly greater abundance than the z = 0 estimate of nSMBH. Finally, the HUDF variability estimate of nSMBH is about 100× greater than the direct-collapse prediction of Chon et al. (2016) and at least 104× greater than that of Wise et al. (2019).
Another test of the Pop III.1 model that can be made from our detected AGN is to examine the minimum separation distance between AGN. Note that the size of the field of view of the HUDF at z ∼ 6 is about 5.5 cMpc. The closest pair of high-z AGN is sources 101159 and 1052123. The former has a larger uncertainty in its redshift. If these sources are at the same redshift of z ≃ 6.7, then their plane-of-sky separation corresponds to about 0.25 cMpc. Thus, we see that the Pop III.1 model with diso ≃ 100 kpc (proper), corresponding to a comoving separation of about 3 cMpc (and for negligible relative motion by z ∼ 7), implies that there must be a redshift difference of Δz ≳ 0.01 between these AGN. Future spectroscopic measurements of the redshifts of these sources can test this prediction. Similarly, another prediction of the Pop III.1 model is that all these high-z AGN are powered by single SMBHs, with binary AGN only emerging at lower redshifts (J. Singh et al. 2024, in preparation).
4.3. Future Prospects for Variability Searches
It is clear from the above analysis that larger samples of AGN at high z are required to reduce the statistical (i.e., Poisson) and systematic uncertainties in the estimates of nSMBH. JWST is required to push to detection of fainter AGN via variability, requiring an investment similar to that outlined in Jha et al. (2024). However, it will take years to establish monitoring campaigns that span significant time baselines, especially when accounting for the factor (1 + z) in cosmological time dilation. In contrast, HST's legacy of deep NIR imaging already stretches back ≃15 yr, providing an excellent baseline for monitoring. The deeper IR regions of the CANDELS fields (Grogin et al. 2011; Koekemoer et al. 2011) of strong gravitational lensing clusters Lotz et al. (2017) would be the most appropriate next targets to carry out high-z AGN variability searches to build more stringent constraints on theoretical models of SMBH formation.
Acknowledgments
We thank Yuichi Harikane, Marta Volonteri, and Naoki Yoshida for helpful discussions and the constructive and thoughtful report from the anonymous referee that has improved the content of the manuscript. M.H. acknowledges the support of the Swedish Research Council, Vetenskapsrådet, and is Fellow of the Knut and Alice Wallenberg Foundation. J.C.T. acknowledges support from ERC Advanced grant 788829 (MSTAR). A.Y. is funded by the Swedish National Space Agency, SNSA. R.L. is supported by the European Research Council (ERC) under the European Union's Horizon Europe research and innovation program (grant agreement No. 10104229—TransPIre). We thank the staff in The Doors public house for service that germinated the ideas that led to this project. All the HST data used in this Letter can be found in MAST:10.17909/7s5v-gz68.
Facilities: HST - Hubble Space Telescope satellite (WFC3), JWST - James Webb Space Telescope (NIRISS).
Footnotes
- *
This research is based on observations made with the NASA/ESA Hubble Space Telescope obtained from the Space Telescope Science Institute, which is operated by the Association of Universities for Research in Astronomy, Inc., under NASA contract NAS 526555. These observations are associated with programs 11563, 12498, and 17073.