


Abstract
The tip of the red giant branch (TRGB) is an important standard candle for determining luminosity distances. Although several 105 small-amplitude red giant stars (SARGs) have been discovered, variability was previously considered irrelevant for the TRGB as a standard candle. Here, we show that all stars near the TRGB are SARGs that follow several period–luminosity sequences, of which sequence A is younger than sequence B as predicted by stellar evolution. We measure apparent TRGB magnitudes, mTRGB, in the Large Magellanic Cloud (LMC) using Sobel filters applied to photometry from the Optical Gravitational Lensing Experiment and the ESA Gaia mission, and we identify several weaknesses in a recent LMC-based TRGB calibration used to measure the Hubble constant. We consider four samples: all red giants (RGs), SARGs, and sequences A and B. The B sequence is best suited for measuring distances to old RG populations, with MF814W,0 = −4.025 ± 0.014(stat.) ± 0.033(syst.) mag assuming the LMC's geometric distance. Control of systematics is demonstrated using detailed simulations. Population diversity affects mTRGB at a level exceeding the stated precision: the SARG and A-sequence samples yield 0.039 and 0.085 mag fainter (at 5σ significance) mTRGB values, respectively. Ensuring equivalent RG populations is crucial to measuring accurate TRGB distances. Additionally, luminosity function smoothing (∼0.02 mag) and edge detection response weighting (as much as −0.06 mag) can further bias TRGB measurements, with the latter introducing a tip-contrast relation. We are optimistic that variable RGs will enable further improvements to the TRGB as a standard candle.
Export citation and abstract BibTeX RIS

Original content from this work may be used under the terms of the Creative Commons Attribution 4.0 licence. Any further distribution of this work must maintain attribution to the author(s) and the title of the work, journal citation and DOI.
1. Introduction
The extragalactic distance ladder (DL) measures the local Universe expansion rate, or Hubble's constant, H0, using two types of standard candles. In the so-called Hubble flow, Type Ia supernovae (SNe Ia) provide precise relative luminosity distances that allow charting cosmic expansion. SNe Ia require external luminosity calibration provided by stellar standard candles that in turn are calibrated using geometric distances. The currently most precise stellar standard candles are classical Cepheids (Riess et al. 2022b; Cruz Reyes & Anderson 2023), followed by the tip of the red giant branch (TRGB; Freedman 2021; Scolnic et al. 2023). It has been recently established that H0 is systematically faster than predicted by the best-fit parameters of the ΛCDM cosmological model adjusted to observations of the early Universe by the ESA mission Planck (Planck Collaboration et al. 2020; Di Valentino et al. 2021; Riess et al. 2022b). The statistical significance of this Hubble tension currently exceeds 5σ (Riess et al. 2022b, 2022a; Murakami et al. 2023) when SNe Ia are calibrated using Cepheids. A TRGB-based DL calibration by the Carnegie Chicago Hubble Program (CCHP; Freedman et al. 2019; Freedman 2021) has yielded a lower H0, compatible with both Cepheids and Planck, inspiring further improvements to the TRGB calibration (Jang et al. 2021; Anand et al. 2022; Li et al. 2022, 2023b; Scolnic et al. 2023; Wu et al. 2023). However, the CCHP's most recent TRGB calibration in the Large Magellanic Cloud (LMC) remains at odds with these improvements Hoyt (2023, hereafter H23).
The TRGB is an empirical feature of color–magnitude diagrams (CMDs) of old stellar populations and highly useful for determining distances (Lee et al. 1993). Astrophysically, it is ascribed to the luminosity where first-ascent low-mass (Kippenhahn et al. 2013; M ≲ 2.2 M⊙) red giant (RG) stars undergo the helium flash (Renzini et al. 1992), and stellar models predict a small dependence on age and chemical composition (Salaris & Girardi 2005). Empirically, the TRGB magnitude is determined using edge detection techniques (Lee et al. 1993; Sakai et al. 1996) or maximum-likelihood analyses (Méndez et al. 2002), preferably in the I band, where the color dependence is minimal. Two main approaches of correcting age or metallicity effects are used: the CCHP considers the I-band luminosity function (LF) to be insensitive to metallicity (Madore et al. 2018) and asserts that the blue part of the RGB select only the oldest stars (Hatt et al. 2017; Freedman et al. 2019), and the Extragalactic Distance Database (EDD) team uses dereddened color to explicitly correct metallicity differences (Rizzi et al. 2007; Anand et al. 2021). Both calibrations agree at V − I = 1.3 and differ by ∼0.10 mag at V − I = 1.8.
Conceptually, the TRGB distance method compares the inflection points of unidimensional LFs composed of generally different (and possibly diverse) RG populations. The ability to individually distinguish the desired old and metal-poor RG stars from other stars of similar color and magnitude, such as asymptotic giant branch (AGB) stars, would improve TRGB distance accuracy.
RG variability has a long history (Stebbins & Huffer 1930; Fox 1982; Edmonds & Gilliland 1996), and wide-spread variability near the TRGB was noted two decades ago (Eyer 2002; Ita et al. 2002). Tens of thousands of giants in the Magellanic Clouds follow multiple period–luminosity (PL) sequences labeled A', A, B, C', etc. (Wood et al. 1999; Soszyński et al. 2004), and several sequences exhibit clear TRGB features (Kiss & Bedding 2003). Following (Wray et al. 2004), we refer to the small-amplitude RG stars with periods of weeks to months as small-amplitude red giant stars (SARGs). Although SARGs have been used to investigate the RG populations and 3D structure of the Magellanic Clouds (Kiss & Bedding 2004; Lah et al. 2005), the variability of RG stars was not previously considered for measuring distances using the TRGB method.
Here, we investigate LMC RG star variability, aiming to improve the understanding of RG diversity and, in turn, to improve TRGB calibration and distances. Section 2 describes the observational data sets used, Section 3 shows that indeed all stars near the RG tip are measurably variable, and Section 4 presents our LMC-based measurements of mTRGB and calibration of MTRGB. Section 5 summarizes our results and discusses the implications of these result for TRGB distances and H0. The Appendix provides additional information on sample selection (Appendix A), presents extensive simulations used to investigate TRGB systematics (Appendix B), and critically compares our results with H23 (Appendix C).
2. Observational Data Sets Used
2.1. Photometry
We collected Optical Gravitational Lensing Experiment (OGLE) III V- and I-band photometry (mI,OGLE, mV,OGLE) from photometric maps (Udalski et al. 2008) for Allstars and computed mean magnitudes from long-period variable (LPV) time series (Soszyński et al. 2009) for SARGs and the A and B sequences; see Section 2.3 for the sample definitions. The mean uncertainty for Allstars was 0.009 and 0.001 mag for the time averages. Color excess uncertainties dominate the total photometric uncertainty.
Additionally, we collected the following from the Gaia DR3 (Gaia Collaboration et al. 2023b) table gaiadr3.source: G-band magnitudes (phot_g_mean_mag), integrated GRP spectrophotometry (phot_rp_mean_mag), and synthetic photometry from the Gaia Synthetic Photometry Catalogue (GSPC; Gaia Collaboration et al. 2023a) in the Johnson V band (mV,syn, v_jkc_mag), Cousins Ic band (mI,syn, i_jkc_mag), and Hubble Space Telescope (HST) Advanced Camera for Surveys (ACS) WFC F814W (mF814W,syn, f814w_acswfc_mag).
As shown in the Gaia DR3 documentation (Riello et al. 2021; Gaia Collaboration et al. 2023a), GSPC photometry accurately reproduces photometric standards in the Landolt and Stetson collections (JKC) and HST photometry of Milky Way globular clusters from the HUGS project (Nardiello et al. 2018) to within a couple of millimagnitudes in the magnitude range of interest (13 mag < G < 17 mag). We apply zero-point corrections from Table 2 and G.2 in Gaia Collaboration et al. (2023a), ΔmI,syn = 0.002 ± 0.014 and ΔmF814W,syn = 0.001 ± 0.017 mag, where Δ = mstd − msynth is the offset between the reference system and the synthetic photometry. Zero-point uncertainties were added in quadrature to photometric uncertainties. This may slightly overestimate mF814W,syn uncertainties, since the zero-points for F814W magnitudes were estimated in globular clusters that are more crowded than the LMC.
Blended stars and foreground objects were removed using a series of astrometric and photometric quality cuts detailed in Appendix A. Stars with ϖ/σϖ
> 5 and ϖ − σϖ
> 1/50,000 kpc or proper motions significantly different from the LMC's ( +
+  ; Gaia Collaboration et al. 2023b) were considered foreground stars if RUWE < 1.4. Blending indicators β < 0.99 (see Section 9.3 in Riello et al. 2021), ipd_frac_multi_peak < 7, ipd_frac_odd_win < 7, and C* < 1σ, as well as RUWE < 1.4, were used following Section 9.3 in Riello et al. (2021).
Direct photometric comparisons reveal excellent agreement between mI,OGLE and mI,syn (mean and dispersion of −0.011 ± 0.023 mag for 145,937 RGs, −0.005 ± 0.026 mag for 30,315 SARGs, and −0.002 ± 0.035 mag for 15,965 stars close to the TRGB), and our extinction-corrected TRGB measurements in these passbands also agree to within 1–4 mmag. mI,OGLE and mF814W,syn also agree extremely well with mean and dispersion 0.002 ± 0.028 mag for Allstars and 0.008 ± 0.026 mag for SARGs.
2.2. Reddening and Extinction
We corrected reddening using color excess values, E(V − I), based on LMC red clump stars (Skowron et al. 2021). Individual uncertainties on E(V − I) and the systematic reddening error of 0.014 mag are included in the analysis (Section 4.2). Removing stars with E(V − I) > 0.2 limits the effect of reddening law uncertainties to ≲0.02 mag.
We computed reddening coefficients, RI
, for each passband using pysynphot (STScI Development Team 2013) for an RV
= 3.3 recalibrated Fitzpatrick reddening law (Fitzpatrick 1999; Schlafly & Finkbeiner 2011) and a star near the TRGB following Anderson (2022) and obtained  , and RGaia,G
= 1.852, consistent with RI
∼ 1.5 used to construct the reddening maps (Skowron et al. 2021). Analogously, we determine
, and RGaia,G
= 1.852, consistent with RI
∼ 1.5 used to construct the reddening maps (Skowron et al. 2021). Analogously, we determine  to compute reddening-free Wesenheit magnitudes
  for fitting and inspecting SARG PL sequences.
2.3. Sample Selections
We selected four samples for TRGB measurements and refer to them as Allstars, SARGs, and the A and B sequences. All samples were cleaned using objective photometric and astrometric data quality indicators; see Appendix A. The Allstars sample consists of all stars from the OGLE-III LMC photometric maps (Udalski et al. 2008). Gaia source_ids were cross-matched using the positions from OGLE; see Appendix A for details. We also considered sample selections following H23 in Appendix C.
The SARG sample is a subset of Allstars and consists of 40,185 SARGs from the OGLE-III catalog of variable stars (Soszyński et al. 2009) cross-matched with Gaia. The A- and B-sequence samples are distinct subsets of SARGs selected in two steps. Each was first crudely selected by manually defining a region around each sequence in the reddening-free (Wesenheit) magnitudes, WVI
= I − 1.457 · (V − I), versus  diagram. In turn, we fitted quadratic P–W relations to the initial selections and applied a 3σ outlier rejection to obtain
  for the A sequence and WVI
= 12.290 − 5.096
for the A sequence and WVI
= 12.290 − 5.096  for the B sequence. All periods discussed refer to the dominant period, P1, despite SARGs being multimodal pulsating stars. The adopted pivot periods are close to the sample medians.
3. All Stars at the TRGB Are Variable
Figure 1 shows for the first time that virtually all LMC stars at the TRGB are SARGs, and that the fraction of SARGs decreases toward fainter magnitudes. This is potentially significant, as stars near the TRGB are typically regarded as nonvariable (e.g., Madore et al. 2023). Given small amplitudes of typically 0.01–0.04 mag and long-period multiperiodicity, this variability is mostly negligible for distance measurements. However, we show below that SARG variability offers useful new insights into the populations of RG stars near the tip.

Figure 1. Virtually all stars at the TRGB are variable. Left: coarsely binned CMD indicating the fraction of SARGs to all stars using a color map indicated at the top. Blue contours highlight the RGB's location by delineating the 70% (thicker) and 20% (thinner) contours of all stars in the OGLE-III LMC photometric map (Udalski et al. 2008; Soszyński et al. 2009). The TRGB's location is shown as a dotted line. The fraction of variable stars increases upward toward the TRGB, reaching nearly 100% at the tip. Right: LFs of Allstars (black), SARGs (orange), and their complement (gray).
Download figure:
Standard image High-resolution image3.1. Understanding SARGs
SARGs are high-luminosity RGs that maintain self-excited multimode nonradial pulsations of low longitudinal degree and low radial order n. The pulsational nature has been established based on observed period ratios (Wood 2015) and nonlinear nonadiabatic pulsation models (Takayama et al. 2013; Trabucchi et al. 2017; Xiong et al. 2018; McDonald & Trabucchi 2019). SARG pulsations are higher-overtone, lower-amplitude analogs to semiregular and Mira variables (Xiong et al. 2018; Trabucchi et al. 2021) and can be distinguished from stochastic solar-like oscillations seen in lower-luminosity RGs in the period–amplitude plane (Tabur et al. 2010; Bányai et al. 2013; Auge et al. 2020). PL sequences defined by the dominant pulsation mode P1 represent an evolutionary timeline, whereby stars first evolve to higher luminosity along PL sequence A until the mode of the next lower radial order becomes dominant. Once the dominant pulsation mode changes, the star continues its ascent to higher luminosity on the next longer-period (lower-n) sequence B (Wood 2015; Trabucchi et al. 2019).
3.2. Dissecting Population Diversity Using RG Variability
The evolutionary scenario suggests that the older and younger RG populations can be directly separated via their PL sequences. This would be very useful because PL sequences employ properties observable in the individual stars of interest. We investigated this possibility using stellar ages determined by spectroscopy from the Apache Point Observatory Galaxy Evolution Experiment (APOGEE) data release 17 (Povick et al. 2023).
Figure 2 shows that the B sequence indeed contains the older (median age 6.5 Gyr), lower-metallicity RG stars near the tip. Thus, B-sequence stars correspond most closely to the astrophysically motivated target RG population near the He flash. A-sequence stars are systematically younger (3.8 Gyr) and exhibit a trend of increasing stellar age with period. Additionally, A-sequence stars are more metal-rich and of higher mass than B-sequence stars. This empirically confirms the theoretical evolutionary scenario of the LPV PL sequences proposed by Wood (2015). We note that the ratio of stars on the two sequences is relatively even across the OGLE-III LMC footprint, with mean NA/NB = 2.26 ± 0.03; see Appendix C. Hence, the ratio of older to younger stars appears mostly constant within this area, although age and metallicity gradients are known at larger angular separations (Majewski et al. 2009; Muñoz et al. 2023). Figure 3 shows that the A- and B-sequence samples fully overlap in the CMD, so that variability information is required to separate the samples. Furthermore, we note that all SARG PL sequences are shifted to shorter periods in the Small Magellanic Cloud (SMC; Soszyński et al. 2011), which indicates the lower metallicity of RGs in the SMC (Koblischke & Anderson 2024, in preparation).
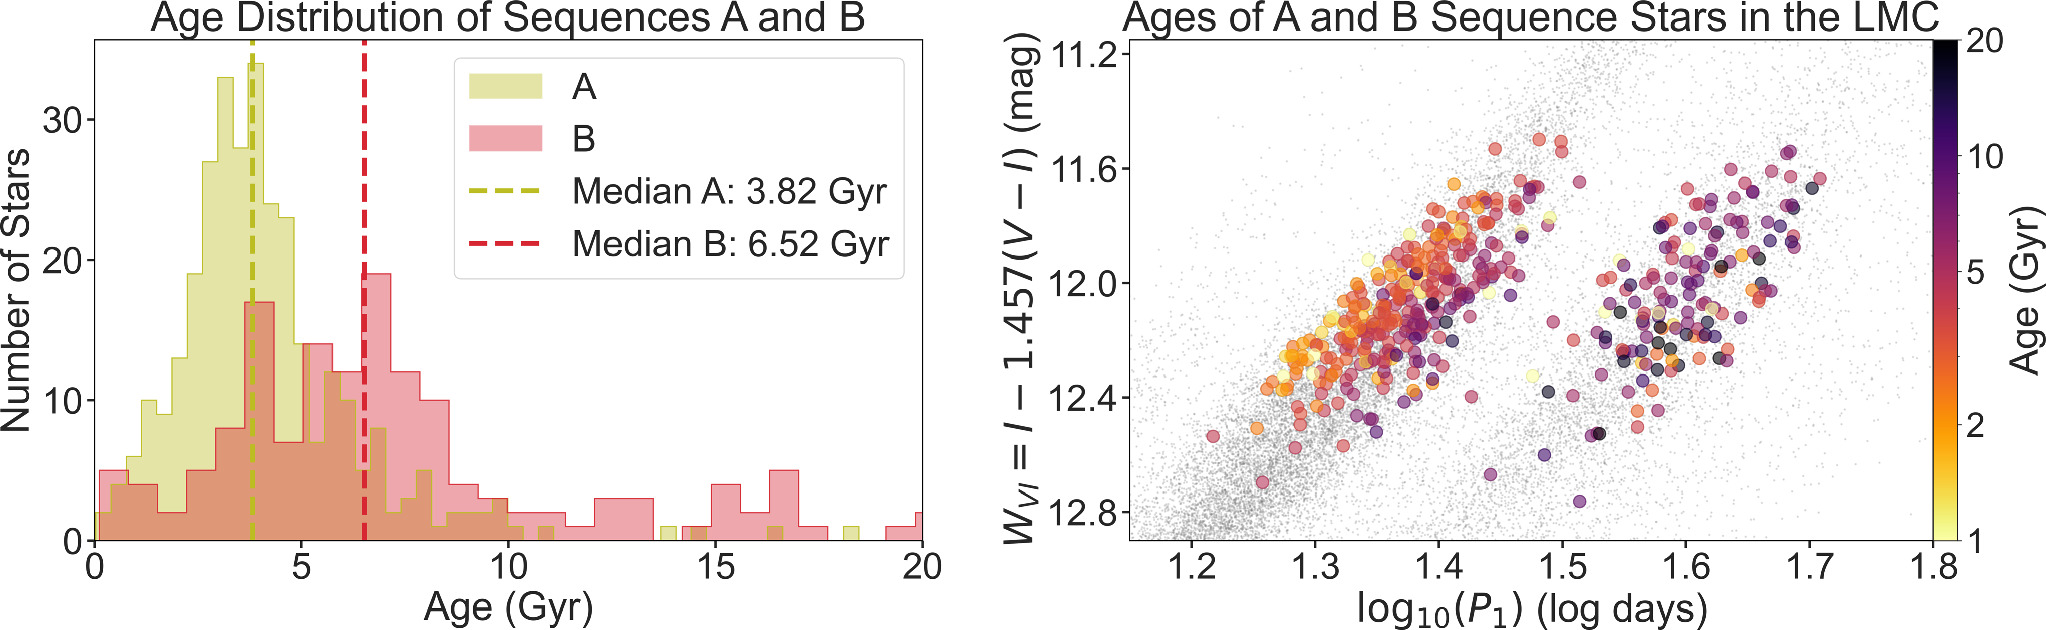
Figure 2. Ages of SARGs from Povick et al. (2023), based on APOGEE near-infrared spectra. Left: histogram of stellar ages on SARG sequences A and B. Sequence B is significantly older than sequence A, as well as less metallic (not shown). The ages of the oldest stars are particularly uncertain. Right: period–Wesenheit relations of OGLE-III SARGs near sequences A and B with ages color-coded. Sequence A exhibits significant age differences from its short-period boundary to its long-period boundary, consistent with an evolutionary sequence. Stars on sequence B are significantly older.
Download figure:
Standard image High-resolution image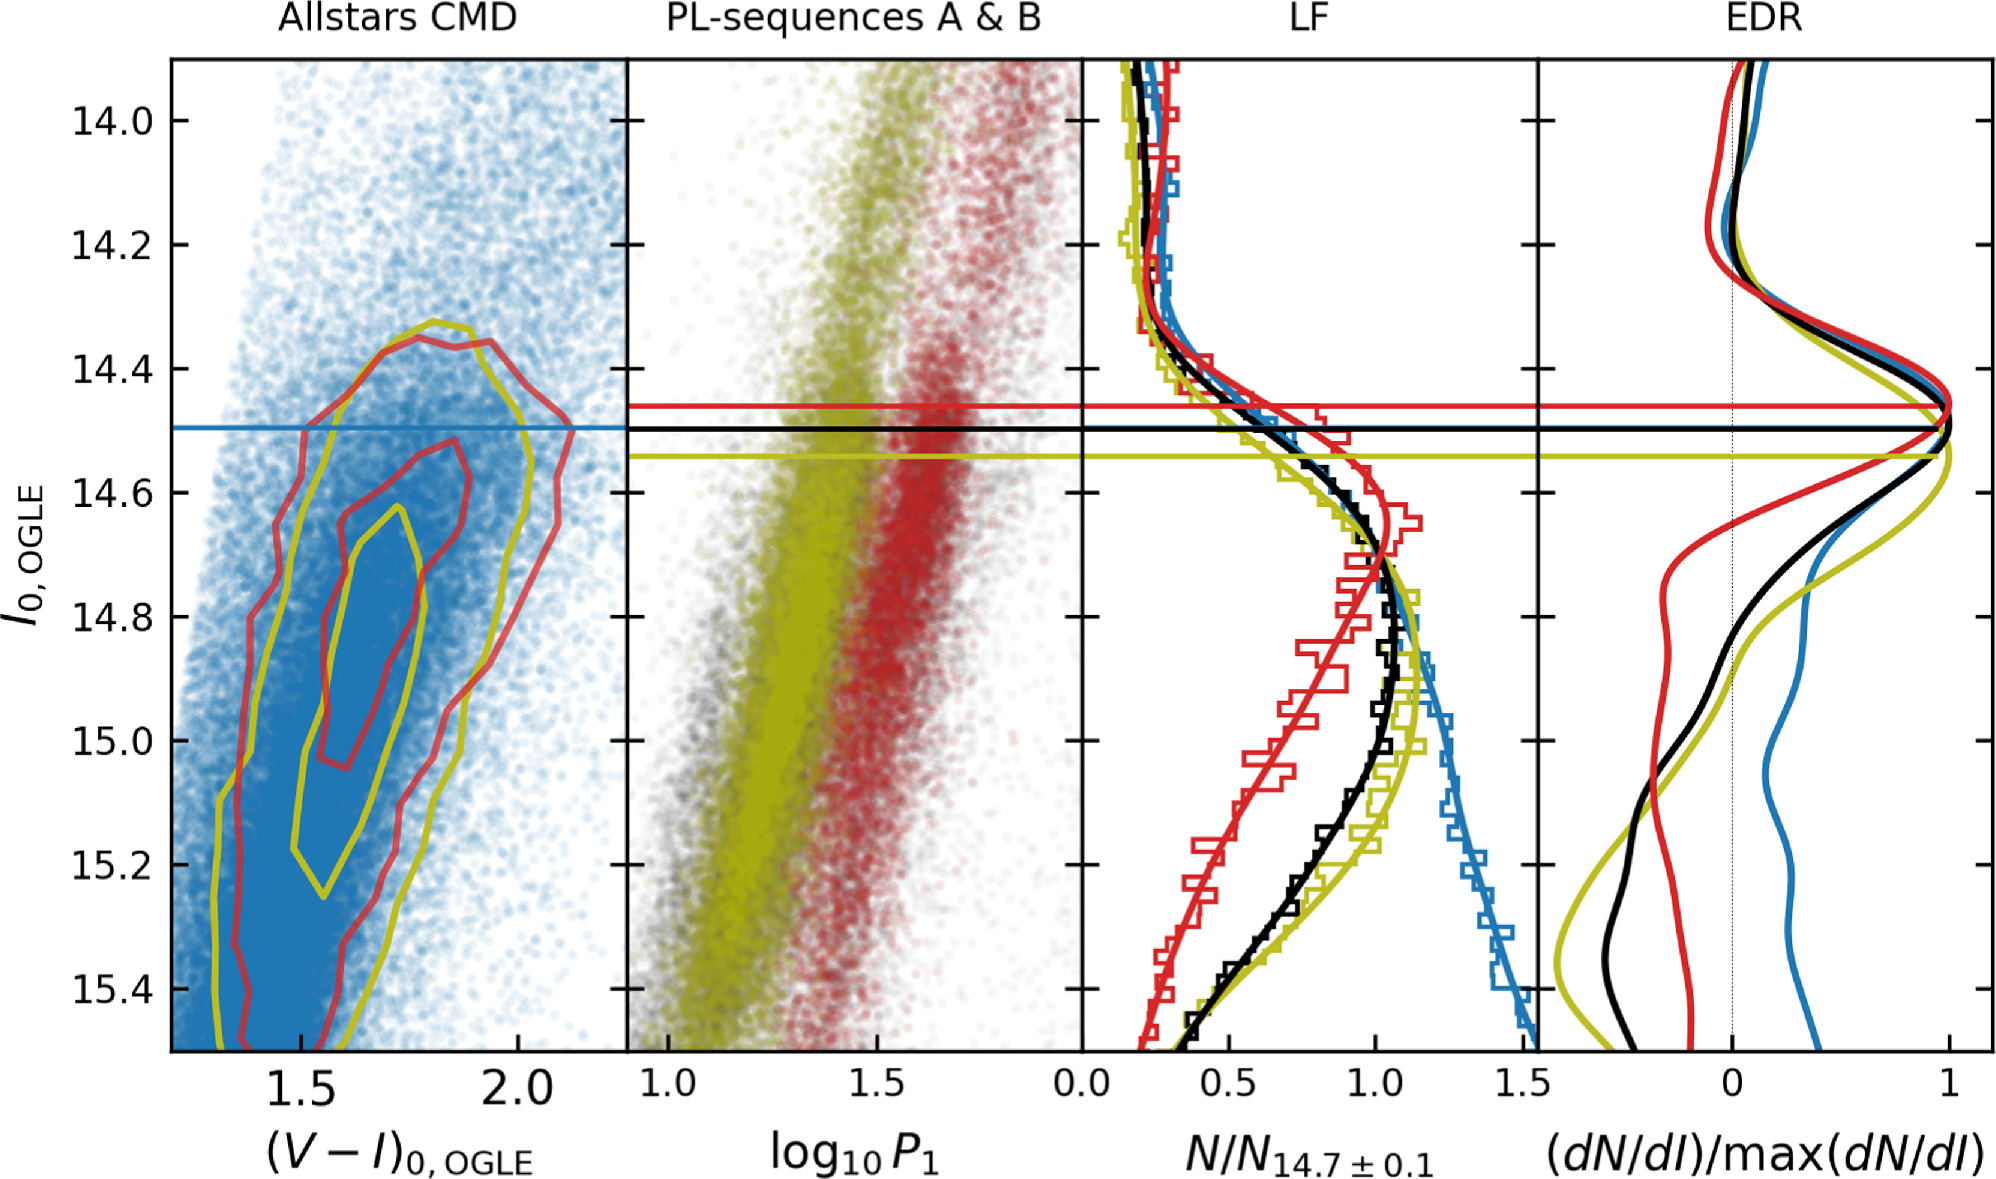
Figure 3. Illustrations of LFs and samples. Horizontal lines show mI,OGLE for the four samples, Allstars (blue), SARGs (black), A sequence (yellow), and B sequence (red). From left to right: CMD of the Allstars sample (see Table 3) with contours (95th and 99th percentiles) of the A and B sequences overlaid; OGLE-III SARGs (black points) in the vicinity of the A and B PL sequences shown as yellow and red points; binned and smoothed LFs (here σs = 0.15 mag) normalized to the number of stars within 0.1 mag of mI,OGLE = 14.7 mag; and Sobel filter response curves normalized to peak height. Variability information is required to distinguish the A and B sequences from other RGs and SARGs, since the samples fully overlap in color–magnitude space.
Download figure:
Standard image High-resolution image3.3. On the Applicability of Geometric Corrections to LMC RG Stars
Geometric corrections are commonly applied to stellar populations in the LMC. For example, Pietrzyński et al. (2019) provided a geometric model based on detached eclipsing binaries, Cusano et al. (2021) based on RR Lyrae stars, and Choi et al. (2018) using red clump stars from the Survey of the MAgellanic Stellar History (Nidever et al. 2021). Previously, the spatial distribution of RG stars in the LMC has been reported to resemble a classical halo (Majewski et al. 2009). In the context of TRGB measurements, H23 discussed the LMC's geometry at length and applied a tailored correction.
An important validation of the applicability of geometric corrections to classical Cepheids is that they reduce the dispersion of the observed Leavitt laws introduced by the inclination along the line of sight (e.g., Breuval et al. 2022; Bhuyan et al. 2024). In analogy to this, we investigated the effect of different geometric corrections on the PL scatter of the A- and B-sequence samples. Using the reddening-free P–W sequence fits to the A- and B-sequence samples, all geometric corrections reported in the literature increase the rms of the P–W sequence residuals. Specifically, geometric corrections from the literature increase the rms from originally 0.148/0.202 mag (A-/B-sequence) to the following values: 0.153/0.207 mag (Pietrzyński et al. 2019), 0.156/0.209 mag (Cusano et al. 2021), and 0.158/0.211 mag (H23). Hence, the dispersions of the A- and B-sequence P–W relations do not indicate a need for applying geometric corrections to the RG stars inside the entire OGLE-III footprint, although they also do not strongly rule them out. While we do not apply any geometric corrections to our samples, we note that this has a negligible (<0.005 mag) effect on our results that are based on the full OGLE-III footprint.
4. Calibrating the TRGB in the LMC Using SARGs
4.1. Tip Measurement Methodology
Following the CCHP approach, we measured mTRGB as the inflection point of smoothed and binned (bin size 0.002 mag) LFs using a [−1, 0, 1] Sobel filter (Hatt et al. 2017). Five sets of photometric measurements were considered, one from OGLE and four from Gaia DR3 (Section 2.1). Smoothing was applied using a Gaussian-windowed LOcal regrESSion (GLOESS) algorithm (Persson et al. 2004) as parameterized by σs to reduce noise (Sakai et al. 1996) at the penalty of introducing correlation among magnitude bins. Although smoothing introduces possible bias (Cioni et al. 2000; Hatt et al. 2017), this is a standard practice. In SN Ia galaxies, the optimal value of σs is determined using artificial star tests performed on the observed frames (Hatt et al. 2017). However, this approach cannot be applied to OGLE and Gaia photometric catalogs. To remedy this situation, we specifically considered the effects of smoothing as a systematic uncertainty by computing mTRGB for a large range of σs values and adopting an objective criterion for selecting the acceptable range (see below).
Table 1 details the determination of statistical and systematic uncertainties. For each value of σs , the statistical uncertainty σTRGB was determined using 1000 Monte Carlo (MC) resamples, whereby stellar magnitudes were randomly offset according to their total photometric uncertainties, σphot, that combine in quadrature the uncertainties on mean magnitudes, E(V − I) (generally dominant), and the dispersion of the Gaia spectrophotometric standardization; see Section 2.1. The average σphot = 0.088 mag is dominated by the color excess uncertainty. Although bootstrapping would yield smaller dispersion (by approximately two-thirds), we prefer MC resampling because it allows us to consider individual photometric and extinction uncertainties.
Table 1. Overview of Uncertainties and Their Determination
| Uncertainty | Includes/Based on | ||
| Statistical | |||
| σphot | Average: 0.088 mag. Quadratic sum of | ||
| individual photometric uncertainties (Udalski et al. 2008; Soszyński et al. 2009; Gaia Collaboration et al. 2023a), | |||
| RI × σEVI (dominates σphot), where σEVI is mean of σ1, σ2 from Skowron et al. (2021) | |||
| Gaia GSPC: standardization uncertainties from Gaia Collaboration et al. (2023a) | |||
| σMC | Dispersion of 1000 MC resamples per σs value | ||
| σTRGB | Reported in Table 2 | ||
| Sums quadratically across σs range, where ∣dmI /d σs ∣ ≤ 0.1: | |||
| median σMC, | |||
| standard deviation of mTRGB values, | |||
| difference between mean and median mTRGB | |||
| Systematic | mTRGB | MTRGB | |
| Bin size and phase | Variations | 0.001 mag | 0.001 mag |
| E(V − I) | Systematic uncertainty from Skowron et al. (2021) | 0.014 mag | 0.014 mag |
| Method bias | SARG sample (Appendix B) | 0.009 mag | 0.009 mag |
| Allstars sample (Appendix B) | 0.013 mag | 0.013 mag | |
| OGLE-III zero-point | From Udalski et al. (2008) | ⋯ | 0.010 mag† |
| LMC geometry | Impact of corrections on mTRGB | 0.005 mag | 0.005 mag |
| LMC distance | Total uncertainty from Pietrzyński et al. (2019) | ⋯ | 0.027 mag‡ |
Note. σphot differs for every star and is dominated by the uncertainties of the reddening correction. σMC is determined per smoothing value (σs ) via MC resampling. σTRGB is the final statistical uncertainty reported for mTRGB. Systematic uncertainties are reported separately if not already included in σphot. †: applies only to MI,OGLE. ‡: applies only to absolute magnitudes. Effects of population diversity are not listed here, since they depend on many factors, including observer choices. Studies aiming to measure TRGB distances should carefully consider their possible impact, which can be on the order of 0.04 mag, the difference between the B sequence and SARGs.
Download table as: ASCIITypeset image
We calculated the median mI together with the standard deviation for each computed value of σs . The final value of mTRGB for a given stellar sample and photometric data is calculated from the lowest continuous range of σs values, where ∣dmTRGB/d σs ∣ ≤ 0.1, that is, where mTRGB is insensitive to the choice of σs . Specifically, we adopted the median mTRGB over this σs range as the final center value result for a given stellar sample and photometric data set. As Figure 4 shows, the smallest σs value is close to σphot. Extending the range to higher σs values is acceptable when the result is not altered by the smoothing, and our automated approach thus allows us to benefit from the enhanced precision afforded by higher σs (Hatt et al. 2017) while avoiding bias. For a given sample, the total uncertainty on mTRGB, σTRGB, sums in quadrature the median MC error, the dispersion of mTRGB, and the dispersion of the difference between mean and median mTRGB in the stable σs range.

Figure 4. Dependence of mI on σs . Error bars are plotted for the Allstars, SARG, and A- and B-sequence samples across the range of σs values deemed stable, which is narrow for Allstars and wide for SARGs. Results from Table 2 are shown as large error bars on the right.
Download figure:
Standard image High-resolution imageWeighting schemes commonly applied to the edge detection responses (EDRs) produced by the Sobel filter are discussed in detail in Appendix B.1, where we show using simulations that EDR weighting biases mTRGB. Depending on the LF shape and the type of EDR weighting introduced, bias of up to −0.02 mag (signal-to-noise ratio, S/N, weighting) and −0.07 mag (Poisson weighting) can be incurred. Furthermore, we show that this weighting bias explains the empirically determined tip-contrast relations (TCRs) reported based on weighted EDR TRGB magnitudes (Li et al. 2023b; Scolnic et al. 2023; Wu et al. 2023). Since unweighted EDRs yield virtually unbiased results (less than 0.005 mag for the B sequence, 0.010 mag for SARGs), we prefer the simpler unweighted EDR. However, we caution that comparing our LMC calibration to TRGB magnitudes measured using weighted EDRs must be corrected for these systematic differences.
The systematic uncertainty due to bin size and phase is 0.001 mag. Additional systematic uncertainties were assessed using extensive simulations presented in Appendix B.
4.2. TRGB Apparent Magnitudes and Uncertainties
Figure 4 shows the values of mTRGB obtained for the four stellar samples using OGLE I-band photometry over a large range of σs values, and Table 2 tabulates the results for all samples and photometric data sets. Unsurprisingly, we find significant correlation between mTRGB and σs . Surprisingly, however, this correlation depends strongly on LF shape: the SARG and A-sequence samples exhibit only weak dependence on σs , followed by the B sequence. Smoothing bias is strongest for the Allstars sample, for which only a small range of σs is acceptable according to our criterion. The appropriate ranges for SARGs and Allstars are 0.07 ≤ σs ≤ 0.36 and 0.10 ≤ σs ≤ 0.15, respectively; see Figure 4. The total systematic uncertainty on mTRGB is 0.017 and 0.019 mag for the SARGs and Allstars samples, respectively (see Table 1).
Table 2. TRGB Apparent Magnitudes in the LMC, Corrected for Extinction
| 〈(V − I)0〉 | IOGLE,0 | Isyn,0 | F814Wsyn,0 | GRP,0 | G0 | |
|---|---|---|---|---|---|---|
| Sample | (mag) | (mag) | (mag) | (mag) | (mag) | (mag) |
| SARGs | 1.82 ± 0.19 | 14.501 ± 0.010 | 14.497 ± 0.011 | 14.491 ± 0.010 | 14.640 ± 0.009 | 15.621 ± 0.015 |
| Allstars | 1.78 ± 0.21 | 14.495 ± 0.021 | 14.478 ± 0.029 | 14.473 ± 0.027 | 14.635 ± 0.024 | 15.618 ± 0.014 |
| Allstars † | 1.76 ± 0.11 | 14.527 ± 0.027 | 14.506 ± 0.035 | 14.499 ± 0.032 | 14.648 ± 0.039 | 15.626 ± 0.036 |
| A sequence | 1.79 ± 0.15 | 14.545 ± 0.013 | 14.543 ± 0.012 | 14.537 ± 0.012 | 14.690 ± 0.009 | 15.655 ± 0.016 |
| B sequence | 1.82 ± 0.19 | 14.459 ± 0.014 | 14.457 ± 0.015 | 14.452 ± 0.013 | 14.607 ± 0.013 | 15.566 ± 0.030 |
Note. Isyn,0 and F814Wsyn,0 denote synthetic photometry based on Gaia DR3 XP spectra (Section 2.1). GRP,0 and G0 are integrated spectrophotometric and white-light magnitudes from Gaia. Results reported are the medians across the range where ∣dmTRGB/d σs ∣ ≤ 0.1. Uncertainties (σTRGB) combine in quadrature the median MC error, mTRGB dispersion, and the dispersion of the difference between mTRGB values determined as means and medians from the MC samples. Additional detail on uncertainties is found in Section 4.2 and Table 1. Median (V − I)0 colors within ±0.10 mag of mTRGB are reported with the 16th–84th percentile range. †: color cut following H23.
Download table as: ASCIITypeset image
The most striking feature of Figure 4 and Table 2 is the significant difference in mTRGB determined from the four stellar samples. The B sequence yields the brightest TRGB measurement in all samples and for all σs values, −0.021 mag brighter than SARGs and −0.085 mag brighter than the A sequence, consistent with the evolutionary paradigm of the LPV sequences (Wood 2015; Trabucchi et al. 2019). While the difference between the A- and B-sequence samples is significant at the 5σ level according to the stated uncertainties, we note that the real significance of this result is much greater due to shared systematics that overestimate the uncertainties in this direct comparison. We also point out that the B sequence is significantly brighter than the A sequence, independent of σs . Despite the B sequence LF's stronger AGB contamination, it is both more concentrated and steeper near mTRGB (see Figure 3) than the other LFs. Last, but not least, we caution against restrictive color cuts for TRGB measurements, since B-sequence stars are on average redder than A-sequence, despite being more metal-poor. A color selection intended to preferentially select metal-poor giants (as applied in the CCHP analysis) would thus unfortunately remove the B-sequence stars closest to mTRGB, resulting in the opposite of the desired effect. However, the degree to which B-sequence stars would be removed will be both a function of the metallicity of the RG stars and the expected contamination by A-sequence stars, which may be expected to be lower in SN Ia host galaxy halos.
The SARG sample yields the most precise TRGB calibration (∼0.5% in distance, not considering uncertainty due to absolute calibration) thanks to the insensitivity to smoothing bias. Our SARG results are also fully consistent with our Allstars result, as expected, since SARGs contain nearly 100% of the stars in the Allstars sample near the TRGB. The A- and B-sequence samples yield mTRGB of similar precision, each to about 0.6% in distance.
Although the SARG result lies close to the middle between the A and B sequences, we stress three important points: (a) the SARG sample contains nearly 100% of all RG stars near the tip (Figure 1), (b) the SARG sample contains ∼10,500 additional stars that are not part of the A- and B-sequence samples (notably at longer P1), and (c) the mean value of mTRGB determined from different samples is generally not identical to the value of mTRGB determined from the combination of the samples (see, e.g., H23; Appendix C).
4.3. Absolute TRGB Calibration
Our measured apparent TRGB magnitudes can be translated to absolute magnitudes using the LMC's distance derived from detached eclipsing late-type binaries (Pietrzyński et al. 2019; μ = 18.477 ± 0.006(stat) ± 0.026(syst)). For the sake of comparing to H0 measurements in the literature, we here consider results based on ACS/F814W synthetic photometry from Gaia DR3 (Riello et al. 2021; Gaia Collaboration et al. 2023a) as our baseline.
The SARG sample yields mF814W,syn = 14.491 ± 0.010(stat) ± 0.017(syst) mag, which becomes the most accurate (1.5%) TRGB calibration to date, with MF814W,syn = −3.986 ± 0.010(stat) ± 0.033(syst) mag. This result agrees closely with three LMC-independent TRGB calibrations, including Li et al. (2023b) based on the megamaser host galaxy NGC 4258 (−3.980 ± 0.035 mag after considering differences in EDR weighting and the appropriate tip contrast R = 3.3; see Appendix B.1), the EDD TRGB calibration (Rizzi et al. 2007; MI,syn = −4.00 ± 0.03 mag at (V − I)0 = 1.82 mag), and calibrations based on Gaia parallaxes (Li et al. 2023a).
The B-sequence sample yields a slightly (−0.039 mag) brighter calibration of MF814W,syn = −4.025 ± 0.014(stat) ± 0.033(syst) mag (1.7% in distance), which remains consistent to within <1σ with the aforementioned LMC-independent TRGB calibrations.
5. Conclusions and Implications for TRGB Distances and the Hubble Constant
We showed that all stars near the RGB tip in the LMC are variable and found that the SARG LF yields a more accurate TRGB measurement than the Allstars sample. We confirmed the evolutionary scenario of SARGs that the B sequence should contain older stars than the A sequence using spectroscopically determined ages from Povick et al. (2023). As expected from theory, the oldest stars (B sequence) yield the brightest tip measurement. Both calibrations support the value of MTRGB used by Scolnic et al. (2023), who measured H0 = 73 ± 2 km s−1 Mpc−1 in full agreement 5 with the SH0ES DL calibrated using Cepheids (Riess et al. 2022b). Both samples yield MI fainter than that used by the CCHP analysis (Freedman 2021), implying higher H0. Furthermore, we identified several shortcomings in the LMC-based TRGB calibration by H23 (see Appendix C), which carries the highest weight in the CCHP H0 analysis. We demonstrate the robustness of our results using extensive simulations.
We elucidated several systematics of the TRGB methodology, notably including smoothing bias and (for the first time) EDR weighting bias, both of which can impact TRGB distances at the level of a few percent. Specifically, Poisson EDR weighting (Madore et al. 2009) can easily bias mTRGB by approximately −0.04 to −0.06 mag, whereas smoothing can cause bias on the order of 0.02 mag depending on LF shape. We therefore strongly recommend that TRGB analyses always specify how smoothing was treated, and we introduced the smoothing slope as an objective criterion for selecting an appropriate range of σs . We furthermore stress that TRGB distances based on weighted EDRs must be standardized using TCRs (Wu et al. 2023) that arise due to EDR weighting bias (Appendix B.1). This applies in particular to CCHP TRGB distances determined using weighted EDRs. We attribute the insensitivity of the SARG and A- and B-sequence samples to smoothing bias on the shape of their observed LFs, which fall off toward fainter magnitudes, similar to the LFs of RG populations in SN Ia host galaxies; see Figure 3 in Freedman et al. (2019). The impact of photometric incompleteness on LF shape, which depends on many factors and varies among observed fields, deserves additional attention, notably with regard to smoothing and EDR weighting bias.
Our results highlight population diversity as a major concern for measuring distances using the TRGB method. Without spectroscopic information, it is difficult to know the makeup of the RG population under study, and the statistical nature of using the TRGB CMD feature as a standard candle prevents individual standardization and calibration as applied to individual standard candles, such as classical Cepheids. A related issue is field placement for TRGB studies (e.g., Beaton et al. 2018; Scolnic et al. 2023), which can lead to significant problems for distance determination (e.g., Csörnyei et al. 2023). As a result, it is not fully clear whether the SARG or B-sequence calibration more directly applies to the RG populations in the SN host galaxies targeted for measuring H0 (Anand et al. 2021; Freedman 2021; Scolnic et al. 2023). Distances to old metal-poor halos of distant galaxies that are void of intermediate-age RG populations should be based on the B-sequence calibration. However, the SARG calibration may be more suitable if the presence of younger stars cannot be excluded. In case the makeup of the RG population cannot be reliably ascertained, then adopting an additional systematic uncertainty of, say, ∼0.04 mag (∼2% in distance) for TRGB distances appears to be a prudent choice. Interestingly, we find that color cuts targeting the blue RG stars in the hopes of selecting older, metal-poorer stars have the opposite effect when dealing with mixed-age RG populations, since the older population is slightly redder near the tip.
Despite these concerns, there is reason for optimism that the TRGB method can be further improved, notably for use with JWST. The multiperiodic long-period variability of stars near the TRGB offers promising new avenues for understanding RG population diversity and its impact on distance measurements. As a first step in this direction, N. W. Koblischke & R. I.Anderson (2024, in preparation) are targeting SARGs in the SMC. While the low-level variability of SARGs may not be detectable at large distances, we are optimistic that RG variability will inform TRGB standardization using more readily accessible observables.
Acknowledgments
The authors thank the OGLE and Gaia collaborations for producing data sets of exceptional quality without which this work would not have been possible. We thank Marc Pinsonneault for detailed comments that helped improve the manuscript. We also thank Joshua Povick for providing results from Povick et al. (2023) ahead of publication. We thank the anonymous referee for the constructive report.
R.I.A. is funded by the SNSF via the Eccellenza Professorial Fellowship PCEFP2_194638. N.W.K. acknowledges funding through the EPFL Excellence Research Internship Program, the ThinkSwiss Research Scholarship, and the UBCO Go Global Program.
This research was supported by the International Space Science Institute (ISSI) in Bern through ISSI International Team project No. 490, SHoT: The Stellar Path to the Ho Tension in the Gaia, TESS, LSST and JWST Era. This research made use of the NASA Astrophysics Data System.
Facilities: Gaia - , OGLE -
Software: astropy (Astropy Collaboration et al. 2013, 2018), pandas (The pandas Development Team 2023), matplotlib (Hunter 2007).
Appendix A: Sample Selection and Quality Cuts
The specific ADQL query for retrieving the OGLE-III LMC stars from the Gaia archive was the following:
| SELECT * |
| FROM gaiadr3.gaia_source |
| INNER JOIN gaiadr3.synthetic_photometry_gspc as S |
| ON S.source_id=gaia_source.source_id |
| WHERE |
| CONTAINS( |
| POINT('ICRS',gaiadr3.gaia_source.ra,gaiadr3.gaia_source.dec), |
| CIRCLE('ICRS',80.9, −69.75,5.8) |
| )=1 |
| AND S.i_jkc_mag > 12.5 |
| AND S.i_jkc_mag < 16.5 |
| AND (S.v_jkc_mag—S.i_jkc_mag) > 1.0 |
| AND (S.v_jkc_mag—S.i_jkc_mag) < 3.5 . |
Download table as: ASCIITypeset image
Table 3 details the impact of various quality cuts applied to the initial data set as described in Section 2.
Table 3. Description of Sample Selections
| Sample | Step | Nremoved | Nremain | Napplies |
|---|---|---|---|---|
| Gaia cone search (rough color and mag cut) | ⋯ | 540,596 | ⋯ | |
| in OGLE-III footprint, have OGLE V band | 192,057 | 348,539 | ⋯ | |
| Foreground stars | 18,973 | 329,566 | 18,973 | |
| LMC proper-motion ellipse | 1578 | 327,988 | 20,371 | |
| β ≤ 0.99 | 87,322 | 240,666 | 90,386 | |
| ipd_frac_multi_peak <7 | 7220 | 233,446 | 31,246 | |
| ipd_frac_odd_win <7 | 48 | 233,398 | 382 | |
| RUWE < 1.4 | 4430 | 228,968 | 37,568 | |
| C* < 1σ | 60,416 | 168,552 | 147,175 | |
| E(V − I) ≤ 0.2 | 12,459 | 156,093 | 23,593 | |
| Allstars | Removing stars much bluer than RGB | 15,319 | 140,774 | 43,285 |
| Allstars † | Color cuts according to H23 (2023) | 24,683 | 116,091 | ⋯ |
| OGLE-III SARG catalog (Soszyński et al. 2009) | ⋯ | 79,200 | ⋯ | |
| Gaia cross-match | 1559 | 77,641 | ⋯ | |
| SARGs | Quality cuts as applied to Allstars | 37,456 | 40,185 | ⋯ |
| A sequence | LPVs on PL sequence A (manual selection) | ⋯ | 20,470 | ⋯ |
| B sequence | LPVs on PL sequence B (manual selection) | ⋯ | 9164 | ⋯ |
Note. Columns Nremoved, Nremain, and Napplies list the number of stars removed sequentially, the number of stars remaining in the sample after applying the cut, and the number of initial stars to which this cut applies, respectively. Foreground and proper-motion cuts, as well as the photometric quality indicators, are explained in the text.
Download table as: ASCIITypeset image
Appendix B: Simulating LFs to Quantify Systematics
We investigated systematics for the SARG, B-sequence, and Allstars samples using analytic representations of the observed LFs to simulate how variations in LF shape or the measurement process affect mTRGB. Each LF is composed of three components carefully matched to reproduce the observed LFs: (a) an AGB population (A(m)) modeled as a Gaussian of height aAGB, dispersion σAGB, and mean offset ΔmAGB from the input TRGB magnitude mTRGB; (b) a sigmoid function S(m) centered on mTRGB to represent the TRGB "break" with sharpness parameter w; and (c) an RG population (R(m)) at magnitudes fainter than mTRGB, which increases rapidly for the Allstars sample and decreases otherwise. For SARGs and A- and B-sequence LFs, we modeled R(m) using a Gaussian whose peak of amplitude  coincides with the sigmoid function at the mode of the observed LF
  .
.
The simulated LF is the sum of its components:

where


and R(m) is defined relative to  so that

for both samples;
for Allstars, where s1 and s2 are slopes to reproduce the rising Allstars LF; and
for SARGs, with  the dispersion that reproduces the declining SARG LF toward fainter magnitudes. The baseline parameters for LF simulations are shown in Table 4.
Table 4. Baseline Simulation Parameters Determined to Visually Match the Observed LF, Normalized to Unit Height at 
| Sample | aAGB | σAGB | ΔmAGB | w |

|

| s1 | s2 |
|---|---|---|---|---|---|---|---|---|
| Allstars | 0.24 | 0.21 | 0.450 | 0.095 | 0.305 | ⋯ | 0.10 | 0.65 |
| SARGs | 0.20 | 0.21 | 0.450 | 0.080 | 0.305 | 0.31 | ⋯ | ⋯ |
| B sequence | 0.25 | 0.20 | 0.475 | 0.060 | 0.125 | 0.30 | ⋯ | ⋯ |
| A sequence | 0.14 | 0.20 | 0.490 | 0.100 | 0.400 | 0.25 | ⋯ | ⋯ |
Note. mTRGB,0 = 14.495 was used in Figure 5.
Download table as: ASCIITypeset image
Anchoring Equations (B5) and (B6) to  allows for a common and straightforward definition of TRGB contrast:

 is directly measurable for LPV LFs, independently of mTRGB. Conversely, the tip contrast ratio R = N+/N− (Wu et al. 2023) requires knowledge of mTRGB to estimate the number of stars 0.5 mag below and above the tip, N+ and N− (see Appendix B.1).
Figure 5 illustrates the analytical and observed LFs for the Allstars and SARG samples for comparison and compares our empirical mTRGB measurements with simulations for a range of σs values. We find excellent agreement to within 0.005 mag at all σs levels. In particular, our simulations reproduce the observed smoothing bias.
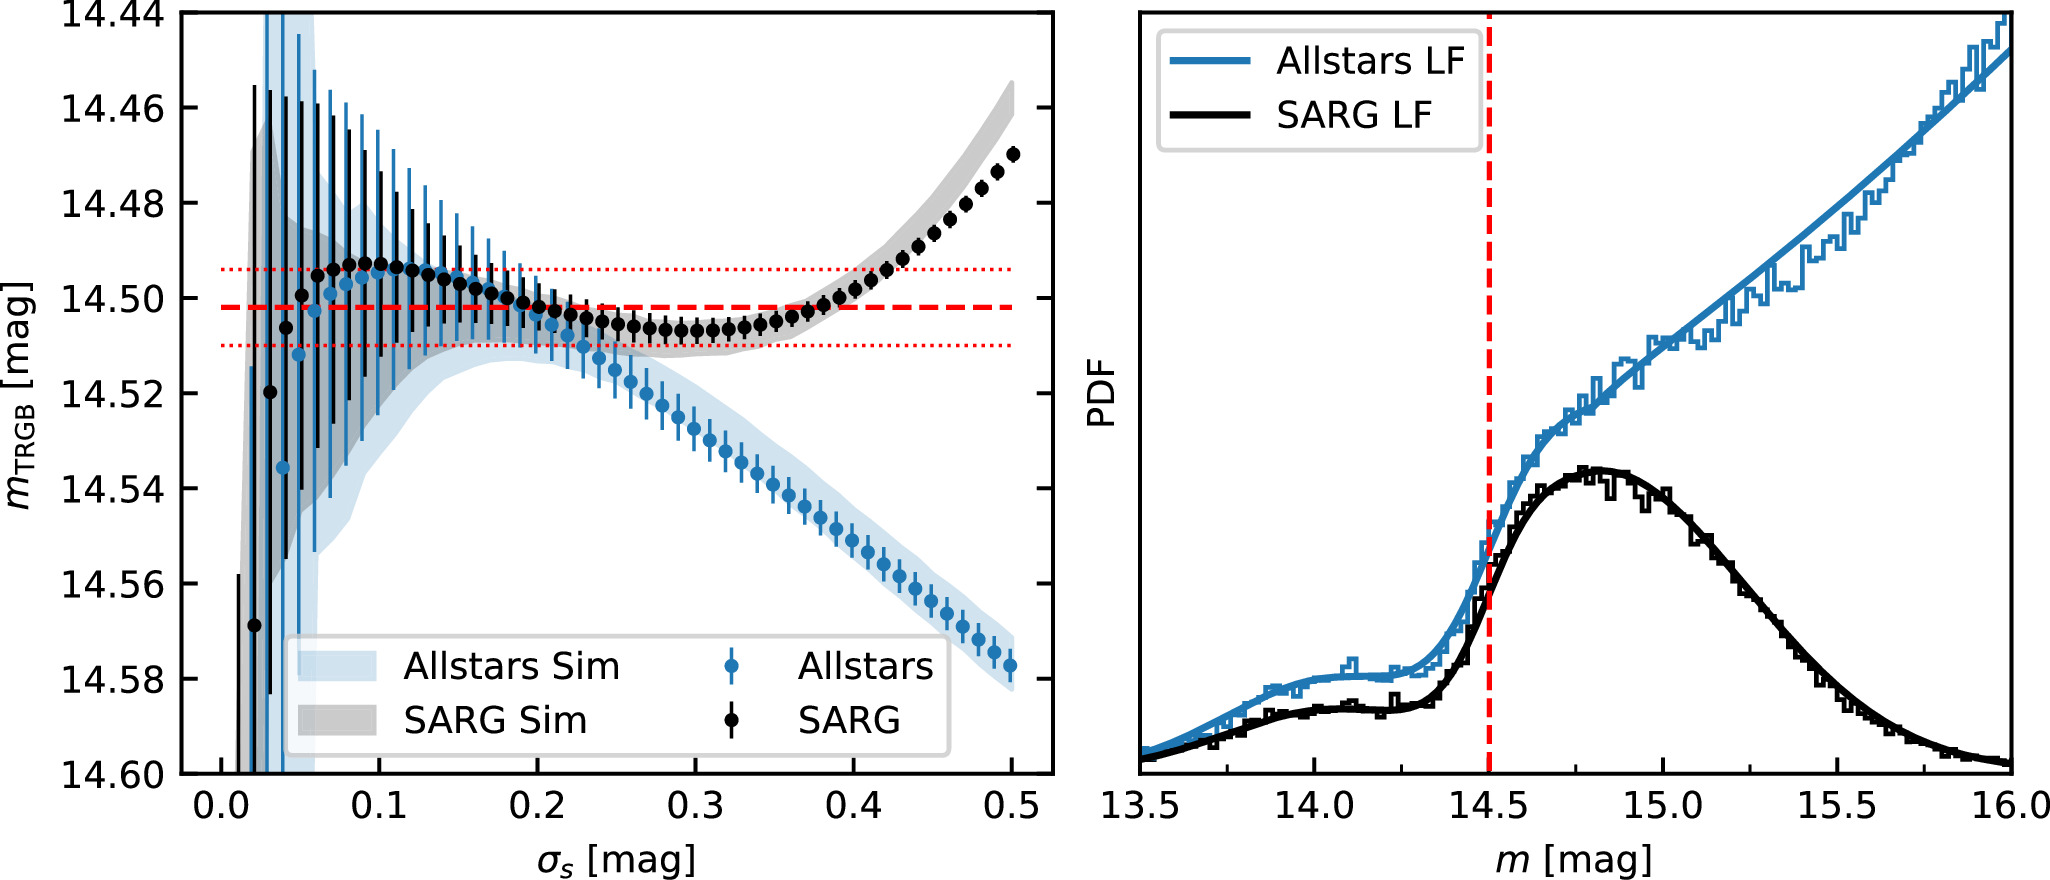
Figure 5. Simulated LFs probe the dependence of  on LF shape. Left: observed (error bars) and simulated (shaded regions) values of mTRGB against smoothing parameter. The simulations reproduce observed trends at a level of approximately 0.005 mag. The simulated true mTRGB,0 = 14.495 coincides with the 1σ interval of our measured TRGB shown as red horizontal lines. Right: observed (steps) and simulated (smooth curves) LFs.
Download figure:
Standard image High-resolution imageFigure 6 illustrates the bias  due to contrast (
 ) and steepness (w) for σs
= 0.15 mag and illustrates the corresponding effects on the composite LF. We find smaller bias
) and steepness (w) for σs
= 0.15 mag and illustrates the corresponding effects on the composite LF. We find smaller bias  for higher
  values, qualitatively similar to Figure 9 in Wu et al. (2023). We further find that steeper TRGB features tend to be less biased, that the SARG sample exhibits lower dispersion in the simulations than the Allstars sample, and that the SARG LF yields slightly lower bias (∼0.009 mag) than the Allstars LF (∼0.013 mag).
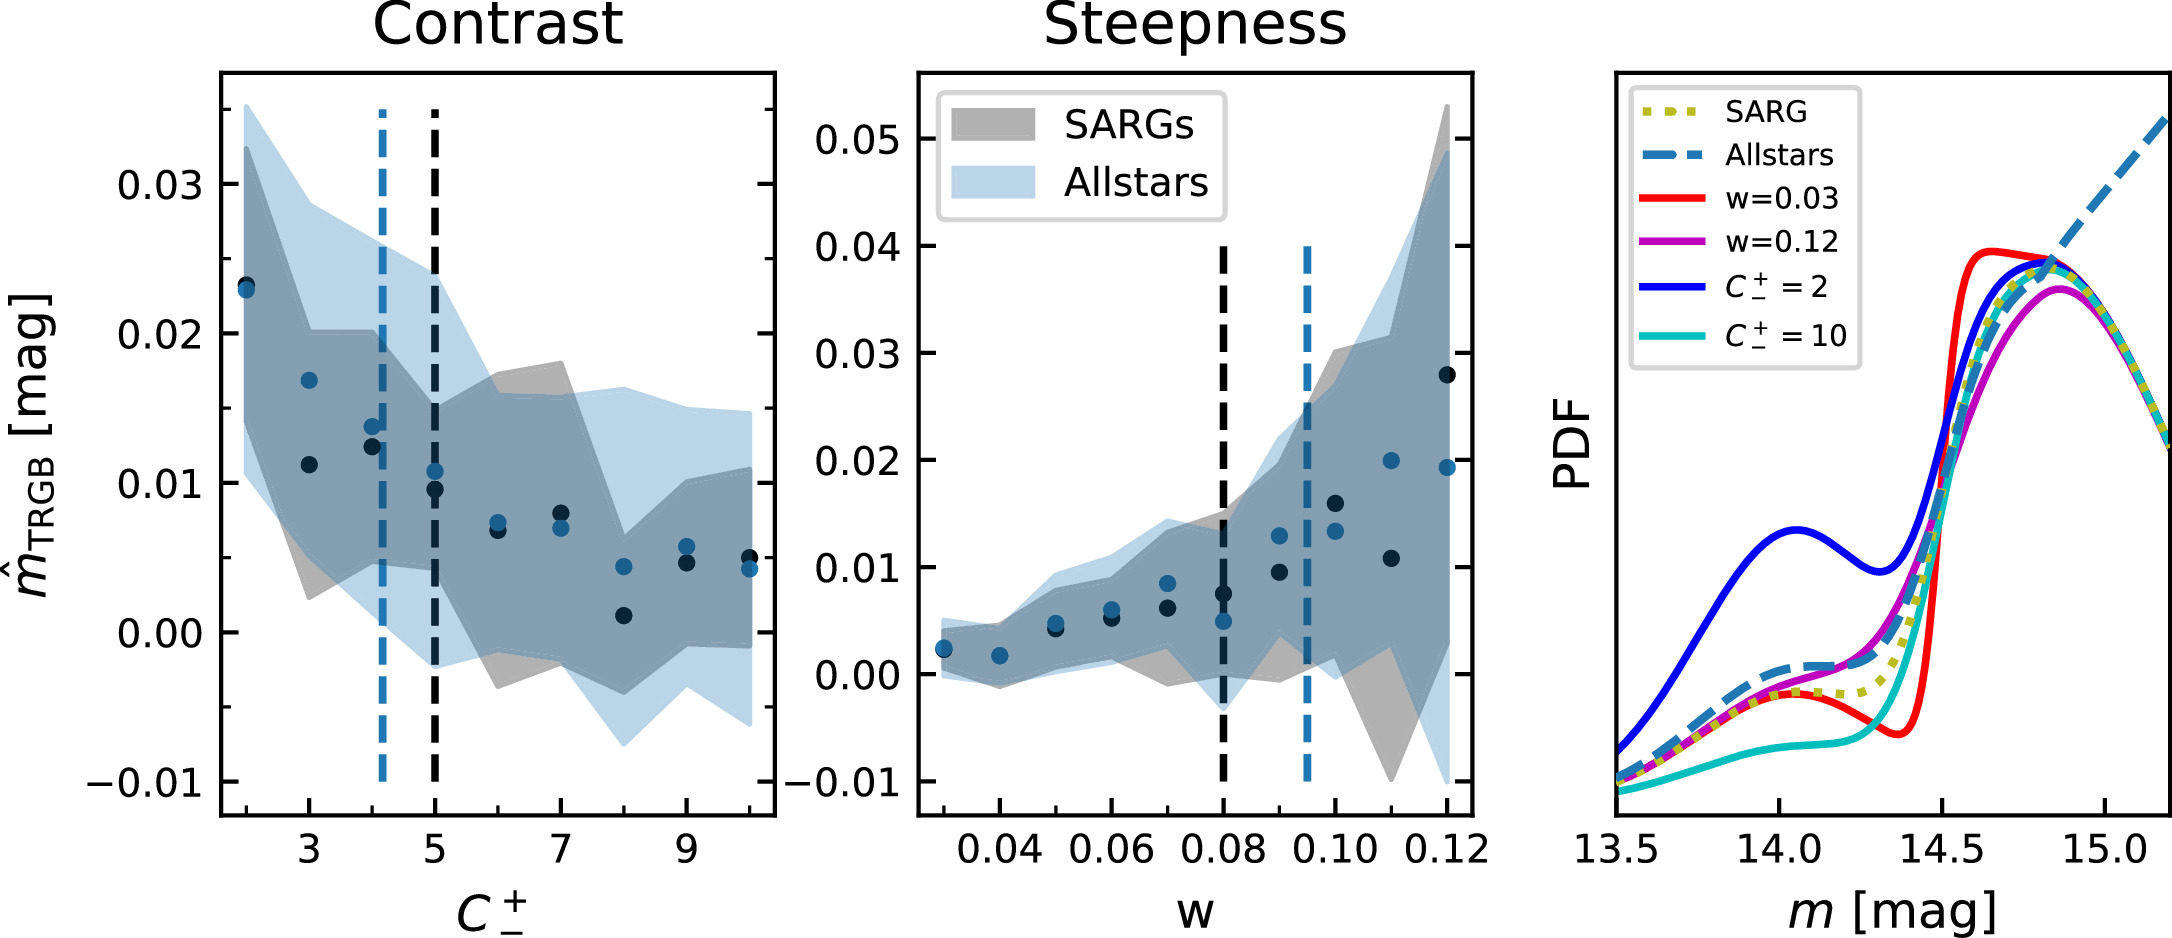
Figure 6. Investigating bias due to TRGB contrast (left) and steepness (center) for the Allstars (blue) and SARG (black) samples at σs
= 0.15 mag. Equation (B7) defines  independently of mTRGB. Higher-contrast (larger
  ) and steeper (smaller w) TRGB features reduce bias and enhance precision. Vertical dashed lines indicate the values of the observed samples at
  (Equation (B7)) from Table 4. The right-hand panel illustrates how varying these parameters changes the SARG LF.
Download figure:
Standard image High-resolution imageB.1. Sobel Filter Weighting and TCRs
Weights (w) were introduced to the TRGB method to invoke a notion of statistical significance for the Sobel filter response,  (Madore et al. 2009). The EDR is thus the product
  , and mTRGB is measured as the mode of the EDR. We note that GLOESS smoothing introduces correlation among the very narrow LF bins, complicating the interpretation of weighted EDRs in terms of S/N.
Different descriptions of ostensibly identical weighting schemes have been presented in articles associated with the CCHP H0 analysis (e.g., Madore et al. 2009; Hatt et al. 2017; Freedman et al. 2019; H23 2023). We therefore investigated three weighting options (see also Li et al. 2023b; Wu et al. 2023): (a) no weighting, i.e., w(i) = 1; (b) weighting  by the inverse Poisson error, i.e.,
 ![$w(i)=1/\sqrt{N[i-1]+N[i+1]}$](https://content.cld.iop.org/journals/2041-8205/963/2/L43/revision1/apjlad284dieqn29.gif) , as implemented by Li et al. (2023b, their Equation B1) and described by Madore et al. (2009), Freedman et al. (2019), and Freedman (2021); and (c) "S/N" weights
, as implemented by Li et al. (2023b, their Equation B1) and described by Madore et al. (2009), Freedman et al. (2019), and Freedman (2021); and (c) "S/N" weights ![$w(i)\,=(N[i-1]-N[i+1])/\sqrt{N[i-1]+N[i+1]}$](https://content.cld.iop.org/journals/2041-8205/963/2/L43/revision1/apjlad284dieqn30.gif) as described in H23, equivalent to weighting
as described in H23, equivalent to weighting  by the inverse Poisson error.
We simulated Allstars, SARGs, and B-sequence sample LFs with different  and computed tip contrast R = N+/N− after determining mTRGB using the different weighting schemes. As shown in Figure 7, the resulting R values depend on the sample, precluding a straightforward translation between
  and R. Figure 8 illustrates these results and shows that unweighted EDRs (option (a)) lead to nearly unbiased results above R ≳ 2.5, and we therefore adopt the unweighted procedure to measure mTRGB empirically (Table 2). Option (b) yields the most biased results, and option (c) exhibits intermediate bias. Analogous trends based on synthetic stellar populations are seen in Figure 9 of Li et al. (2023b).

Figure 7. Comparison of input  used to simulate the LFs (see Equation (B7)) and the tip contrast R determined using different samples and EDR weighting schemes. R can differ greatly according to EDR weighting scheme because it is evaluated at increasingly biased mTRGB. Based on the same LFs shown in Figure 8.
Download figure:
Standard image High-resolution image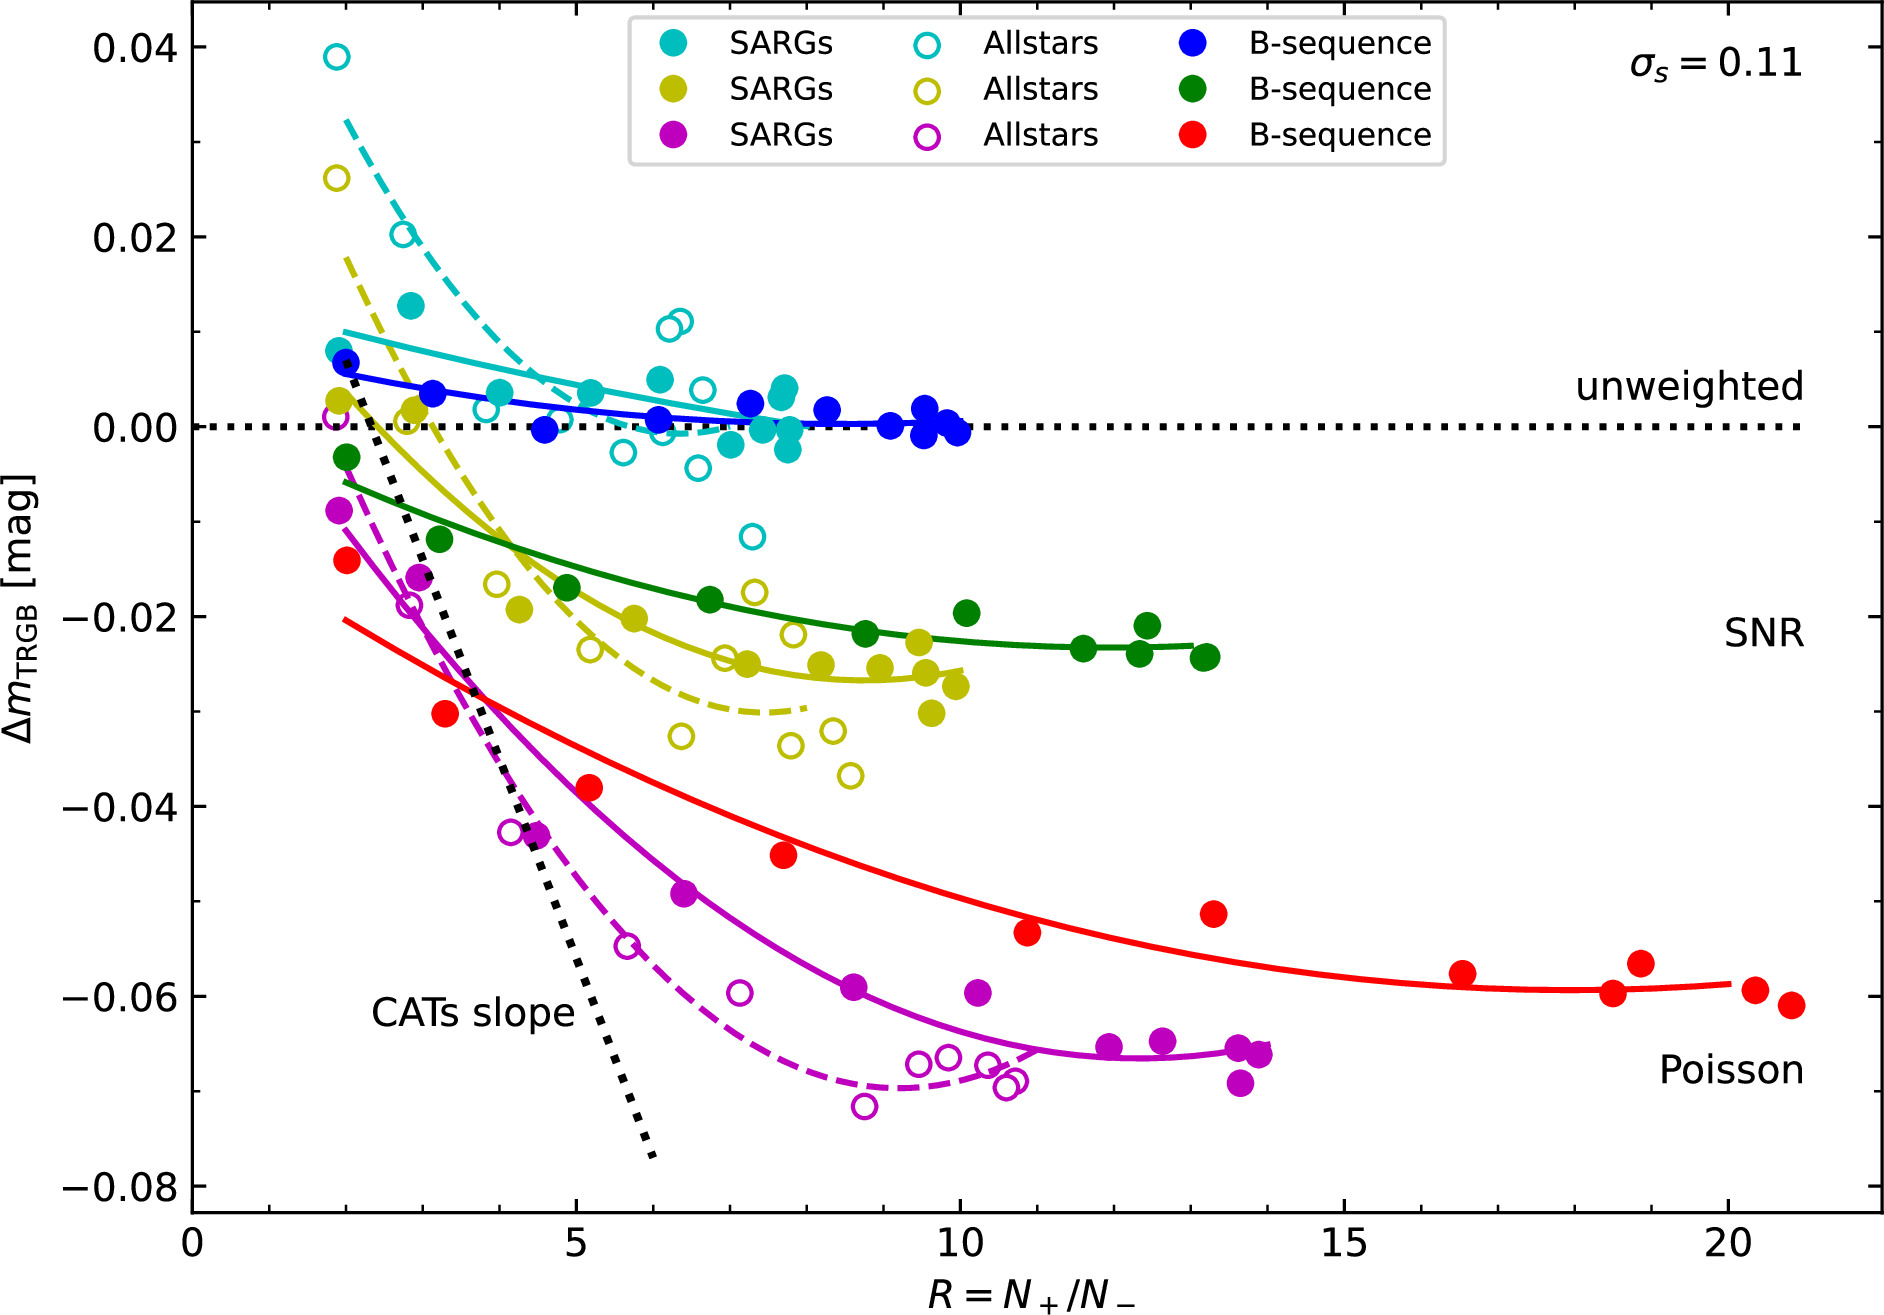
Figure 8. Bias induced by weighting Sobel filter responses using different methods. Simulated LFs (σs = 0.11 mag) for Allstars (open circles), SARGs (filled cyan, yellow, and magenta circles), and the B sequence (filled blue, green, and red circles) exhibit consistent bias as a function of tip contrast R when using the same EDR. Regardless of sample, the unweighted EDR yields the least biased and the Poisson EDR the most biased results. Differences in R arise from the biased estimation of mTRGB. All TCRs are nonlinear; the linear trend by Scolnic et al. (2023; black dotted line) is a good approximation for R between 2 and 5. Solid lines represent fits to solid symbols and dashed lines those to open symbols. The quadratic fit to the Poisson EDR Allstars sample (dashed magenta line) yields −0.060 mag at R = 6.4.
Download figure:
Standard image High-resolution imageWeighted EDRs yield systematically brighter mTRGB values than unweighted EDRs (Figure 8). This, in turn, introduces a dependence of mTRGB on R (a TCR) because the number of stars above the tip decreases rapidly toward brighter magnitudes and because R by definition depends on mTRGB. As a result, the same underlying LF with a given value of  yields different R values depending on EDR weighting scheme (Figure 7). Our simulations thus explain the origin of the TCR reported based on observations of SN host galaxies and LMC subfields (Li et al. 2023b; Scolnic et al. 2023; Wu et al. 2023), and we note the agreement between the linear TCR by Scolnic et al. (2023) and our simulations for R in the range of their LMC subfields (2 < R < 5). Weighting
  of the observed LFs used in this study yields identical trends and consistent differences among the different weighting options. Studies using weighted EDRs must therefore correct for R differences as done in the CATS analysis (Scolnic et al. 2023), while unweighted EDRs do not require such correction. The quadratic fit to the Allstars sample analyzed using Poisson EDR weighting yields a bias of −0.060 mag at R = 6.4, the contrast of the combined H23 calibration sample.
We choose to report only results based on unweighted EDRs to avoid the bias and complications related to TCRs introduced by weighting. We note that R differences cannot explain the magnitude difference between mTRGB determined using the A- and B-sequence samples, in particular for the unweighted EDR used here.
Appendix C: Comparison with Hoyt (2023)
Despite our use of the same OGLE-III footprint, photometry, and OGLE-IV red clump reddening maps, our results for the SARG and Allstars samples differ significantly from the mTRGB reported by H23, which was adopted by the CCHP H0 analysis (Freedman 2021). To investigate this difference, we restricted the Allstars sample to a color–magnitude range following H23 between two lines: a = −3 · ((V − I)0 − 1.6) + 14.45 and b = −3.5 · ((V − I)0 − 1.95) + 14.45. This color cut dims mTRGB by 0.032 mag (see Table 2) and yields mI,OGLE = 14.527 mag (labeled Allstars † in Table 2), which is 0.088 mag fainter than mI = 14.439 mag (Figure 1 in H23, full OGLE footprint).
We noticed that H23 used an incorrectly low reddening value of RI
= 1.219. Correcting RI
to a more reasonable RI
= 1.46 amplifies the disagreement with H23 by ∼0.12 · (1.460–1.219) = 0.029 mag to 0.117 mag. We further note that the statistical uncertainty of E(V − I) values, which are correlated due to the limited resolution of the red clump reddening maps, does not reduce as  as assumed in H23. Additionally, the value of N in this context is arbitrary (H23 used an interval of 0.02 mag around mTRGB).
We traced the origin of this large, 0.117 mag, difference to the combination of several systematic differences by simulation and by reproducing H23's analysis step-by-step, including color restrictions, use of low RI , geometric corrections, and spatial selections. We analyzed the five subregions of the OGLE-III footprint H23 labeled "calibration sample" (henceforth F11, F13, F19, F32, and F33), as well as the combined sample of stars located therein (henceforth the H23 sample). Since H23 did not specify which value of σs was adopted, and given ambiguous descriptions of the EDR weighting procedure in the body of CCHP articles (e.g., Madore et al. 2009; Hatt et al. 2017; Freedman et al. 2019; H23), we computed results for a range of smoothing values 0.02 ≤ σs ≤ 0.2 and using all three EDR weighting schemes described in Appendix B.1.
Figure 9 shows the comparison of our results with H23's tabulated information. Based on this comparison (left panel in Figure 9), we conclude that H23 mostly likely 6 used σs = 0.13 mag and the Poisson EDR weighting scheme, despite Equation (1) in H23 suggesting that S/N weighting was used. While a combination of lower σs and S/N weighting can also reproduce H23's results, Poisson weighting yields better field-to-field consistency and is required to reproduce mTRGB close to those reported in their Extended Data Table 2. However, the center panel of Figure 9 shows that no single value of σs reproduces the tip magnitude reported in H23, suggesting that σs was left to vary from field to field. We also note that the CCHP H0 analysis did not specify the σs values used for individual galaxies, apart from the general statement that σs is typically close to the photometric error. At σs = 0.13 mag, we find a total range of ∼0.05 mag variations around the H23 sample result of 14.439 mag.
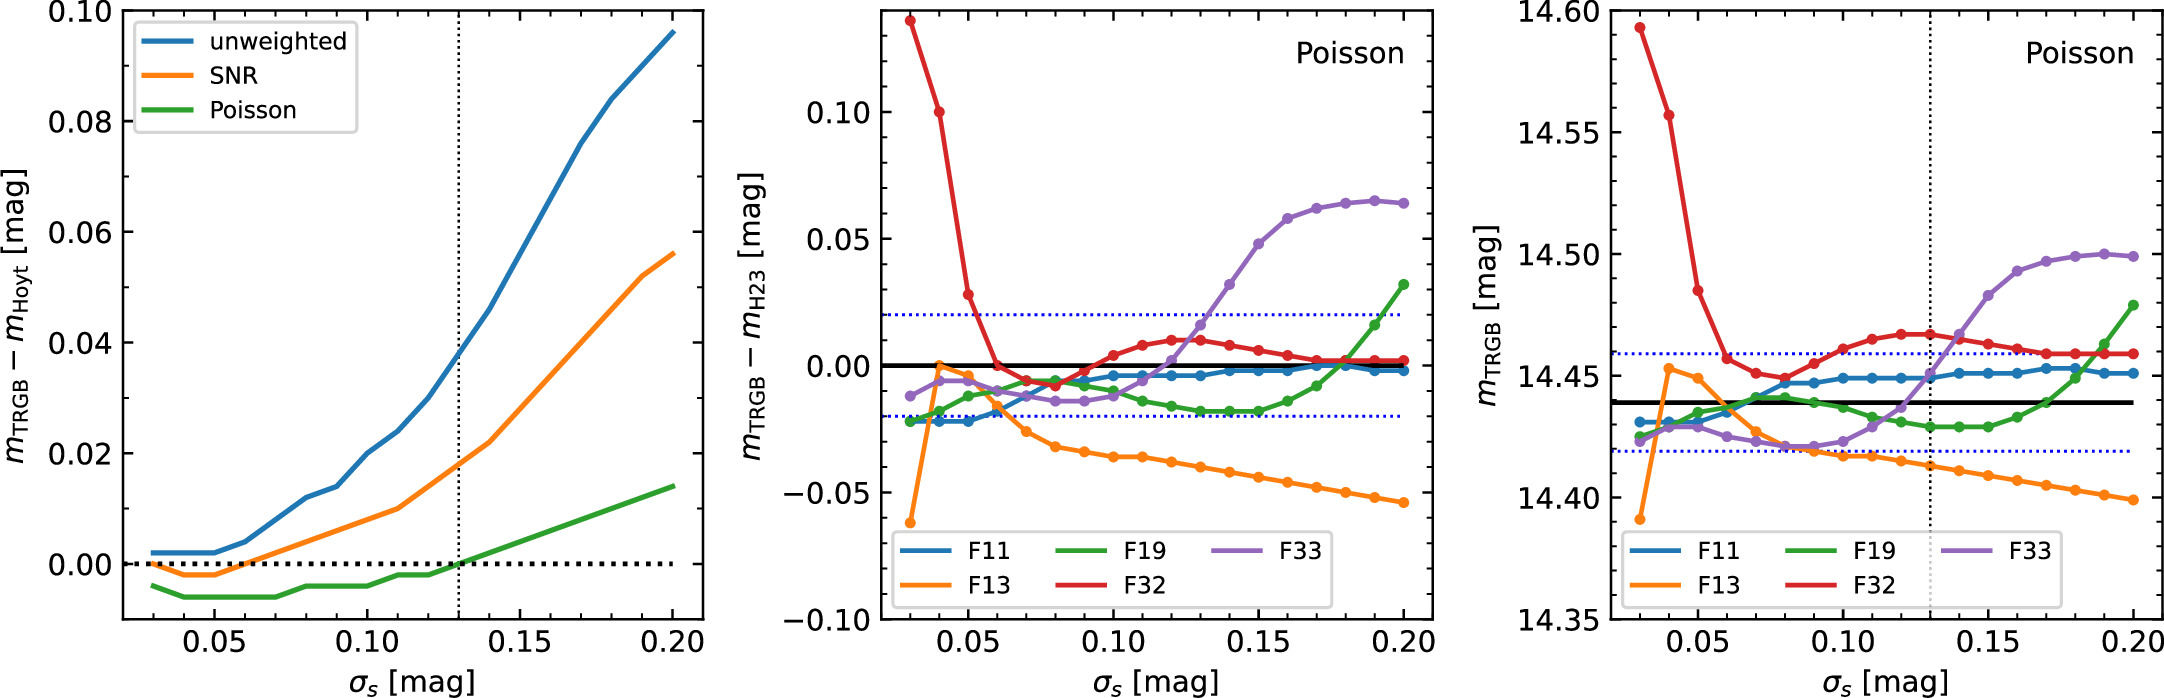
Figure 9. Inferring the EDR weighting scheme and σs values used by H23. We sought to reproduce both the sample selection and methodology explained by H23 (color cut applied, low RI = 1.219 used) and measured mTRGB over a range of σs values using different EDR weighting schemes for the five "calibration" fields used by H23 as well as their combination. Left: difference of TRGB magnitude minus H23 for three weighting schemes using combined fields. Poisson weighting and σs ≈ 0.13 mag exactly reproduces H23. Center: difference of TRGB magnitude minus H23 for individually selected fields using Poisson weighting, which yields the best consistency. No single value of σs reproduces the individual results reported by H23. Right: mTRGB for the five selected fields using Poisson EDR weighting. The result from the combined sample is shown as a solid black horizontal line for reference together with the most likely σs value used by H23. NB: averaging mTRGB from individual fields does not and is not expected to yield the same mTRGB as the combined set of stars in all fields.
Download figure:
Standard image High-resolution imageHaving thus shown the ability to reproduce H23's result using Poisson EDR weighting and σs ≈ 0.13 mag, we quantify the origin of the 0.115 mag difference with H23 as follows. Incorrect RI renders mTRGB brighter by −0.029 mag. Smoothing does not significantly contribute to the difference between the H23 calibration sample and our Allstars analysis because they used similar σs values. According to our simulations, EDR weighting brightens mTRGB by approximately −0.06 mag for R = 6.4 measured in the H23 sample (Figure 8). Geometric corrections brighten mTRGB in the H23 sample by ∼−0.015 mag. The remaining difference of 0.117 − 0.029 − 0.06 − 0.015 ≈ 0.013 mag is thus most likely attributable to the rejection of ∼80% of the stars available when considering the H23 calibration sample. According to H23, field selection impacted their mTRGB by merely 0.002 mag. However, this could be slightly skewed if a different value of σs was used. Minor differences in methodology and sample selection, e.g., concerning foreground star cleaning, etc., can easily explain the remaining small difference of ∼0.5% in distance.
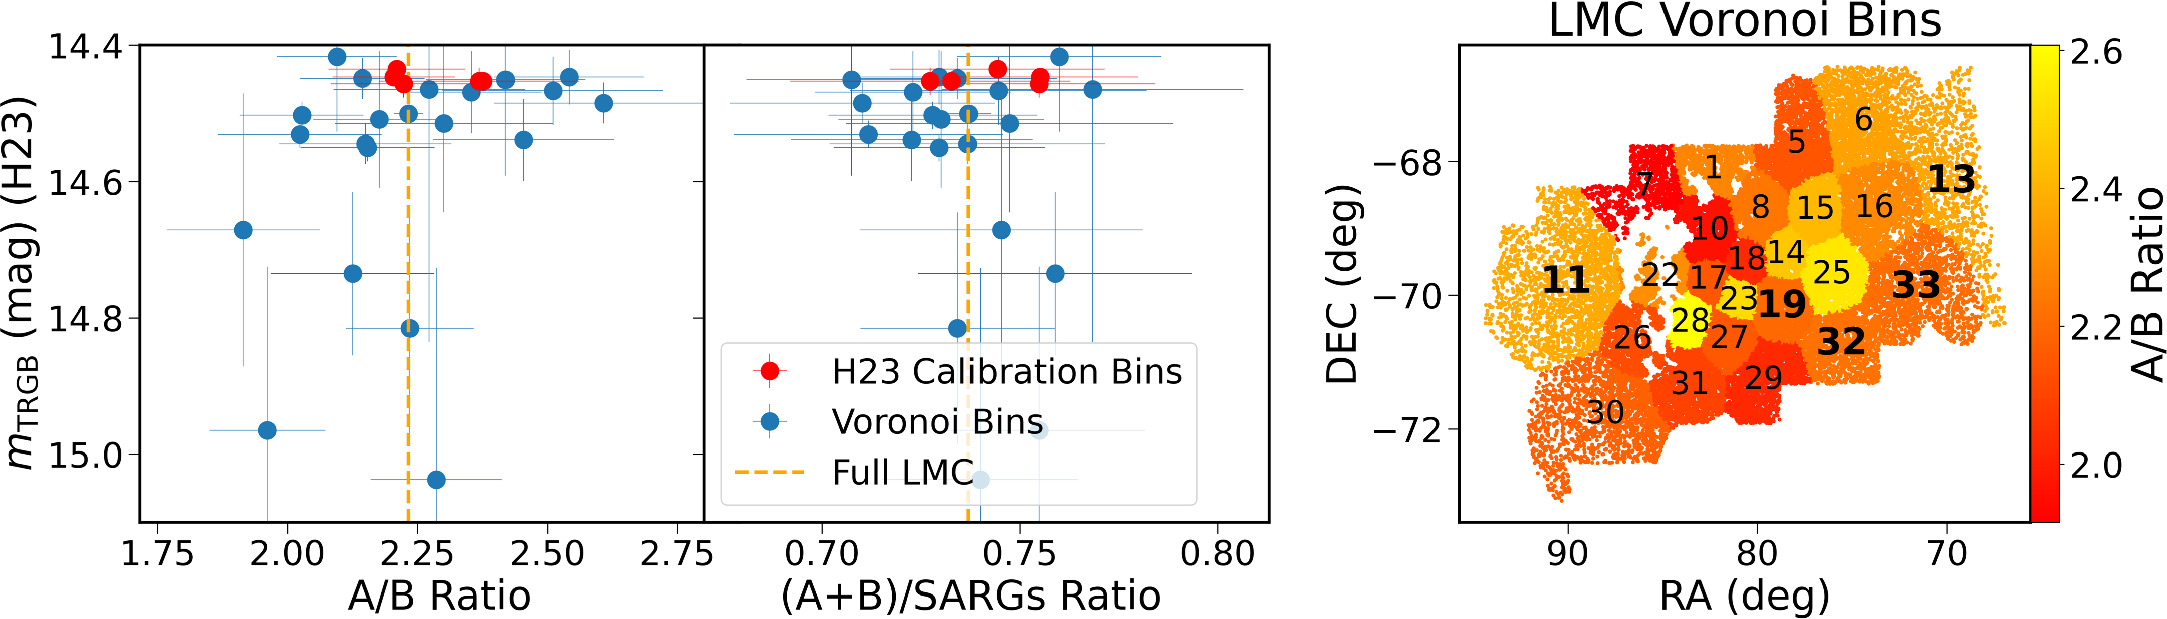
We note that the H23 calibration sample does not preferentially select the LMC's older RG population. Figure 10 shows that the B-sequence stars are located all across the OGLE-III LMC footprint, with only minor variations in the ratio of numbers on sequences A and B. Neither the ratio of the number of RG stars on the A and B sequences nor the ratio of A- and B-sequence stars to all SARGs is particularly low in any of the H23 calibration fields. Figure 10 thus shows that spatial selections do not allow one to select old stars in the OGLE-III LMC footprint. However, variability-based selection does allow one to separate old and young RG stars. Importantly, B-sequence stars are slightly redder than A-sequence stars, in particular close to the TRGB. The color cut by H23 would tend to preferentially remove these stars, thus removing the brightest old RG stars at the tip. Color cuts should therefore be considered with great care, in particular in the presence of diverse RG populations.
Figure 10. The ratio of SARGs on sequences A and B is rather even across the OGLE-III LMC footprint. Left: TRGB magnitudes from H23 measured from different spatial following H23 using their Voronoi tessellation vs. the ratio of SARGs on sequence A to B. The calibration fields used by H23 are highlighted in red, and the vertical dashed line indicates the mean ratio of A to B. Center: same as left but vs. the ratio of SARGs on sequences A and B to all SARGs. Right: ratio of stars on the A and B sequences across the LMC OGLE-III footprint with Voronoi spatial bins numbered as in H23.
Download figure:
Standard image High-resolution image
Footnotes
- 5
As discussed by Scolnic et al. (2023), proper treatment of SNe Ia and their peculiar velocities raises H0 more substantially than the calibration of MTRGB.
- 6
Unfortunately, the author was not available for comment despite multiple inquires.