


Abstract
We report the direct detection of Lyman continuum (LyC) emission from nine galaxies and one active galactic nucleus at z ∼ 1.1–1.6 in the GOODS-North field using deep observations from the Ultraviolet Imaging Telescope (UVIT) on board AstroSat. The absolute escape fraction of the sources estimated from the far-ultraviolet and Hα-line luminosities using Monte Carlo analysis of two intergalactic medium models span a range ∼10%–55%. The rest-frame UV wavelength of the sources falls in the extreme-ultraviolet regime ∼550–700 Å, the shortest LyC wavelength range probed so far. This redshift range remains devoid of direct detections of LyC emission due to the instrumental limitations of previously available facilities. With UVIT having very low detector noise, each of these sources is detected with an individual signal-to-noise ratio (S/N) > 3, while for the stack of six sources, we achieve an S/N ∼ 7.4. The LyC emission is seen to be offset from the optical centroids and extended beyond the UVIT point-spread function of 1 6 in most of the sources. This sample fills an important niche between GALEX and Cosmic Origins Spectrograph at low z and Hubble Space Telescope's Wide Field Camera 3 at high z and is crucial in understanding the evolution of LyC leakers.
Export citation and abstract BibTeX RIS

Original content from this work may be used under the terms of the Creative Commons Attribution 4.0 licence. Any further distribution of this work must maintain attribution to the author(s) and the title of the work, journal citation and DOI.
1. Introduction
After the Big Bang, the Universe expanded and cooled until the electrons and protons could combine to form atoms (at z ∼ 1090) and remained in the neutral form until the cosmic dawn (z ∼ 20–15) when the first galaxies started forming. During the period from z ∼ 12 to z ∼ 6, when the Lyman continuum (LyC) radiation from the galaxies started ionizing the surrounding intergalactic medium (IGM), the Universe underwent a transformation from a completely neutral state to an almost completely ionized state; see Robertson et al. (2010) for a review. Detecting the ionizing radiation from this early epoch of galaxies is extremely important to understand the nature and formation of these galaxies and the process of reionization.
However, direct detection of LyC photons from the era of reionization is challenging because of the increasing IGM opacity (Madau 1995; Inoue et al. 2014) and plausible faintness of the ionizing sources. Nevertheless, there has been detection of LyC emission from local analogs of the high-redshift galaxies at z < 0.4 using the Cosmic Origins Spectrograph on the Hubble Space Telescope (HST; Leitet et al. 2013; Borthakur et al. 2014; Izotov et al. 2016, 2018; Leitherer et al. 2016; Flury et al. 2022), as well at higher redshift z > 3 using HST and ground-based imaging (Shapley et al. 2016; Vanzella et al. 2016, 2018; Bian et al. 2017; Steidel et al. 2018; Fletcher et al. 2019; Prichard et al. 2022; Liu et al. 2023).
There was no direct detection of LyC emission in the intermediate-redshift range 0.5 ≲ z ≲ 3 until the Ultraviolet Imaging Telescope (UVIT) on board the Indian multiwavelength satellite AstroSat detected extreme-ultraviolet (EUV) radiation from a clumpy galaxy (AUDFs01) at z ≃ 1.42 (Saha et al. 2020). Previously, extensive stacking analyses have been carried out using HST/Wide Field Camera 3 (WFC3) deep-field data and provided upper limits on the LyC escape fraction in this redshift range but with no significant detection of LyC emission (Siana et al. 2007; Iwata et al. 2009; Smith et al. 2018, 2020; Alavi et al. 2020). A larger sample of EUV emitters like AUDFs01 is required to investigate if such galaxies are representative of the high-redshift galaxies that contributed to the reionization of the Universe.
In this Letter, we report the direct detection of LyC emission in the EUV domain (550–700 Å) from nine star-forming (SF) galaxies and one hosting an active galactic nucleus (AGN) at the cosmic noon (z ∼ 1.1–1.6) in the GOODS-North field using deep UV imaging from UVIT (Mondal et al. 2023).
Throughout this work, all distance-dependent quantities use H0 = 70 km s−1 Mpc−1, Ωm = 0.3, and ΩΛ = 0.7 following ΛCDM cosmology.
2. Data
2.1. UVIT Imaging Data
The far-ultraviolet (FUV) and near-ultraviolet (NUV) imaging data come from AstroSat observations of the GOODS-North field (GT08-77; PI: Kanak Saha). These observations were carried out by UVIT (with a field of view of  diameter) on board AstroSat, which performed simultaneous observation in the F154W (λmean = 1541 Å, Δλ = 380 Å) and N242W (λmean = 2418 Å, Δλ = 785 Å) bands during 2018 March 10–12. The observations were carried out for 40 ks, which corresponds to ∼32 orbits. During each orbit, FUV and NUV observations in photon-counting mode were taken every 33 ms, resulting in about 45,000–50,000 frame (in each band) accumulation in a good orbit. The final science-ready images of the AstroSat Ultraviolet Deep Field-North (AUDFn) had a total exposure time of texp = 34022 s in the FUV and 19228 s in the NUV with 5σ limiting magnitude 26.79 and 26.73, respectively. We ask the reader to refer to Mondal et al. (2023) for more details on the data reduction.
2.2. 3D-HST Grism and Imaging Data
We make use of the archival grism spectral data from the 3D-HST survey (PI: Weiner; Brammer et al. 2012; Momcheva et al. 2016). 3D-HST provides rest-frame optical spectra for a sample of ∼7000 galaxies at 1 < z < 3.5. It covers three-quarters (625 arcmin2) of the CANDELS Treasury survey area with two orbits of primary WFC3/G141 grism coverage and two to four orbits with the Advanced Camera for Surveys/G800L grism in parallel. The WFC3/G141 spectra provide continuous wavelength coverage from 1.1 to 1.65 μm at a spatial resolution of ∼013. We also make use of the publicly available deep-imaging data in optical HST Advanced Camera for Surveys (Giavalisco et al. 2004), IR from WFC3 (Grogin et al. 2011; Koekemoer et al. 2011; Skelton et al. 2014), and U band from the MOSAIC camera on the Kitt Peak 4 m telescope (Capak et al. 2004) of the GOODS-North field.
2.3. Sample Selection
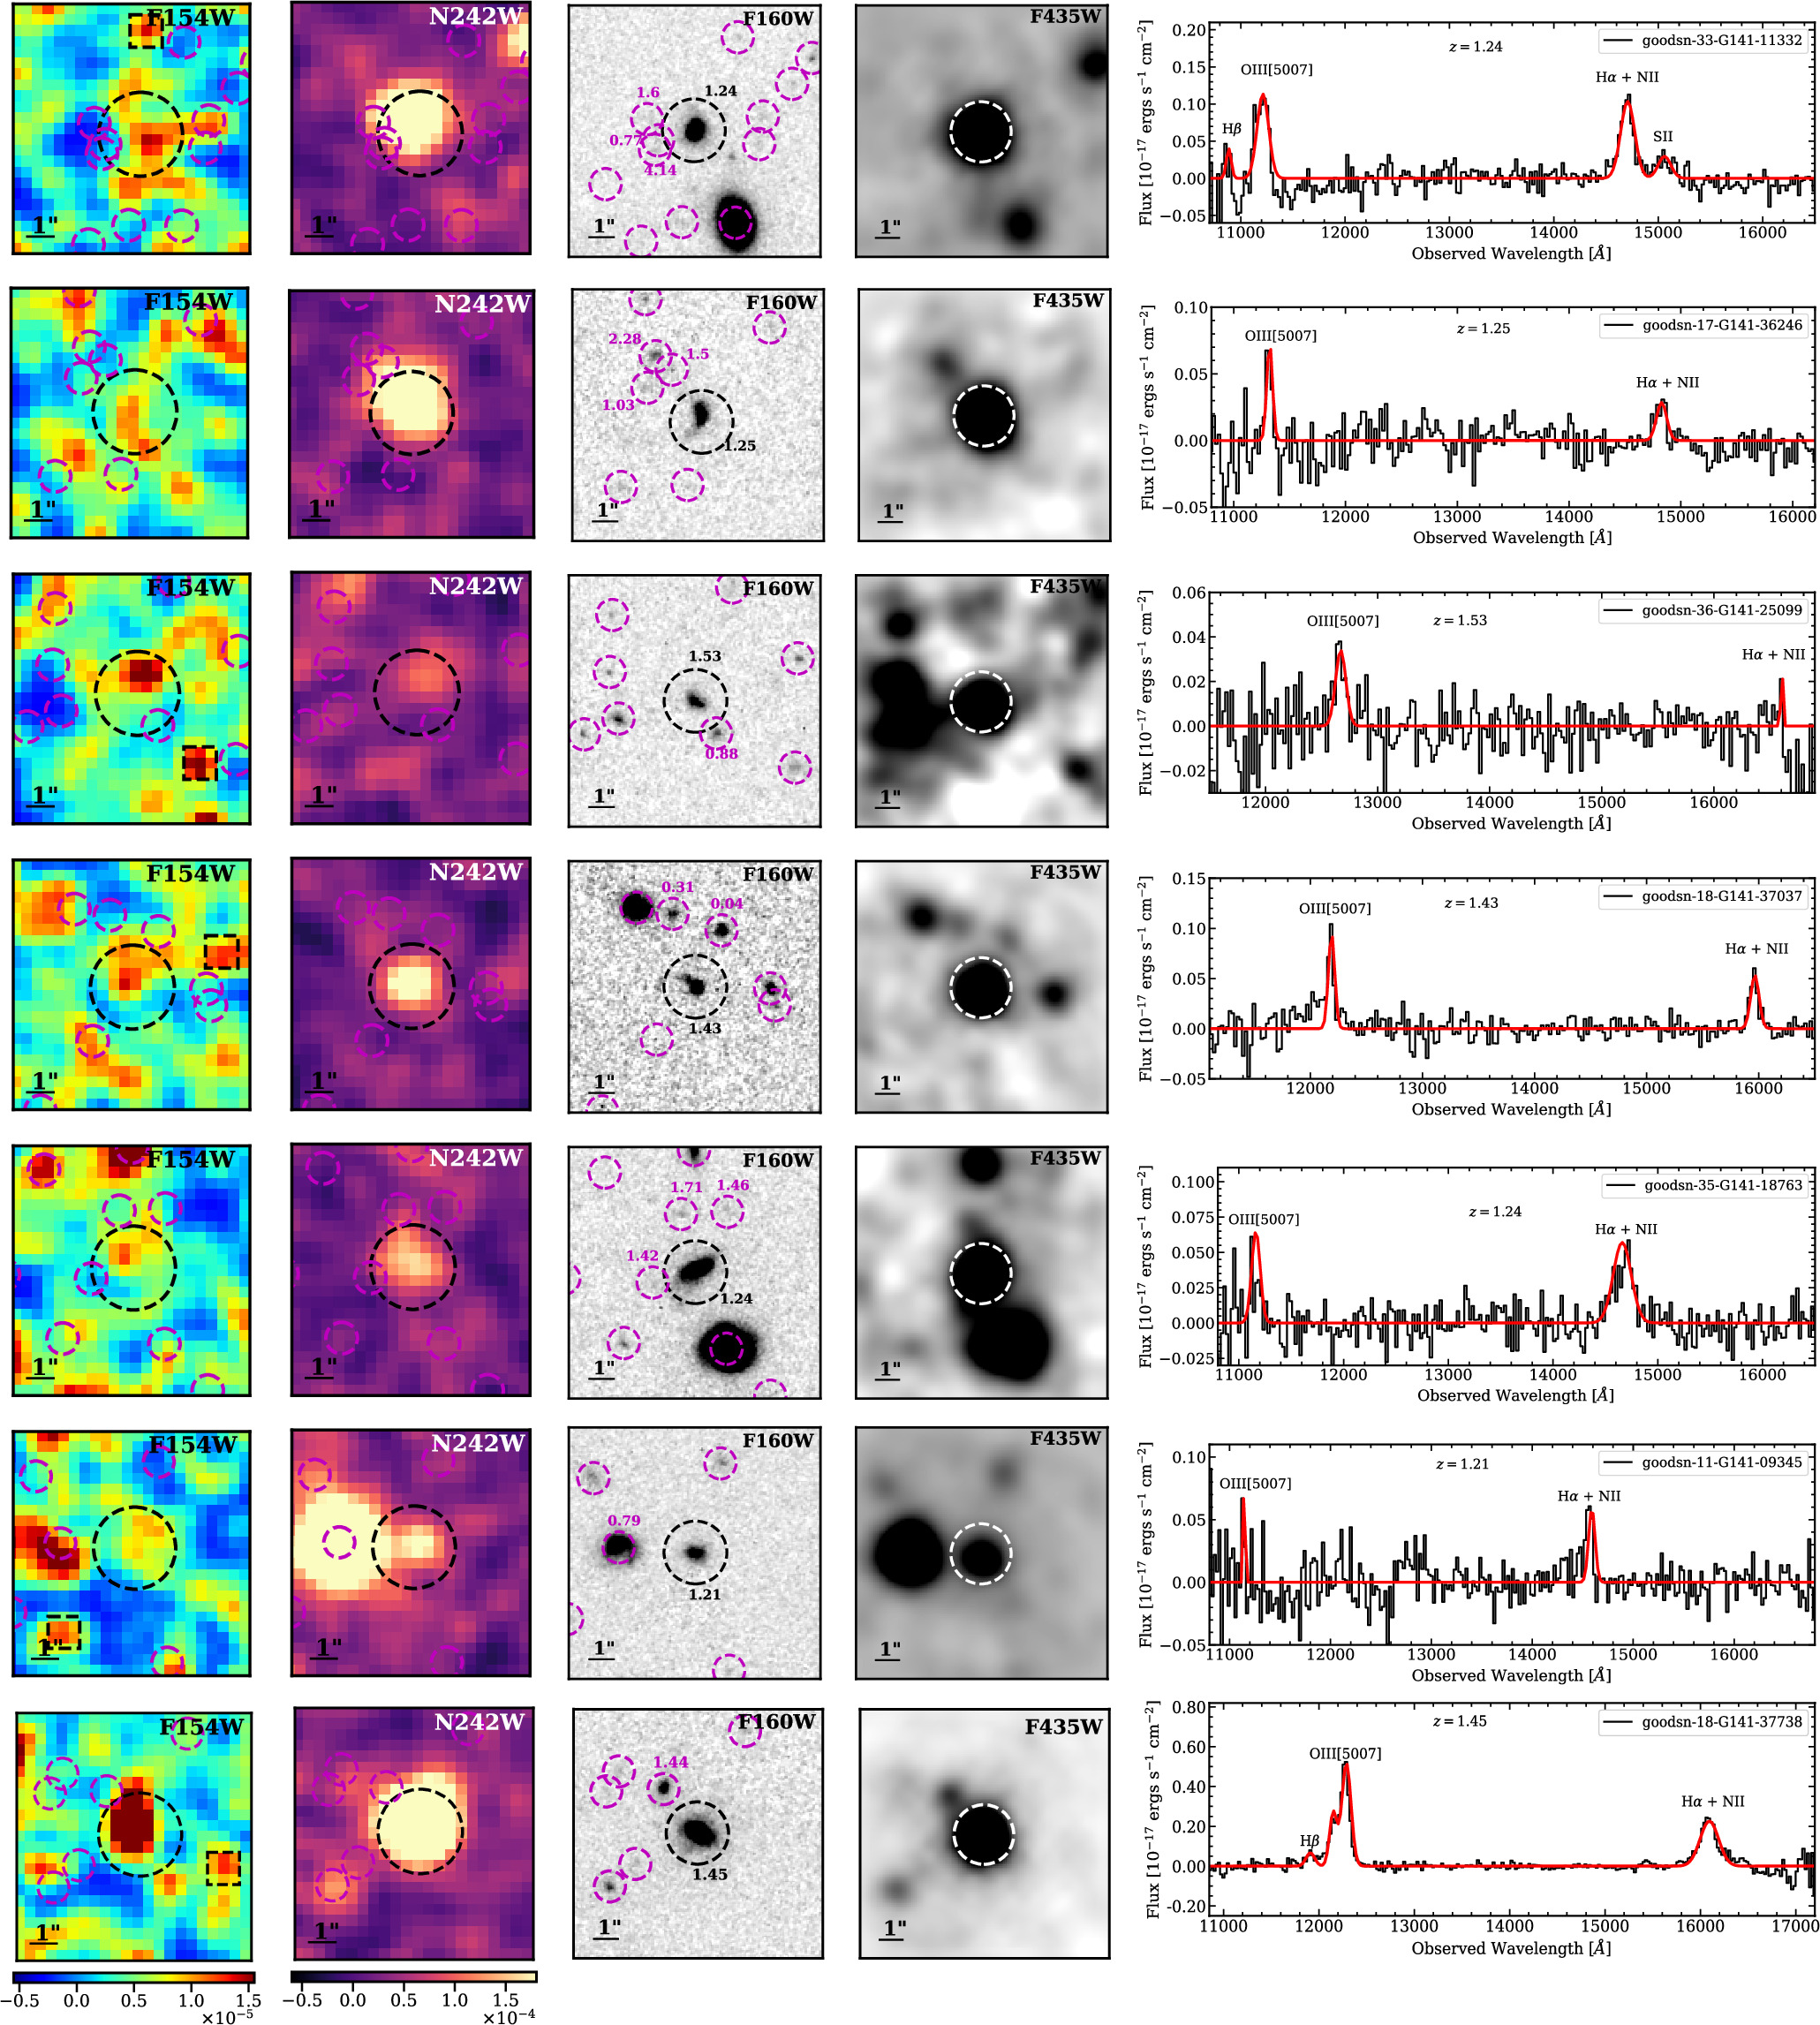
The spectral data from 3DHST G141 grism are used to identify sources at redshift 1.0 < z < 2.0. We use the Hα and [O iii]5007 (hereafter [O iii]) lines having line fluxes with signal-to-noise ratio (S/N) > 3 to identify emission-line sources. In the G141 grism with a wavelength coverage of 1.10–1.65 μm, the Hα and [O iii] lines are simultaneously observed only between the redshift range z ∼ 1.1–1.6, restricting the redshift range of the sources to 1.1 < z < 1.6 (the redshifts are confirmed with the Hα and O iii[5007] lines in the grism spectra, whose analysis is discussed in detail in Section 5). Of the 178 sources found from 3D-HST grism data, 56 sources are identified in UVIT F154W band images. We perform photometry and the appropriate background estimation of these 56 potential LyC leaker candidates (described in Section 3). To avoid contamination, we consider only the sources having no neighboring companions within 12 radius in the Skelton et al. (2014) catalog. In addition to checking the catalog, we also visually inspect the HST F435W and F160W bands for any contaminations within a 12 radius. With these criteria and requiring the FUV S/N > 3, we are left with 11 sources. One source in these 11 is observed to have an Hα line at the edge of the spectral coverage of G141. To avoid the uncertainty in redshift and line-flux measurement, we exclude this source from our sample. We consider the remaining sample of ten sources as our final sample of LyC leakers. The locations of the ten detected LyC leakers in GOODS-North field are shown in Figure A1. We further segregate the sample of ten LyC leakers into the ones having LyC emission within UVIT point-spread function (PSF) FWHM ∼ 16 (seven sources) and sources having extended emission beyond 16 (three sources). The UVIT F154W, N242W, HST F160W, and HST F435W (convolved with the UVIT FUV PSF) images of the seven sources are shown in Figure 1, while the extended sources are shown in Figure 5.

Figure 1. The first two panels from the left show the UVIT F154W and N242W band images of the LyC leakers. In the images, north is up and east is toward the left. The black dashed circles on the UVIT images represent apertures of size 16 with the same centers as in the HST/F160W images on the third panel. In the HST/F160W band images, these apertures are of size 1'' and are centered about the LyC emitters. The magenta circles indicate neighboring objects. The numbers outside the apertures indicate the redshift of the respective objects close to the LyC leakers. The fourth panel shows the HST/F435W images convolved with the F154W PSF for a size comparison. Spurious sources (see Section 4) are highlighted by dashed black squares in the F154W band. We quote the magnitude (S/N) of such sources from top to bottom. On the first row in the north: 27.07 (1.88); third row in the southwest: 26.50 (2.77); fourth row in the west 26.54 (2.69); sixth row in the southeast: 27.05 (1.93); and seventh row in the southwest: 26.76 (2.38). On the extreme right are the 3D-HST spectra of the LyC leakers. The black solid curves are the original spectra after contamination and continuum subtraction. The red curves indicate the fitted models.
Download figure:
Standard image High-resolution imageWe note that one of the LyC leakers in the sample (goodsn-36-G141-25099) has a very narrow Hα line and rather looks like a noise peak, which could affect the LyC escape fraction and star formation rate (SFR) calculations; however, the redshift estimated (1.52) from the grism spectra ([O iii] and Hα lines) is very close to the photometric redshift (1.56) provided in the Skelton et al. (2014) catalog. This implies that the line identification is correct and redshift of the source is likely to be z ∼ 1.52.
3. Photometric Analysis
For the 56 potential LyC candidates chosen using the Hα- and [O iii]-line emission criteria, we estimate the S/N at their respective positions in the F154W filter of the UVIT. The first step involves estimating the local background around each source. For this, we run Source Extractor (Bertin & Arnouts 1996) on the 30'' × 30'' (75 × 75 pixels) cutouts around the source. We then place boxes of size 7 × 7 pixels at ten random locations where there are no sources detected. The 7 × 7 box size is optimally chosen as it is ∼twice the PSF in UVIT F154W band. The parameters used for generating the SExtractor segmentation maps are listed in Table A1. The mean of these ten background values is taken as the local background value of the source. (The number of random boxes is chosen to be low to avoid overlap; however, a higher number of sampling boxes does not change the background estimate significantly.) Then the flux within 16 circular aperture placed at the source location is extracted. Using the measured flux, the S/N is then estimated using the relation given in Saha et al. (2020). For one of the sources (goodsn-11-G141_09345) the S/N estimated within the 16 aperture is 2.64, whereas it is 3.10 within an aperture of 12. This could be because of a larger number of noise pixels in the 16 aperture. For this particular source we quote the S/N within 12 aperture in Table 1. The detection significance and probability of false detections are discussed in Section 4.
Table 1. UV Photometric Properties of LyC Leakers
| 3D-HST ID | z (Momcheva et al. 2016) | mFUV | S/NFUV | Mean T (I14) | Mean T (B21) | Rest UV λ |

| fesc (I14) | fesc (B21) |
|---|---|---|---|---|---|---|---|---|---|
| (mag) | (Å) | ||||||||
| (1) | (2) | (3) | (4) | (5) | (6) | (7) | (8) | (9) | (10) |
| goodsn-33-G141_11332 | 1.24 | 26.20 ± 0.35 | 3.07 | 0.63 | 0.39 | 691 | 0.62 | 0.15 ± 0.04 | 0.22 ± 0.02 |
| goodsn-17-G141_36246 | 1.26 | 26.22 ± 0.35 | 3.12 | 0.63 | 0.38 | 686 | 0.85 | 0.56 ± 0.10 | 0.67 ± 0.06 |
| goodsn-36-G141_25099 a | 1.52 | 26.21 ± 0.35 | 3.09 | 0.51 | 0.27 | 613 | 4.44 | 0.79 ± 0.13 | 0.88 ± 0.08 |
| goodsn-18-G141_37037 | 1.43 | 26.10 ± 0.33 | 3.29 | 0.54 | 0.29 | 636 | 1.31 | 0.44 ± 0.08 | 0.60 ± 0.04 |
| goodsn-35-G141_18763 | 1.24 | 26.23 ± 0.35 | 3.04 | 0.63 | 0.39 | 690 | 1.62 | 0.19 ± 0.05 | 0.28 ± 0.03 |
| goodsn-11-G141_09345 | 1.21 | 26.43 ± 0.41 | 3.10 b | 0.64 | 0.40 | 699 | 1.41 | 0.35 ± 0.09 | 0.46 ± 0.06 |
| goodsn-18-G141_37738 c | 1.45 | 25.55 ± 0.24 | 4.48 | 0.54 | 0.27 | 631 | 0.69 | 0.11 ± 0.02 | 0.19 ± 0.01 |
| goodsn-17-G141_35906 | 1.30 | 26.11 ± 0.33 | 3.27 | 0.59 | 0.36 | 672 | 2.70 | 0.36 ± 0.08 | 0.48 ± 0.04 |
| goodsn-46-G141_14637 | 1.49 | 26.12 ± 0.33 | 3.27 | 0.51 | 0.27 | 622 | 1.01 | 0.24 ± 0.06 | 0.37 ± 0.04 |
| goodsn-24-G141_18817 | 1.49 | 26.01 ± 0.31 | 3.46 | 0.51 | 0.27 | 623 | 1.19 | 0.29 ± 0.06 | 0.44 ± 0.04 |
Notes. Column (1): 3D-HST ID; column (2): redshift mentioned in the Momcheva et al. (2016) catalog (the redshift is confirmed by visually inspecting the Hα and [O iii] emission lines in the G141 grism spectra); column (3): FUV magnitude corrected for foreground and internal extinction; column (4): S/N of the LyC signal in F154W band within 16 aperture; columns (5) and (6): mean IGM transmission (e−τ
) using Inoue et al. (2014) and Bassett et al. (2021), respectively; column (7): rest-frame UV wavelength in Å probed by the F154W band; column (8): LyC (F154W) to UV continuum (F435W) ratio corresponding to rest frame ∼600–700 Å in LyC and ∼1500–2300 Å in UVC (ultraviolet continuum); and columns (9) and (10): mean LyC escape fractions for the Inoue et al. (2014) and Bassett et al. (2021) IGM models, respectively. The first seven sources above the horizontal line are the ones where the LyC emission is within a 16 radius aperture, while the objects below the line have signs of extended emission.
2 aperture radius.
c
AGN.Download table as: ASCIITypeset image
Further, AB magnitudes are obtained using the magnitude zero-points 17.77 and 19.81 for the F154W and N242W, respectively (Tandon et al. 2017). The magnitudes are then corrected for foreground dust extinction following Schlafly & Finkbeiner (2011) and internal extinction using the UV beta slope fλ ∝ λβ (Reddy et al. 2018), derived from photometry using the Kitt Peak 4 m telescope U band (λmean = 3828 Å) and HST F606W (λmean = 5921 Å) falling in the rest-wavelength λ ∈ [1268–2580] Å using the equation given by Nordon et al. (2013). The magnitudes and S/N in the F154W band for our final sample of ten LyC leakers are provided in Table 1.
4. Detection Significance of LyC Leakers
In order to check the detection significance of the LyC leakers in the F154W band, we carry out an exercise using SExtractor. We produce 10'' × 10'' cutouts around the ten detected LyC leakers from the UVIT/F154W deep image. Considering the SExtractor input parameters listed in Table A1, we identify sources in each cutout and estimate their magnitude within an aperture of radius 16. In Figure 2 (left panel), we show the magnitude histogram of the LyC leakers and the SExtractor detected sources that do not have an HST counterpart (termed spurious sources) from all the cutouts. There is a clear segregation in the magnitudes of the spurious sources and the LyC leakers. Further, on the fainter side, we detect sources down to the 3σ detection limit (27.35 mag) in F154W filter as reported by Mondal et al. (2023). The faintest LyC leaker in our sample is around ∼0.8 mag brighter than the 3σ detection limit. It is to be noted here that the 3σ detection limit (within an aperture of radius 1'') is estimated using the average rms noise of the background sky sampled from the entire AUDFn field (see Mondal et al. 2023), whereas the S/N in this study is estimated using the source signal, local sky background, and exposure time. Following this, the 3σ limit is generally fainter than the magnitude of the source having S/N = 3. In our case, the 3σ detection limit in F154W is 27.3 mag, which is fainter than the magnitude of a source having F154W S/N = 3.

Figure 2. Left panel: the F154W magnitude of sources detected within 10'' × 10'' field around the 10 LyC leakers by SExtractor. The spurious sources are the ones detected by SExtractor in F154W band around the LyC leakers but not having any counterpart either in HST F435W or F160W band. Middle panel: the F154W S/N histogram of the same LyC leakers and the spurious sources as in the left panel. Right panel: the S/N distribution of 1000 and 250 circular apertures placed randomly on the entire AUDFn field of  diameter (solid line) and
  HST-covered patch (dashed line) respectively, after segmenting the detected sources. Both histograms (in the right panel) show apertures only with positive flux values. All magnitudes and S/Ns are calculated based on aperture of radius = 16 unless mentioned otherwise.
Download figure:
Standard image High-resolution imageThis signifies that the leaker candidates are unlikely to be spurious noise sources. In the middle panel of Figure 2, we show the S/N distribution of the same sources. The S/N histogram further highlights that the identified LyC leakers have a higher S/N value (i.e., nine out of ten with S/N > 3.0 in 16 aperture) compared to a large percentage of spurious sources detected around them.
We carry out an additional independent exercise to test the possibility of false detections in F154W band image. For this, we identify sources in the entire AUDFn image (diameter ∼28') using SExtractor with the parameters listed in Table A1. Then, 1000 apertures of 16 radii are placed randomly such that they do not enclose any segmented pixels identified in the previous step. The mean local background around our ten leakers is considered as the background value to construct the S/N distribution of the flux measured within these 1000 random apertures (only positive flux values; Figure 2 right panel). We find no apertures out of 1000 containing flux with S/N > 3, which indicates that the random fluctuating background pixels are unlikely to mimic an S/N > 3 source flux; see also Borgohain et al. (2022) for a similar outcome from GOODS South F154W deep image. For quantifying the number of FUV spurious sources with respect to the HST detection, we produced a  cutout of the GOODS-N field in UVIT F154W, N242W, HST F435W, and F160W bands. We created a rescaled UVIT PSF-convolved HST detection image combining F435W and F160W bands and used it to produce a segmentation map. We placed 250 random apertures in source-free regions guided by this segmentation map. We found less than 4% of the 250 apertures having F154W S/N > 3. These can either be real FUV sources that are faint in the redder bands or noise peaks in the FUV background. The random aperture exercise using segmentation from UVIT detection is further repeated for this 5' × 5' cutout with 250 circles, and we found a similar result as seen for the entire field (Figure 2 right panel). Further, in 30'' × 30'' area around the LyC leakers, we found S/N > 3 F154W sources and identify their counterpart in the HST F435W filter image. In most cases, we found one-to-one correspondence, except goodsn-11-G141_09345 and goodsn-17-G141_35906, where F154W (F435W) source numbers are 4(3) and 9(8), respectively.
5. Spectroscopic Analysis
We use the WFC3 G141 grism data for the spectral analysis. We first extract the 1D contamination subtracted spectral data for the ten short-listed LyC leaking candidates. For continuum subtraction, we fit the 1D contamination subtracted spectra with a polynomial function using the specutils package in Python. All ten short-listed LyC leaking candidates show Hα and [O iii] lines in emission. The [O iii] is a doublet and is fitted accordingly. The emission-line fluxes were estimated by fitting Gaussian models to the continuum subtracted observed emission-line profiles using the astropy modeling package in Python. The uncertainties on the line fluxes were estimated using the error spectrum provided for each object with the 1D G141 grism spectra. Given the error at each wavelength, the error on the line flux was estimated by carrying out standard error propagation of the addition of uncertainties under the line. The region of the spectrum chosen to fall under the line is taken as the same spectral window as that used to fit the Gaussian in the line modeling. In the G141 grism spectra, the Hα line is blended with [N ii]. We extract Hα line flux from the blended [N ii] line using a method based on equivalent width following Sobral et al. (2012). Further, the [O iii] doublet is also blended, and wherever possible, we fit a double Gaussian to extract the [O iii] line flux (although the estimated [O iii] line fluxes are not used in any of the results in this paper). The obtained line fluxes are further corrected for internal extinction. As most of the galaxies lack Hβ emission, the UV β slope technique (Reddy et al. 2018) is used to correct for the internal extinction. Five of the LyC leakers in the sample show Hβ line emission. For these galaxies we estimated the E(B − V) values using the Balmer decrement method by assuming the theoretical ratio as 2.86, assuming Case B recombination (Osterbrock & Bochkarev 1989) with an electron temperature of ∼104 K and electron density of 100 cm−3. Only two of the galaxies (goodsn-33-G141_11332 and goodsn-46-G141_14637) show positive E(B − V) values. Assuming a stellar-to-nebular extinction conversion factor = 0.44, the E(B − V) for goodsn-33-G141_11332 using Balmer decrement (0.35) is in close agreement with the estimate from UV β slope method (0.31), while for goodsn-46-G141_14637 the Balmer decrement gives a lower value. However, it is to be noted that there can be scatter in the relation between stellar and nebular extinction with objects being considerably offset from the line with slope f = 0.44 (Koyama et al. 2019; Reddy et al. 2020). Since the number of sources is not sufficient for a statistical comparison and Balmer decrement is not applicable for most of the sources in the sample, we use the E(B − V) estimates from UV β slope. The estimated line fluxes and derived quantities like Hα SFR and sSFR are provided in Table A2 in Appendix, while the 1D spectra are shown in extreme right panels of Figures 1 and 5. Further, the Hα line is used to confirm the redshift of the sources.
6. Escape Fraction and IGM Attenuation
To derive the absolute LyC escape fraction, we first estimate the number of hydrogen ionizing photons produced that do not escape the galaxy and are in dynamic equilibrium with the ISM using the dust-corrected luminosity of the Hα recombination line. Assuming a temperature T = 104 K and electron density ne = 100 cm−3, we can estimate the number of LyC photons emitted per unit time that do not escape the galaxy (Osterbrock & Ferland 2006; Saha et al. 2020) as

where L(Hα) is the dust-corrected Hα line luminosity. We estimate the rate at which LyC photons escape the galaxy,  , from the FUV flux measured in the F154W filter following Saha et al. (2020). Note that this gives us a lower limit on the number of escaping LyC photons from the galaxy since the FUV band probes only a part of the rest-frame LyC range for our sample.
Thus, we have

where LF154W is the luminosity computed using the observed flux in the F154W filter,  Å for the F154W filter, and the
  term is introduced to correct for the absorption by the IGM. The IGM models used in the analysis are discussed in Section 6.1. We now use the following expression to denote the absolute escape fraction:

The estimated mean escape fractions of the ten LyC leakers are provided in Table 1.
In Figure 3 we show the LyC fesc of our sample in comparison with LyC leakers at lower and higher redshifts. It is difficult to predict any redshift evolution of fesc from the distribution; however, it is important to note here that different studies use different IGM models and probe LyC at various rest-frame wavelengths.

Figure 3. The LyC absolute fesc estimated using Bassett et al. (2021) IGM model in black open circles for the ten leakers in our sample compared to individual LyC leakers at lower (z < 1, blue filled circles) and higher redshifts (z > 2, red filled circles). The low-z leakers are taken from Leitet et al. (2013), Borthakur et al. (2014), Leitherer et al. (2016), Izotov et al. (2016, 2018, 2021), and Flury et al. (2022). The high-z leakers are taken from Shapley et al. (2016), Vanzella et al. (2010, 2016), Bian et al. (2017), Fletcher et al. (2019), Rivera-Thorsen et al. (2019), and Marques-Chaves et al. (2021, 2022). The individual detection at z = 1.42 from Saha et al. (2020) is indicated by the gray filled circle.
Download figure:
Standard image High-resolution image6.1. IGM Attenuation Models
Since the average IGM absorption of LyC by hydrogen at a given redshift is often stronger than individual sight lines for LyC-detected galaxies, we explore the two IGM attenuation codes of Inoue et al. (2014, hereafter I14) and Bassett et al. (2021, hereafter B21) to model the distributions of IGM attenuation integrated through various sight lines at the redshifts of our LyC leakers. Both models use the Monte Carlo method to simulate the various sight lines, integrating the cumulative effects of damped Lyα absorbers (DLAs), Lyman limit systems (LLSs), and the Lyα forest (LAF) through the IGM at some redshift, using the spatial and density distribution statistics of these absorbers.
The most notable differences between these two codes are the absorber distribution parameters. The B21 model adopts the distributions of Steidel et al. (2018), which in turn uses H i distribution data from the Keck Baryonic Structure Survey (Steidel et al. 2004, 2010, 2014; Rudie et al. 2012; Strom et al. 2017) and also includes an optional circumgalactic medium (CGM) correction based on data from Rudie et al. (2013), while I14 uses LyC photon mean-free path data from Prochaska et al. (2009), O'Meara et al. (2013), Fumagalli et al. (2013), and Worseck et al. (2014). The parameters are summarized in Table 1 of I14 and Table 11 of Steidel et al. (2018) for the B21 model. In I14, the distributions for DLAs and LAF are computed separately and summed, while B21 use a piecewise function for the absorber distributions based on absorber density and adds the optional CGM absorption, which we do not include. These differences can lead to a higher IGM transmission in the B21 model at z ≃ 3–4 versus I14 due to the bimodal peaks in the transmission distribution of the B21 model. Furthermore, as discussed in B21, LyC detections from galaxies at z ≃ 3–4 are more likely unimodal with transmission values peaking near 100%.
At the redshifts of our galaxies, we see the opposite effect, again due to the absorber distribution statistics. I14 uses an equivalent DLA redshift-distribution power law as B21 at our redshift range of interest; however, I14 uses as a softer-density distribution power law for DLAs (g(NH I) ∼  versus g(NH I) ∼
  , where g(NH I) represents the NH I density distribution; see I14). This results in fewer dense absorbers (
 ≲ 21) in the line of sight for the I14 model. We show the Astrosat UVIT F154W filter-weighted transmission for all unique redshifts and fesc distributions of our LyC leakers for both codes in Figure 4. The transmission (T = e−τ
) and fesc columns in Table 1 correspond to the mean T and fesc, which are averaged over all lines of sight for the respective IGM models. The mean transmission for the I14 model used in this work is ∼0.57, while the same for the B21 model is ∼0.33. These transmission values are comparable to the transmissions of LyC at higher redshift, e.g., at z ∼ 3–4 B21. However, the LyC transmission in B21 is with respect to rest wavelengths of 880–910 Å, whereas the LyC wavelength probed in this work is ∼650 Å, a region of the LyC spectrum in which the transmission is lower.
≲ 21) in the line of sight for the I14 model. We show the Astrosat UVIT F154W filter-weighted transmission for all unique redshifts and fesc distributions of our LyC leakers for both codes in Figure 4. The transmission (T = e−τ
) and fesc columns in Table 1 correspond to the mean T and fesc, which are averaged over all lines of sight for the respective IGM models. The mean transmission for the I14 model used in this work is ∼0.57, while the same for the B21 model is ∼0.33. These transmission values are comparable to the transmissions of LyC at higher redshift, e.g., at z ∼ 3–4 B21. However, the LyC transmission in B21 is with respect to rest wavelengths of 880–910 Å, whereas the LyC wavelength probed in this work is ∼650 Å, a region of the LyC spectrum in which the transmission is lower.
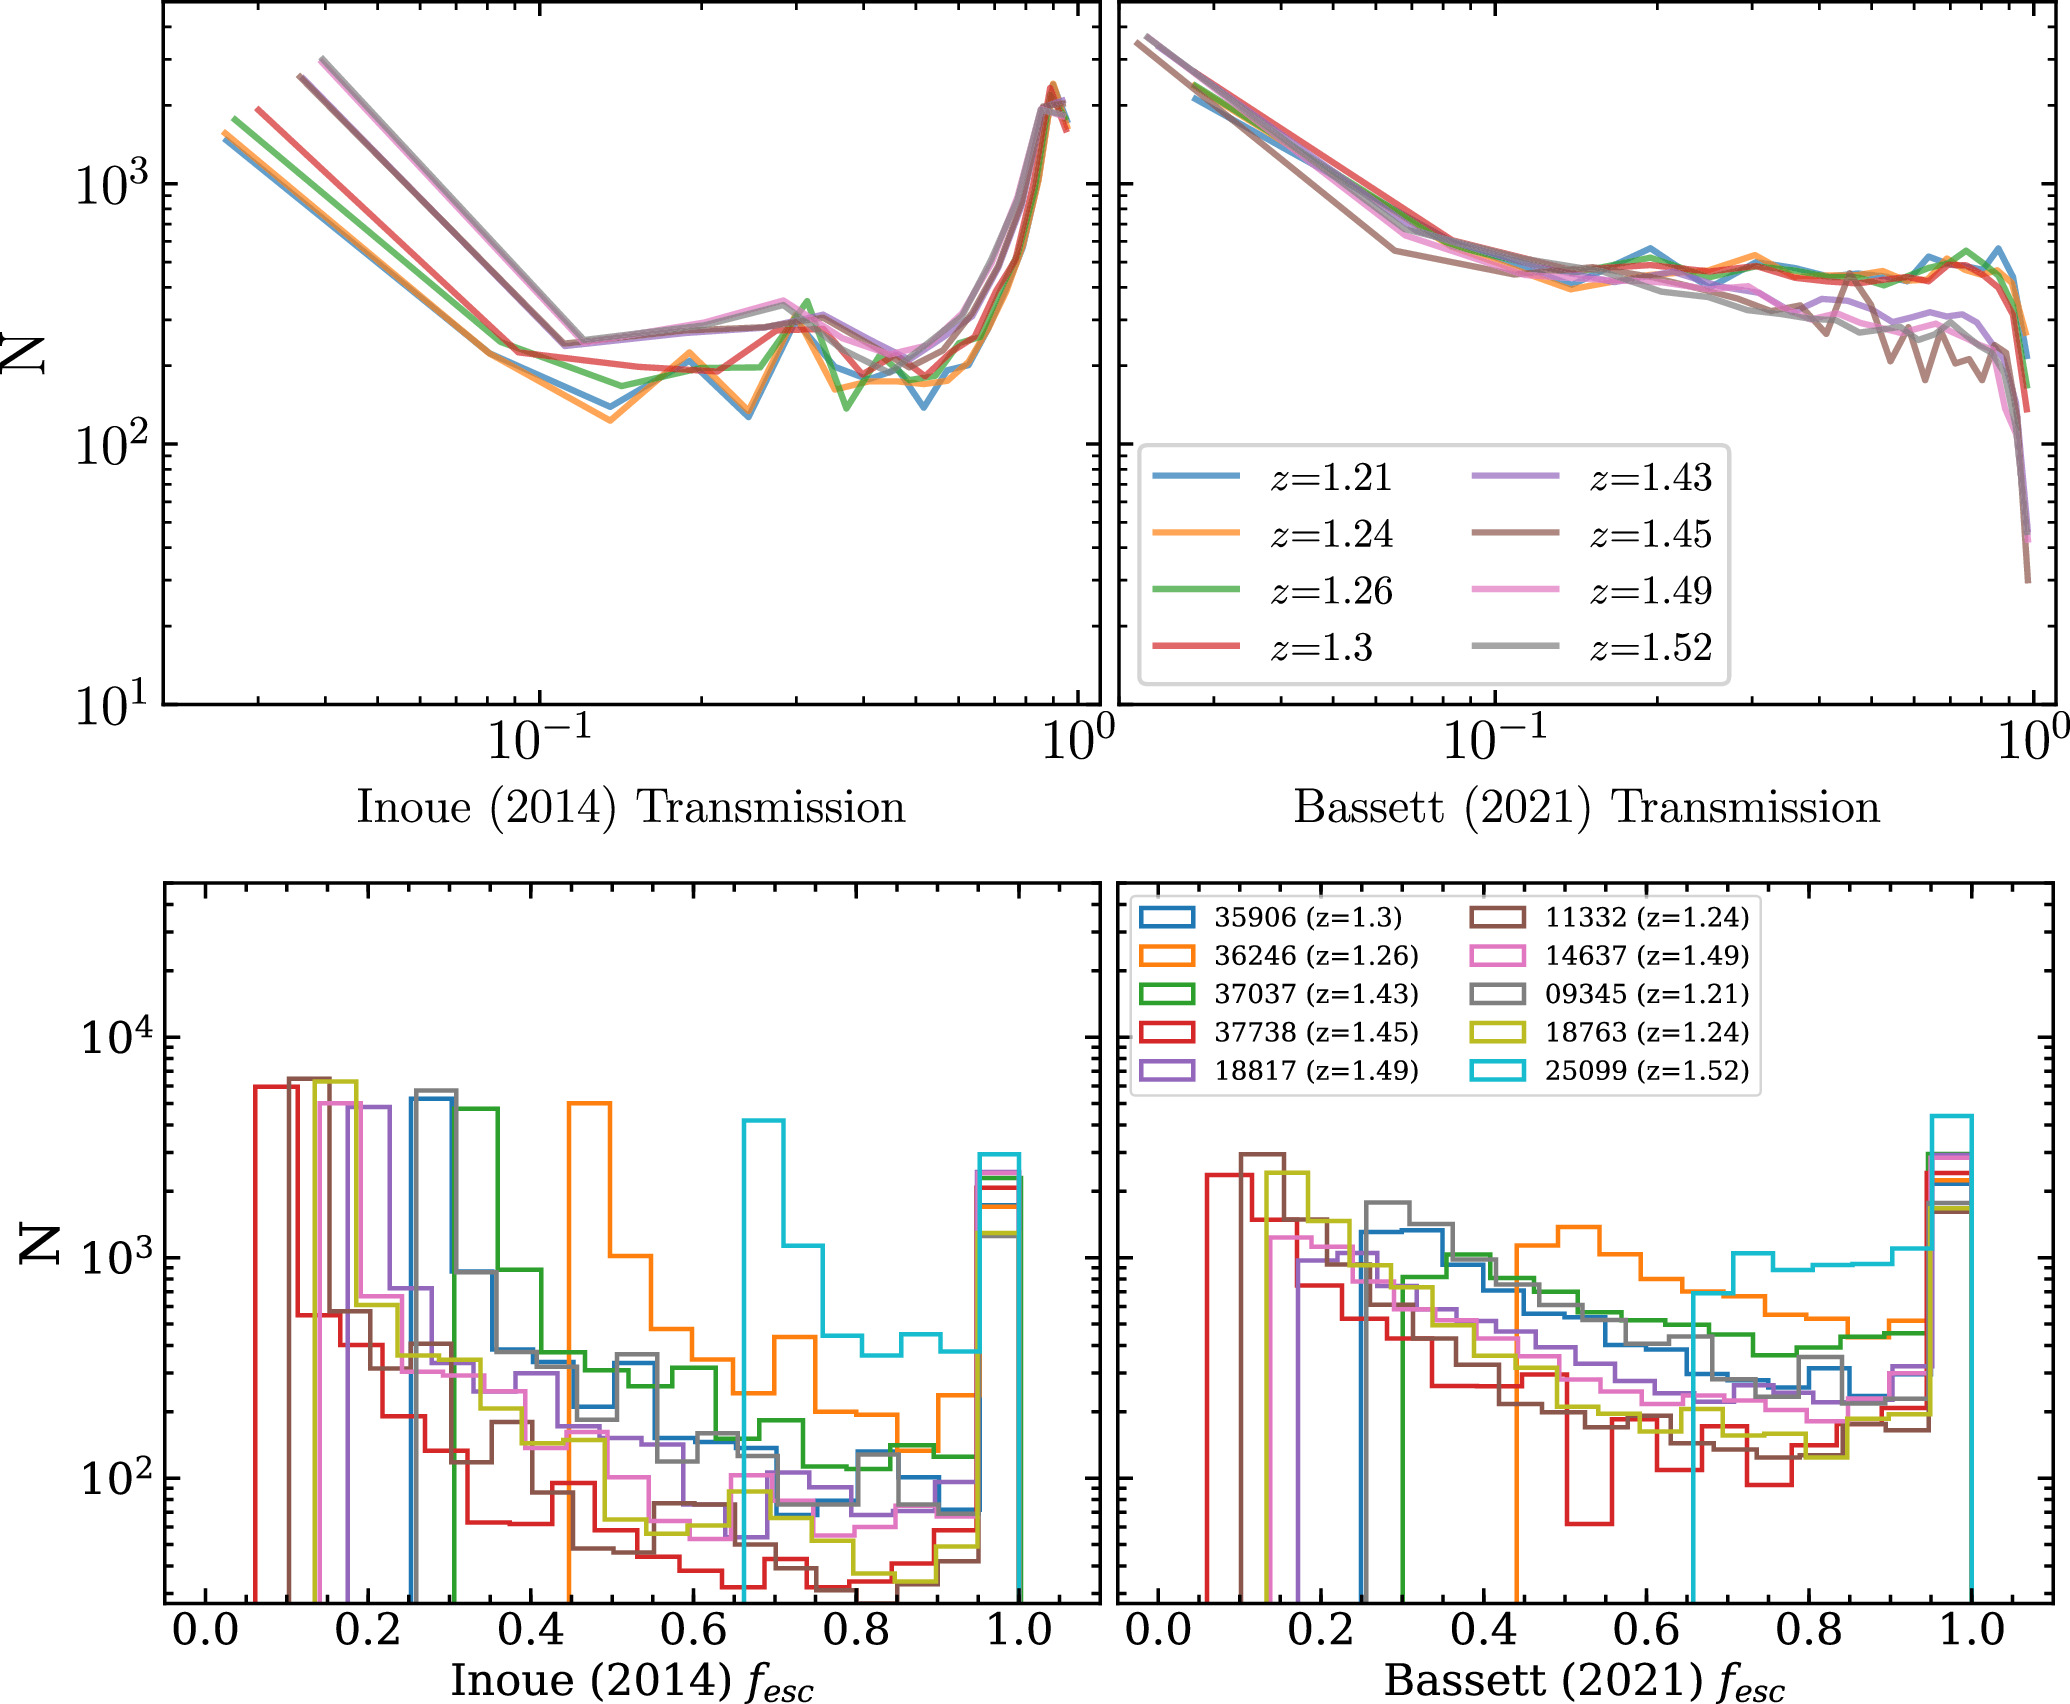
Figure 4. Top: the UVIT F154W-weighted IGM transmission distributions of I14 and B21 for the redshifts corresponding to the LyC leakers. Each curve was binned according to Freedman–Diaconis. The I14 simulations resulted in more clear sight lines compared to B21 for the same redshifts, which would result in lower fesc (see Equations (2) and (3)). Bottom: escape fraction distribution of the LyC leakers using IGM attenuation models from I14 on left and B21 on the right.
Download figure:
Standard image High-resolution image7. Extended LyC Emission
Previous works have indicated that the ionizing LyC and non-ionizing UV emissions can originate from different regions in SF galaxies (Iwata et al. 2009; Vanzella et al. 2010, 2012). Some of the LyC leakers in our sample show extended LyC emission beyond the UVIT PSF FWHM or off-centered emission (≳1'') with respect to the optical and the N242W band. The typical offset with respect to the optical centroids (estimated from HST F435W band) is ∼08, while it is >16 for two cases (see Figure 5). Note that the rms of the astrometry in UVIT images is ∼025 (Mondal et al. 2023).

Figure 5. LyC leakers having off-centered or extended emission in FUV 154W band. The sequence and symbols are the same as in Figure 1. Spurious sources (see Section 4) are highlighted by dashed black squares in the F154W band. We quote the magnitude (S/N) of such sources from top to bottom. On the first row, peaks in the north and northeast are due to sources observed in HST F435W (not seen in the 10'' × 10'') cutouts shown; third row in the northwest, southwest, and southeast have magnitudes (S/N): 26.61 (2.56), 26.42 (2.88), and 27.0 (2.01) respectively.
Download figure:
Standard image High-resolution imageIwata et al. (2009) found similar offsets in the UV continuum (UVC) and LyC for a sample of Lyα emitters and Lyman break galaxies at z ∼ 3, with substructures in the LyC. We do not identify any substructures in the LyC because of the resolution constraints; however, the offsets and extended emission are prominently seen. For size comparison, we show the HST F435W band images (which probes the rest frame ∼1500–2300 Å for the redshift range of our sample) convolved with UVIT F154W PSF in Figures 1 and 5. The ratio of LyC (F154W) to the UVC (F435W) are provided in Table 1. Our observed LyC-to-UVC ratio is on average higher than what has been reported in the literature (Steidel et al. 2018). However, it is worth noting that previous LyC studies such as those of Steidel et al. (2018) at z ∼ 3 probe LyC wavelengths at ∼900 Å and the UVC at 1500 Å, whereas in this work, the LyC wavelengths probed for the leakers is ∼600–700 Å, and the UVC corresponds to rest-frame wavelengths 1500– 2300 Å. It would be interesting to compare our observed ratio with the intrinsic ratio obtained from the best-fit intrinsic spectral energy distribution (SED) of these objects. We defer this exercise for the future.
We further produced the stack of the LyC signal of the six LyC leakers (the first six galaxies in Table 1 for which the LyC emission is within 16) from the HST centroids. To construct the stack, we consider 10'' × 10'' size sky-subtracted F154W band images of the objects. We then mask neighboring sources outside a 16 aperture radius from the centroid of the source using segmentation maps produced by SExtractor with a 1σ detection threshold. The stacked image is then produced by the average count rate of the six LyC leaking galaxies. The stacked LyC shown in Figure 6 has a total flux of 2.75 × 10⁻⁴ c s−1 within the 16 aperture corresponding to S/N ≃ 7.49 and σ ≃ 3.0 × 10⁻⁶ c s−1.

Figure 6. The stacked image of LyC (FUV F154W) of the six LyC leakers having emission within UVIT PSF FWHM ∼ 16.
Download figure:
Standard image High-resolution imageIn previous studies by Smith et al. (2018, 2020), flat LyC profiles have been observed with average stacked LyC profiles of galaxies and weak AGNs where they associate the noncentral LyC emission to the porous IGM and scattering process LyC photons undergo prior to the escape. Because of the resolution constraints, we do not attempt to produce the surface brightness profile of the LyC here. Three of the galaxies show even larger offsets in LyC emission from the F160W centroids and extended emission. In Figure 5, we show these three galaxies and their spectra. Although the galaxies show very extended and off-centered emission and the source of emission could be debatable, there are no nearby sources that could be considered as possible sources of emission. Therefore, the extended emission is most probably from the host galaxies. The spatial distribution of the LyC-emitting sources from that of non-ionizing UV-emitting stars can cause these offsets.
8. Foreground Interlopers and AGN Diagnostics
As mentioned in Section 2.3, the final sample of ten LyC leakers is chosen such that there are no nearby sources within a radius of 12 in the HST images (see third panel of Figures 1 and 5). However, some fields are crowded, and surrounding objects, although not within 12, are close to the LyC sources. In Figures 1 and 5, the neighboring sources are shown by dashed magenta circles on the HST F160W images. The photometric redshifts of the nearest sources are also given in magenta. The surrounding sources detected in HST detection images do not have emission in the FUV band as observed in all the middle image panels in Figures 1 and 5. Also, the possibility of contamination from objects in the line of sight can be ruled out as the spectra do not show any other lines than the Hα and O[iii]5007 and the redshifts estimated from the grism spectra match with the photometric redshift from the Skelton et al. (2014) catalog. Hence, the estimated escape fraction is unlikely to be contaminated by the neighboring or foreground sources.
To check if any of the objects in our sample are possible AGNs, we explored the X-ray archival data. We find that one of the sources from the sample is identified as an AGN in the 2 Ms Chandra Deep Field-North Catalog (Xue et al. 2016). The other nine sources are classified as normal galaxies.
9. Possibility of More LyC Emitter Candidates in the AUDFn
There are 20 sources in the short-listed sample of 39 galaxies having 2.5 < S/N < 3 (see S/N histogram in Figure A3). Considering the flux of the faintest source of the 20 galaxies and a mean local background, we estimate exposure time so that the sources have an S/N > 3. With an observation with effective exposure time >46 ks in FUV, the 20 sources would be above S/N 3. Thus, we predict the possibility of tens or more LyC detections in the AUDF fields in the upcoming observations and the capability of UVIT.
10. Summary
Using the deep imaging from UVIT and the grism spectra from the 3D-HST survey, we report the direct detection of LyC emission from ten sources (nine galaxies and one AGN) in the GOODS-North field. The reported LyC leakers are at the redshift of 1.0 < z < 1.6, near the epoch when the cosmic star formation peaked. Using two IGM attenuation models, we provide the absolute LyC escape fraction of the detected LyC emitters. The LyC emission is seen to be off-centered and extended as compared to the optical counterpart in most of the sources in the sample. The rest-frame UV wavelengths of the LyC leakers are found to be in the EUV regime (550–700 Å), far below the Lyman limit (912 Å) studied to date. Further, we also predict the possibility of at least tens or more LyC detections in the Astosat UVIT deep fields, which would be possible with upcoming observations.
Acknowledgments
S.D. and K.S. acknowledge support from the Indian Space Research Organisation (ISRO) funding under project PAO/REF/CP167. This publication uses the UVIT data obtained from the Indian Space Science Data Centre (ISSDC) of ISRO, where the data for AstroSat mission is archived. The UVIT project is a collaboration between IIA, IUCAA, TIFR, ISRO from India and CSA from Canada. This work is based on observations taken by the 3D-HST Treasury Program (GO 12177 and 12328) with the NASA/ESA HST, which is operated by the Association of Universities for Research in Astronomy, Inc., under NASA contract NAS5-26555.
Facilities: HST (WFC3) - , ASTROSAT(UVIT) - .
Software: astropy (Astropy Collaboration et al. 2013), Source Extractor (Bertin & Arnouts 1996).
Appendix: Supplementary Plots and Table
Here, we provide some of the statistics and properties of the sample. The parameters used for generating the SExtractor segmentation maps are listed in Table A1. Table A2 represents the quantities derived from the spectral analysis of the grism G141 spectra of the LyC leakers. The line fluxes mentioned in Table A2 are corrected for foreground and internal extinction using Schlafly & Finkbeiner (2011) and UV β slope in Reddy et al. (2018), respectively. The SFR is obtained using the corrected Hα line flux following Kennicutt (1998) that employs the Salpeter initial mass function, whereas to estimate the sSFR, we use the SED stellar mass from Momcheva et al. (2016) catalogs.
Table A1. SExtractor Parameters Used for Detection and Photometry in F154W
| Parameter Name | Value |
|---|---|
| DETECT_MINAREA | 4 |
| DETECT_THRESH | 1.2 |
| FILTER_NAME | default.conv |
| DEBLEND_NTHRESH | 32 |
| DEBLEND_MINCONT | 0.01 |
| CLEAN_PARAM | 1.0 |
| PHOT_FLUXFRAC | 0.5 |
| PHOT_APERTURES | 6.71 |
| PHOT_AUTOPARAMS | 2.5, 3.5 |
| PIXEL_SCALE | 0.417 |
| BACK_SIZE | 9 |
| BACK_FILTERSIZE | 3 |
Note. DETECT_THRESH (1.2) is the relative detection threshold in terms of the background rms value above the mean local sky background.
Download table as: ASCIITypeset image
Table A2. Spectral Properties of the LyC Emitters
| Grism ID | R.A. | Decl. | z | Hα Flux | Hβ Flux | [O iii] Flux | Hα SFR | sSFR |
|---|---|---|---|---|---|---|---|---|
| (hms) | (dms) | (10−17 erg s−1 cm−2) | (M⊙ yr−1) | (Gyr−1) | ||||
| goodsn-33-G141-11332 | 12:36:43.42 | +62:11:51.56 | 1.24 | 44.69 ± 2.46 | 8.93 ± 7.86 | 52.93 ± 6.10 | 31.46 ± 1.73 | 7.37 ± 0.41 |
| goodsn-17-G141-36246 | 12:36:52.46 | +62:20:12.51 | 1.26 | 6.13 ± 1.55 | ⋯ | 12.78 ± 3.11 | 4.49 ± 1.14 | 3.65 ± 0.92 |
| goodsn-36-G141-25099 | 12:37:21.18 | +62:15:53.51 | 1.52 | 2.05 ± 1.45 | ⋯ | 15.83 ± 4.08 | 2.41 ± 1.70 | 1.18 ± 0.83 |
| goodsn-18-G141-37037 | 12:37:08.89 | +62:20:45.11 | 1.43 | 10.83 ± 1.46 | ⋯ | 18.28 ± 2.12 | 10.94 ± 1.47 | 6.90 ± 0.93 |
| goodsn-35-G141-18763 | 12:37:02.91 | +62:14:04.60 | 1.24 | 31.96 ± 3.01 | ⋯ | 23.51 ± 5.83 | 22.74 ± 2.14 | 3.52 ± 0.33 |
| goodsn-11-G141-09345 | 12:35:54.96 | +62:11:18.36 | 1.21 | 12.07 ± 2.67 | ⋯ | 8.58 ± 4.70 | 8.09 ± 1.79 | 3.37 ± 0.75 |
| goodsn-18-G141-37738 | 12:37:07.48 | +62:21:47.84 | 1.45 | 119.35 ± 2.67 | 24.96 ± 3.11 | 251.82 ± 3.81 | 124.45 ± 2.78 | 1.06 ± 0.02 |
| goodsn-17-G141-35906 | 12:37:11.62 | +62:19:58.62 | 1.30 | 15.52 ± 2.07 | 13.29 ± 4.41 | 41.06 ± 5.79 | 12.41 ± 1.66 | 6.51 ± 0.87 |
| goodsn-46-G141-14637 | 12:37:34.75 | +62:12:52.38 | 1.49 | 27.28 ± 2.47 | 14.29 ± 4.94 | 32.66 ± 4.62 | 30.34 ± 2.74 | 4.09 ± 0.37 |
| goodsn-24-G141-18817 | 12:36:40.52 | +62:14:03.57 | 1.49 | 23.44 ± 1.96 | 15.61 ± 3.04 | 78.74 ± 3.91 | 25.85 ± 2.16 | 19.16 ± 1.60 |
Note. Column (1): 3D-HST grism ID; column (2): R.A. in sexagesimal unit (hms; hh:mm:ss); column (3): decl. in sexagesimal unit (dms; dd:mm:ss); column (4): spectroscopic redshift; columns (5), (6), and (7): Hα-, Hβ -, and [O iii]line fluxes, respectively, in units of 10−17 erg s−1 cm−2, corrected for foreground and internal dust extinction; column (8): SFR in units of solar mass per year derived from corrected Hα-line flux; and column (9): specific star formation rate (sSFR) in units per gigayear.
Download table as: ASCIITypeset image
Figure A1 shows the 3D-HST grism footprint (blue polygon) over the UVIT F145W band image. The red circles represent the positions of the LyC leakers reported in the paper. Figure A2, left panel, shows the redshift distribution of the 178 short-listed candidates having Hα- and [O iii]-line flux S/N greater than 3 (blue histogram) and the 39 sources identified in UVIT F154W band (black histogram). In the right panel of Figure A2, we show the main-sequence relation (SFR versus stellar mass) for the ten LyC leakers along with the non-leaker galaxies at the same redshift (1 < z < 1.5). For SFR estimates of non-leakers we use the Hα-line fluxes from Momcheva et al. (2016) catalogs.

Figure A1. LyC leakers indicated by red circles in the UVIT AUDFn field. Blue polygon is the 3D-HST GOODS North spectral coverage.
Download figure:
Standard image High-resolution image
Figure A2. Left: redshift histogram of sources having Hα and O[iii] flux S/N > 3 and redshift <2 (Blue) and those having detection in UVIT FUV (39 sources) out of 178 sources selected from 3D-HST. Right: SFR–stellar mass plot of the LyC leakers (blue filled circles) along with other non-leaker galaxies (gray filled circles) at 1 < z < 1.5. The solid black line is a linear fit to the sample with a slope of 0.46.
Download figure:
Standard image High-resolution imageFigure A3 left panel shows the FUV 154W and N242W band magnitude distributions of the 39 sources identified in FUV 154W band of the 178 sources, while on the right is shown the F154W S/N histogram of the 39 sources.

Figure A3. Left: FUV magnitude distribution of clean sources having detection in UVIT FUV (39 sources) out of 178 sources selected from 3D-HST. Right: FUV S/N distribution of 39 clean sources.
Download figure:
Standard image High-resolution image