


Abstract
We present an early analysis on the search for high-redshift galaxies using the deepest public JWST imaging to date, the NGDEEP field. These data consist of six-band NIRCam imaging on the Hubble Ultra Deep Field Parallel 2 (HUDF-Par2), covering a total area of 6.3 arcmin2. Based on our initial reduction of the first half of this survey, we reach 5σ depths up to mag = 29.5–29.9 between 1 and 5 μm. Such depths present an unprecedented opportunity to begin exploring the very early universe with JWST. As such, we find high-redshift galaxies by examining the spectral energy distribution of all F444W detections and present 16 new z > 8.5 galaxies identified using two different photometric redshift codes: LePhare and EAZY combined with other significance criteria. The highest-redshift object in our sample is at  , which has a blue
  and a very low inferred stellar mass of M* = 107.4M⊙. We also discover a series of faint, low-mass dwarf galaxies with M* < 108.5M⊙ at z ∼ 9 that have blue colors, flat surface brightness profiles, and small sizes <1 kpc. Comparing to previous work in the HUDF-Par2, we find 21 6 < z < 9 candidates including two z = 8 major mergers. One of these merger candidates has an additional two z = 8 sources within 30'', indicating that it may form part of an overdensity. We also compare our results to theory, finding no significant disagreement with a few cold-dark-matter-based models. The discovery of these objects demonstrates the critical need for deeper, or similar depth but wider-area, JWST surveys to explore the early universe.
Export citation and abstract BibTeX RIS

Original content from this work may be used under the terms of the Creative Commons Attribution 4.0 licence. Any further distribution of this work must maintain attribution to the author(s) and the title of the work, journal citation and DOI.
1. Introduction
The James Webb Space Telescope (JWST) is quickly revolutionizing our view of the distant universe and our understanding of when and how galaxy formation occurred at the earliest times (Finkelstein et al. 2023; Naidu et al. 2022b; Castellano et al. 2022; Donnan et al. 2023; Adams et al. 2023b; Atek et al. 2023; Yan et al. 2023). One of its key capabilities is the ability to find and study high-redshift galaxies, perhaps even up to z = 16. These galaxies are extremely faint, and the limitations of past ground- and space-based telescopes have meant that galaxies at redshifts greater than around 11 have been nigh impossible to observe. With JWST's immense near-infrared sensitivity, we are now able to observe and study such galaxies in unprecedented detail.
Incredibly as it may seem at writing, to date the publicly available JWST data have not yet exceeded the Hubble Space Telescope (HST) in terms of depth. Therefore, it remains possible, or even likely, that there are many galaxies waiting to be discovered below the typical depths reached to date. JWST is designed to observe primarily in the infrared region, while HST observes primarily in visible and ultraviolet light. Most of the discoveries of distant galaxies thus far are due to this redder coverage, rather than any exceptional depth. However, JWST has a primary mirror that is over 2.5 times larger in diameter that that of HST. This provides an ability to probe deeper in the universe than Hubble and thus far has been an aspect of the parameter space that has not been explored in any detail beyond examples of gravitational lensing (e.g., Bhatawdekar et al. 2019; Diego et al. 2023; Hsiao et al. 2023; Pascale et al. 2022) or the limited publications from ultradeep GTO programs (e.g., Robertson et al. 2023; Curtis-Lake et al. 2023; Pérez-González et al. 2023). However, the NGDEEP project, which contains a deep NIRCam pointing of one of the Hubble Ultra Deep Field (HUDF) parallel fields, provides the first opportunity to explore the universe at an intrinsic depth greater than what Hubble has done to date.
There are many reasons for probing the universe at a deeper depth than we currently have with existing JWST programs. One reason is that, based on early JWST data, it appears that there may indeed be many more galaxies than expected during this epoch of reionization and beyond (Lovell et al. 2023). These early results demonstrate that we are finding candidate galaxies upward of z > 12 (Naidu et al. 2022b; Castellano et al. 2022; Donnan et al. 2023; Adams et al. 2023b; Atek et al. 2023; Yan et al. 2023). Some of these galaxies have possible confirmed spectroscopic redshifts (Curtis-Lake et al. 2023; Fujimoto et al. 2023) using NIRSpec observations. Although no firm conclusions regarding this are available, it is clear that more data are required to address this problem. As part of the parallel observations of the NGDEEP program, whose primary target is NIRISS spectroscopy of the HUDF, one of the parallel fields of the HUDF (Par2) has been observed longer and deeper than any public field to date with NIRCam. As such, this gives an excellent opportunity to probe the universe deeper than we have been able to do to date with JWST.
In this paper, we present the results of these new observations of high-redshift galaxies using the deepest data to date taken with JWST as part of the NGDEEP observations. Based on this deep NIRCam imaging, we have discovered 16 high-z galaxies from 8.5 < z < 16, and we present in this paper an examination of their properties in some detail. These properties include, beyond the discovery and measured redshifts of these galaxies, their stellar masses, UV slopes, and star formation rates (SFRs). We discuss how these quantities are measured and compare with previous JWST results for shallower fields. We find that these observations and follow-up ones of similar deep fields are revealing new insights into the formation and evolution of galaxies at the very earliest times. These observations are thus a key aspect toward understanding how galaxy formation progressed, the first time galaxies and stars formed, and initial aspects that drive the onset of star formation. We also discuss the implications of our findings for current theories of galaxy formation and evolution and what role they may play in reionizing the universe.
The structure of the remainder of this paper is as follows. In Section 2, we describe the NGDEEP observations and our reduction, including problems we faced with this unique data set owing to its depth. We also describe the data products derived from this new data set that we have created. In Section 2.3 we describe our selection procedure undertaken to define a robust sample of galaxies with redshifts z > 8.5. In Section 3 we present an analysis of the properties of the galaxies we have found. We discuss our results in the context of previous studies and theory in Section 4, and we present a summary of our findings in Section 5. Throughout this work, we assume a standard cosmology with H0 = 70 km s−1 Mpc−1, ΩM = 0.3, and ΩΛ = 0.7 to allow for ease of comparison with other observational studies. All magnitudes listed follow the AB magnitude system (Oke 1974; Oke & Gunn 1983).
2. Data
The Next Generation Deep Extragalactic Exploratory Public (NGDEEP; 4 PID: 2079; PIs: S. Finkelstein, Papovich and Pirzkal) survey is a public ultradeep field that was planned for observations in late January/early February of 2023. Papers from the NGDEEP team themselves include Bagley et al. (2023) for the survey parameters and G. Leung et al. (2023, in preparation) for the NIRCam data description. The primary observation consists of NIRISS wide-field slitless spectroscopy of galaxies within the Hubble UDF. Due to a temporary observation suspension of NIRISS during the observation window of the survey, only 50% of observations were taken, with the second half expected in early 2024. Even with this limitation, NGDEEP's NIRCam data in the HUDF Parallel 2 (HUDF-Par2) are the single deepest public NIRCam observation undertaken in the first 12 months of JWST's operations. These NIRCam observations consist of six wide-band NIRCam photometry in three short-wavelength (SW; F115W, F150W, F200W) and three long-wavelength (LW; F277W, F356W, F444W) filters. These were taken over 98 ks (F115W), 93 ks (F444W), and 30–42 ks (F150W, F200W, F277W and F356W) of exposure from a combination of SHALLOW4 and DEEP8 readout patterns. Below we describe the data reduction procedures we use, as well as the method for finding the high-redshift galaxies in this field.
2.1. Data Reduction Process
We use our own data reduction pipeline first presented in Adams et al. (2023b). Our process consists of running the standard JWST pipeline with some minor modifications (pipeline version 1.8.2 and calibration pmap 0995). Between Stages 1 and 2 of the pipeline we apply a correction for 1/F noise and subtract templates of artifacts known as "wisps" from the F150W and F200W imaging. For Stage 2, background subtraction is turned off and replaced with our own two-dimensional subtraction using photutils (Bradley et al. 2022). The images are aligned by using 11 objects that lie within the NIRCam footprint cross-matched to the Gaia DR3 database (Gaia Collaboration et al. 2023). We note that the number of Gaia stars in the field is small; further refinement of the world coordinate system (WCS) is therefore likely required (e.g., by comparing with wider-field HST or ground-based data) when considering potential follow-up of these sources with precise instruments like NIRSpec. To ensure that all NIRCam imaging is self-aligned, we further tweak the WCS of the images to align the brightest 200 objects in the field using the F444W band as the baseline for this.
The NGDEEP observations are split into three visits; we find that visit 3 has a WCS error of approximately 0 7. This resulted in an F200W image offset from the others by 07 and an F356W image containing duplicate objects because its observations were split over multiple visits (such a WCS fault has previously been reported in PRIMER visit 20 of the COSMOS-2 field). We subsequently process visit 1 and 2 images of F356W together and Visit 3 separately. We then correct the visit 3 WCS to match the combined visit 1 and 2 images before stacking these two mosaics together to form the final image (see Figure 1). For the F115W filter, the data volume is large and the final stage of the JWST pipeline struggled to process it. We subsequently split this field into three equal-sized chunks for processing and stacked the final results at the end.
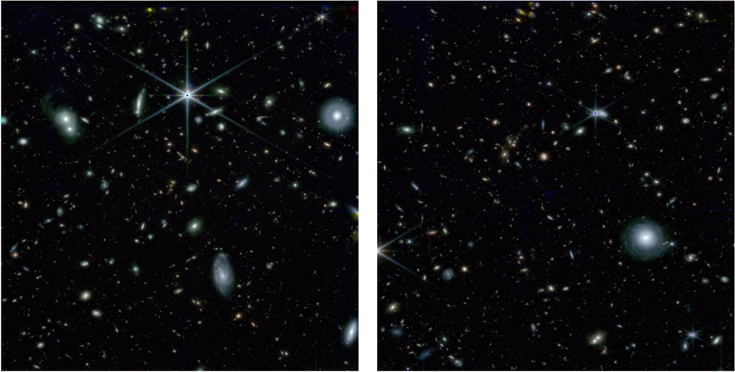
Figure 1. An RGB composite of the NGDEEP field after our reduction (R:F444W, G:F277W, B:F200W). Before we carry out our analysis, we mask the stars and other bright, foreground galaxies to obtain accurate depths and remove potential spurious detections from our catalogs. We note the locations of the commonly referred to modules A (left) and B (right).
Download figure:
Standard image High-resolution imageDue to the depths reached in our reduction, the F150W and F200W filters appear to be limited by the quality of wisp artifact templates that are available. Through experimentation, we discovered that using the initial wisp templates generated by STScI staff in mid-2022 resulted in the affected band having an elevated background noise originating from the templates themselves. This left these modules (particularly modules A4 and B3) up to 1 mag shallower than the modules that do not require a wisp correction. Upgrading the wisp templates to those released at the end of 2022 resulted in a 0.15–0.2 mag improvement in the depths, but indications are that these bands are still limited by the wisp removal process and further fine-tuning will be needed in the future.
2.1.1. Source Extraction
To locate galaxies, we then run SExtractor (Bertin & Arnouts 1996) with the parameters described in Adams et al. (2023b) to obtain forced photometry using F444W as the selection band in 016-radius circular apertures. This allows us to observe any potential high-z galaxies while retaining faint, lower-redshift, blue galaxies owing to the low signal requirement of SExtractor to extract the source. After the images have passed through our full JWST reduction pipeline, we manually mask the shallower outer edges of the image (∼150 pixels deep), the NIRCam detector gap in the F115W images, and prominent stellar diffraction spikes and large foreground extended sources that may introduce contaminant flux or false detections. We find that the total unmasked area is  .
.
2.1.2. Depth Calculation
We calculate local depths by placing empty 032-diameter apertures at an approximately constant density in the blank regions of sky in each band, as determined by both our image mask and SExtractor segmentation map. Taking the closest 200 apertures to each source in our SExtractor catalog, we recalculate our photometric errors as the normalized median absolute deviation (NMAD) of the aperture fluxes to include the correlated noise between image pixels, leaving a minimum 5% error to account for future potential zero-point (ZP) issues and other biases. We calculate the average depth over subregions of the NGDEEP field by averaging the local depths measured for sources within those regions. A breakdown of these measurements is presented in Table 1.
Table 1. Mean 5σ Depths Calculated in 032-diameter Apertures Placed in Empty Regions of the Unmasked Area of the GO NGDEEP Pointing
| NIRCam Filter | F115W | F150W | F200W | F277W | F356W | F444W |
|---|---|---|---|---|---|---|
| Outer modules | 29.65 | 29.75 | 29.65 | 29.80 | 29.75 | 29.60 |
| Inner modules | 29.65 | 29.25 | 29.30 | 29.80 | 29.75 | 29.55 |
| Module A | 29.65 | 29.55 | 29.45 | 29.70 | 29.70 | 29.50 |
| Module B | 29.65 | 29.50 | 29.55 | 29.90 | 29.80 | 29.60 |
| Average | 29.65 | 29.50 | 29.50 | 29.80 | 29.75 | 29.55 |
Note. We show the depths broken down by subgroups of NIRCam modules. We find that the central four F150W and F200W modules are significantly shallower than the outer modules. This is likely due to the need for a more precise wisp removal technique. For the red bands, we find the upper center region of module A (spanning a large region around the very luminous star) to be slightly shallower.
Download table as: ASCIITypeset image
To estimate how much deeper our data are compared to previous surveys, we have compared in Figure 2 the number counts in the F277W band with the GLASS, CEERS, and SMACS 0723 fields. As can be seen, there are some differences in the number counts between these different fields, in part due to cosmic variance. However, it can also be seen that the NGDEEP field is half a magnitude deeper in these number counts than in these previously released public data.
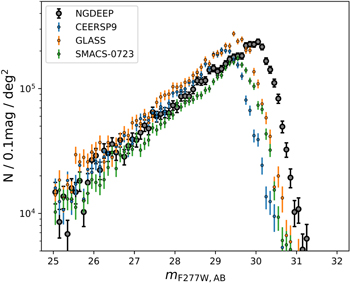
Figure 2. Source counts within the NGDEEP F277W filter in comparison to a selection of other public imaging reduced following the same pipeline. These include SMACS 0723, GLASS, and the deepest pointing (P9) of CEERS. We observe the expected result that NGDEEP is around 0.5 mag deeper than GLASS, which has 5σ depth of 29.15 in F277W. See Adams et al. (2023b) and C. Conselice et al. (2023, in preparation) for a full discussion of the depths of various public NIRCam data sets, including SMACS 0723, GLASS, and CEERS. Displayed errors are purely Poissonian, and we do not consider the contribution of cosmic variance here.
Download figure:
Standard image High-resolution imageThe nature of the NGDEEP observing program is such that NIRISS is the primary instrument and NIRCam is secondary. As a consequence of this, the NIRCam observations are broken up into nonuniform exposures using a variety of readout modes and exposure lengths. This makes it difficult to estimate the true expected depth of the images. We conduct a simple estimation using only the DEEP8 readouts for the half of the program observed to date. We obtain the following expected depths: F115W = 29.85, F150W = 29.70, F200W = 29.80, F277W = 30.0, F356W = 30.0, F444W = 30.2. The F150W and F200W are the closest matching, and we believe that issues within these bands are primarily due to the limitations of the wisp removal techniques employed. This is due to the wisp templates being derived from shallower data sets. The other bands are around 0.2 mag too shallow, and F444W is significantly worse.
Private communication with various astronomers working in this area indicates that these issues are not limited to just our reduction procedure. Discussions include the choice of dithering patterns employed (with the current setup using three 0415 steps) and the tactic to use small NGROUPS and a large number of integrations in the NIRCam setup. We note that other ultradeep programs, such as UNCOVER (Bezanson et al. 2022, 5σ depth 29.25–29.75 and 30.05–30.18 in JWSTs NIRCam LW and SW broadband filters in 016- and 008-radius circular apertures, respectively) and the MIRI deep field GTO (Pérez-González et al. 2023) do not appear to have these issues and employ the use of 8- or 10-point dithering patterns and also use large NGROUPS as opposed to the number of integrations (only one or two integrations compared to the seven of NGDEEP). More work is required in order to fully understand and exploit these new ultradeep data, especially upon the arrival of data from the second epoch of observations.
2.1.3. Aperture Corrections
Although we do not point-spread function (PSF) homogenize within the image, we do perform aperture corrections using the PSF of each NIRCam band taken from WebbPSF (Perrin et al. 2014). Our apertures contain ∼70%–80% of the total flux, producing a 0.25–0.4 mag increase in point-source brightness compared to the raw, non-aperture-corrected photometry from the SExtractor runs. In addition, we account for the fact that some of our sources are not point-like in nature using the "AUTO" aperture sizes from SExtractor when calculating certain physical properties (see Section 3 for more details).
2.2. Photometric Redshifts
We use the LePhare and EAZY SED fitting codes to determine redshifts, as well as the size of the Lyman break and the significance of detections in various bands. We outline the setup of LePhare and EAZY below.
2.2.1. LePhare
To calculate preliminary photo-z's, we run our photometric catalog with updated local depth errors through the LePhare SED fitting code (Arnouts et al. 1999; Ilbert et al. 2006). We use the BC03 (Bruzual & Charlot 2003) stellar population synthesis (SPS) template set with both exponentially decaying and constant star formation histories (SFHs) with 10 characteristic timescales between 0.1 Gyr < τ < 30 Gyr and 57 different ages between 0 and 13 Gyr, with fixed metallicities Z = {0.2, 1.0} Z⊙. The redshift range allowed is 0 < z < 25, and we apply dust extinction to these templates up to E(B − V) < 3.5 in order to account for potential dusty lower-z contaminants (e.g., Naidu et al. 2022a; Zavala et al. 2023). Attenuation from the intergalactic medium (IGM) follows the treatment derived in Madau (1995). LePhare's emission-line treatment is also turned on.
2.2.2. EAZY
We use a second SED fitting tool, EAZY (Brammer et al. 2008), to confirm our photometric redshifts. We use the default flexible stellar population synthesis (FSPS) (Conroy & Gunn 2010) templates (tweak_fsps_QSF_12_v3), along with six additional templates from Larson et al. (2022). These templates have been shown to better reproduce the blue colors and β slopes of high-z galaxies. The FSPS templates also include a better treatment of emission lines than the BC03 templates, as some high-z galaxies have been shown to have high equivalent width (EW) emission lines, which can boost photometric measurements by as much as a magnitude.
2.3. Sample Selection
Based on these photo-z's, we select galaxies using a tiered system to determine "robust" and "good" galaxy candidates. The criteria for inclusion in these samples are as follows: (1) The galaxy must be 5σ detected in the two bands immediately redward of the inferred Lyman break and less than 3σ detected in the bands blueward of the Lyman break. (2) The integrated probability density function across the primary peak must include more than 60% of the total probability, integrated over ±10% of the photometric redshift. (3) Any secondary, low-redshift solution must have a peak probability <50% of the primary solution. (4) The primary fit must have a  to be considered robust (good). (5) The above criteria are cross-checked with the results using the second photo-z code EAZY.
In addition, we remove any potential hot pixels from our sample by comparing the SExtractor "FLUX_RADIUS" parameter to simulated WebbPSF (Perrin et al. 2014) PSFs in each band, removing sources that are considerably smaller than the NIRCam PSF FWHMs. Such artifacts in the red NIRCam modules can mimic z = 16–20 photometry.
Finally, we perform a final visual check of our source cutouts, removing the original NGD-z10b object from our final sample and introducing a caveat for NGD-z8e owing to it being within a large resolved structure. We also note that NGD-z10d has significant structure within its 30 × 30 pixel cutout. NGD-z9a is ∼05 from what appears to be a bright z ∼ 2.3–2.4 disk galaxy, and NDG-z9b and NGD-z10a have nearby blue sources, although we retain these in our final sample. A summary of our NGDEEP galaxy samples, including photometry, photo-z's, and galaxy properties, is shown in Table 2. Template fits, band cutouts, and redshift probability distribution functions (pdf's) are shown in Figure 3.
5

Figure 3.
LePhare/EAZY SEDs for a selection of galaxies from our sample. Top left: our highest-redshift galaxy candidate at z = 15.6. Top right: our most massive and highest star-forming candidate. Bottom left: our singular overlapping candidate with Pérez-González et al. (2023) in the MIRI-DS. Bottom right: a blue dwarf candidate galaxy at z = 11.3. The colored lines show the best-fitting LePhare (blue) and EAZY (red) galaxy, as well as brown dwarf (green) and QSO (yellow) solutions from LePhare. Photometric data and local depth errors for each band are shown in black. LePhare/EAZY redshift pdf's are shown on the right-hand side of each plot, with  given for the best-fitting models. The pdf constraints and secondary solutions are also shown here. 30 × 30 pixel cutouts in each of the six wide-band NIRCam filters are shown at the bottom, with SExtractor "FLUX_RADIUS" shown in dashed blue and our 032-diameter apertures in white. The complete figure set, including sources removed from our sample (18 SEDs), is available in the online journal. (The complete figure set (18 images) is available.)
Download figure:
Standard image High-resolution imageTable 2. List of Our "Robust" and "Good" NGDEEP Galaxy Candidates Including Aperture-corrected F444W and F277W AB Magnitudes and Best-fitting Redshift and Stellar Mass from the LePhare Photo-z Code
| ID | R.A. | Decl. | mF444W | mF277W | zphot |

| β | SFR (M⊙ yr−1) | MUV | Ref. |
|---|---|---|---|---|---|---|---|---|---|---|
| "Good" Candidates | ||||||||||
| NGD-z11c a | 53.27765 | −27.86730 |

|

|

| 7.4 | −4.62
|

| −19.5
| ⋯ |
| "Robust" Candidates | ||||||||||
| NGD-z8a a | 53.23469 | −27.81583 |

|

|

| 8.4 | −2.51
|

| −18.1
| ⋯ |
| NGD-z8b a | 53.24248 | −27.80091 |

|

|

| 7.2 | −2.38
|

| −18.1
| ⋯ |
| NGD-z8c | 53.24889 | −27.82370 |

|

|

| 8.1 | −2.70
|

| −18.7
| ⋯ |
| NGD-z8d a | 53.25348 | −27.79953 |

|

|

| 8.2 | −3.37
|

| −18.3
| ⋯ |
| NGD-z8e c | 53.22565 | −27.80805 |

|

|

| 7.0 | −3.17
|

| −18.3
| ⋯ |
| NGD-z9a a | 53.23226 | −27.81636 |

|

|

| 9.9 | −0.69
|

| −21.0
| ⋯ |
| NGD-z9b a , b | 53.26099 | −27.81990 |

|

|

| 8.2 | −1.73
|

| −20.1
| ⋯ |
| NGD-z9c a | 53.24581 | −27.80590 |

|

|

| 7.9 | −3.07
|

| −18.4
| ⋯ |
| NGD-z10a a , b , f | 53.26392 | −27.81703 |

|

|

| 7.1 | −2.62
|

| −18.6
| ⋯ |
| NGD-z10c a | 53.27689 | −27.85060 |

|

|

| 8.2 | −3.31
|

| −19.4
| ⋯ |
| NGD-z10d a | 53.25872 | −27.80476 |

|

|

| 8.0 | −2.85
|

| −18.9
| ⋯ |
| NGD-z11a a | 53.26718 | −27.84890 |

|

|

| 9.1 | −1.61
|

| −19.2
| 5 |
| NGD-z11b | 53.24204 | −27.85508 |

|

|

| 7.3 | −2.64
|

| −19.0
| ⋯ |
| NGD-z12a | 53.26656 | −27.87658 |

|

|

| 8.9 | −2.12
|

| −18.9
| ⋯ |
| NGD-z15a | 53.24945 | −27.87572 |

|

|

| 7.4 | −3.02
|

| −19.2
| ⋯ |
| Cross-matches to Other Work in the HUDF-Par2 | ||||||||||
| NGD- z5a a | 53.25247 | −27.86365 |

|

|

| 8.1 | −1.52
|

| −18.2
| 4 |
| NGD-z5b a , f | 53.26377 | −27.85939 |

|

|

| 8.0 | −1.48
|

| −18.7
| 1 |
| NGD-z6a d | 53.25383 | −27.85336 |

|

|

| 7.3 | −1.18
|

| −17.6
| 1,2,4 |
| NGD-z6b a | 53.25810 | −27.86763 |

|

|

| 8.5 | −2.22
|

| −19.7
| 4 |
| NGD-z6c a | 53.25553 | −27.84818 |

|

|

| 9.2 | −1.59
|

| −19.5
| 2 |
| NGD-z6d a | 53.26985 | −27.84158 |

|

|

| 8.4 | −1.29
|

| −18.0
| 2 |
| NGD-z6e a | 53.25495 | −27.85379 |

|

|

| 9.4 | −1.94
|

| −20.0
| 1,4 |
| NGD-z6f | 53.27407 | −27.84893 |

|

|

| 7.9 | −4.14
|

| −18.4
| 4 |
| NGD-z6g a | 53.27251 | −27.85531 |

|

|

| 7.8 | −2.64
|

| −19.2
| 1,2,4 |
| NGD-z6h a | 53.25336 | −27.85896 |

|

|

| 8.9 | −2.62
|

| −19.5
| 2,4 |
| NGD-z7a | 53.27631 | −27.85609 |

|

|

| 7.9 | −2.28
|

| −19.1
| 3 |
| NGD-z7b e | 53.27735 | −27.86670 |

|

|

| ⋯ | ⋯ | ⋯ | ⋯ | 2,4 |
| NGD-z7c | 53.26937 | −27.86572 |

|

|

| 7.9 | −2.21
|

| −18.5
| 2 |
| NGD-z7d(i) a | 53.27954 | −27.85451 |

|

|

| 7.8 | −2.83
|

| −19.0
| (1) |
| NGD-z7d(ii) a | 53.27958 | −27.85454 |

|

|

| 7.9 | −2.34
|

| −18.8
| (1) |
| NGD-z8g(i) a , d | 53.26564 | −27.85555 |

|

|

| 9.2 | −2.28
|

| −20.5
| (1,3),4 |
| NGD-z8g(ii) a , d | 53.26556 | −27.85552 |

|

|

| 9.2 | −2.24
|

| −20.0
| (1,3),4 |
| NGD-z8h a | 53.26934 | −27.84812 |

|

|

| 8.5 | −3.11
|

| −20.3
| 3,4 |
| NGD- z8i a | 53.26577 | −27.85573 |

|

|

| 9.5 | −2.49
|

| −20.9
| 3,4 |
| NGD-z8j a | 53.26413 | −27.85015 |

|

|

| 8.1 | −2.55
|

| −18.9
| 3,4 |
| NGD-z9d | 53.26767 | −27.86934 |

|

|

| 9.8 | −1.55
|

| −19.2
| 3,4 |
Notes. Errors are the 16th and 84th percentiles of the distribution, with β, SFR, and MUV errors taken from our Markov Chain Monte Carlo fitting to the rest-frame photometry. Errors are not given for the stellar masses, as LePhare does not perform Bayesian SED fitting; however, we refer the reader to the typical 0.2–0.3 dex mass errors in Table 3. The "References" column shows the overlap of our candidates with (1) z850 Wilkins et al. (2011) dropouts, (2) z850 Bouwens et al. (2011) dropouts, (3) Y105 Bouwens et al. (2011) dropouts, (4) McLure et al. (2013) photo-z-selected sources, and (5) MIRI-DS Pérez-González et al. (2023) candidates, where parentheses indicate the literature studies where the merger candidates have not been identified as separate sources. Note that we fix the redshift of NGD-z8g (ii) to the EAZY solution.
a Rest-frame UV (optical) extended source correction has been performed for the UV properties (mass) of the galaxy following the prescription at the top of Section 3. b Indicates presence of a blue contaminant in close proximity to the object. c Source may be contaminated by a large resolved structure. d Candidate selected in F356W rather than F444W. e Potential cosmic ray present in F200W (no galaxy properties calculated). f EAZY Balmer break solution.Download table as: ASCIITypeset image
We show the distribution of (aperture-corrected) F277W aperture magnitudes for our sample in Figure 4. What we find is that many of our new galaxies are fainter than other previous photometric candidates, with the exception of those by Pérez-González et al. (2023). This is already revealing that these systems are of a different nature than the brighter galaxies seen in many previous surveys.
Due to the lack of F090W in the NGDEEP photometry, and without the initial inclusion of deep HST Advanced Camera for Surveys (ACS) data at 0.6 and 0.8 μm, we limit this work to galaxies at z > 8.5. The future inclusion of deep HST ACS data to produce full catalogs (other than the simple checks we do in Section 2.4) will enable HST-detected sources to be studied in greater detail. This includes z = 4–5 sources whose Balmer breaks may mimic Lyman breaks in shallower JWST fields and bright objects at redshifts 8.5 < z < 9.0 approaching our detection limit, such as our NGD-z9d, which is selected only when cross-matching to previous studies incorporating rest-frame optical HST data (see Section 2.3.1 for more details). In our comparison to simulations in Section 4, we note that the lack of blue HST data may be a cause of incomplete number counts toward this lower redshift limit owing to missing these bright galaxies with Lyman breaks falling within the bluest F115W NIRCam band.
2.3.1. Comparisons to Early HUDF Work
We compare our output catalogs with the z ∼ 7 (8) z850 (Y105) dropout galaxies identified in the work of Wilkins et al. (2011) and Bouwens et al. (2011), as well as photo-z-selected candidates from McLure et al. (2013). While these sources do not meet our strict selection criteria (due to the Lyman break not being entirely redward of the F115W band), NIRCam observations may be able to validate the HST-based redshift estimations for sources that overlap. We cross-match all of our sources within a search radius of 1'' and examine those with F115W (F150W) magnitudes close to that of the original HST J125-band (H160-band) measurements.
We successfully obtain 9, 16, and 15 cross-matches with Bouwens et al. (2011), Wilkins et al. (2011), and McLure et al. (2013), respectively, finding two sources lying on NIRCam stellar diffraction spikes (UDF092y-06391247 and UDF092z-04412250 in Bouwens et al. 2011) and one appearing to be impacted by a cosmic ray in F200W (UDF092z-06571598 in Bouwens et al. 2011). After cross-matching, we obtain F814W fluxes using the method explained in Section 2.4 and rerun our SED fitting with combined F814W and NIRCam photometry to alleviate the significant Lyman–Balmer degeneracy obtained using only NIRCam. Magnitudes, redshifts, and properties of these sources are listed in Tables 2 and 3. Figure 5 shows example SED fits associated with these cross-matches.
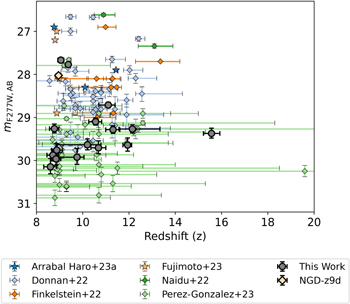
Figure 4. Comparison of our non-aperture-corrected F277W SExtractor magnitudes (in 032-diameter apertures) against LePhare redshift ("Z_BEST") showing the large number of faintly observed candidates we obtain. Literature results from CEERS (Finkelstein et al. 2023; Donnan et al. 2023; Arrabal Haro et al. 2023; Fujimoto et al. 2023), GLASS (Naidu et al. 2022b), and the semi-overlapping MIRI-DS (Pérez-González et al. 2023) are shown, where spectroscopic results are shown as stars and photometric results are shown as diamonds. The singular HST-selected source at z > 8.5 (NGD-z9d) is shown as a beige diamond.
Download figure:
Standard image High-resolution image
Figure 5.
LePhare/EAZY SEDs for our candidates obtained via cross-matching to Bouwens et al. (2011), Wilkins et al. (2011), and McLure et al. (2013) HST-selected candidates. Best-fitting galaxy, brown dwarf, and QSO solutions are shown as colored lines, with photometric data shown in black. Redshift pdf's and source cutouts are also shown. Left: the bluer source of the brighter z = 8 merger, forming part of a proposed protocluster. Right: one candidate member of the fainter z = 8 merger distinguished by the improved NIRCam resolution compared to HST's WFC3/IR used to identify the source in Wilkins et al. (2011). The complete figure set, including Balmer break galaxies at low z (21 5.9 < z < 9.0 and 4 0.8 < z < 1.8 SEDs), is available in the online journal. (The complete figure set (25 images) is available.)
Download figure:
Standard image High-resolution imageTable 3. Derived Stellar Masses and SFRs for Our Full Sample Using the Bayesian SED Fitting Tool Bagpipes
| ID | Delayed SFH | Exponential SFH | Constant SFH | |||
|---|---|---|---|---|---|---|

| SFR (M⊙ yr−1) |

| SFR (M⊙ yr−1) |

| SFR/(M⊙ yr−1) | |
| "Good" Candidates | ||||||
| NGD-z11c a |

|

|

|

|

|

|
| "Robust" Candidates | ||||||
| NGD-z8a a |

|

|

|

|

|

|
| NGD-z8b a |

|

|

|

|

|

|
| NGD-z8c |

|

|

|

|

|

|
| NGD-z8d a |

|

|

|

|

|

|
| NGD-z8e c |

|

|

|

|

|

|
| NGD-z9a a |

|

|

|

|

|

|
| NGD-z9b a , b |

|

|

|

|

|

|
| NGD-z9c a |

|

|

|

|

|

|
| NGD-z10a a , b , e |

|

|

|

|

|

|
| NGD-z10c a |

|

|

|

|

|

|
| NGD-z10d a |

|

|

|

|

|

|
| NGD-z11a a |

|

|

|

|

|

|
| NGD-z11b |

|

|

|

|

|

|
| NGD-z12a |

|

|

|

|

|

|
| NGD-z15a |

|

|

|

|

|

|
| Comparison to Other Work in the HUDF-Par2 | ||||||
| NGD-z5a a |

|

|

|

|

|

|
| NGD-z5b a , e |

|

|

|

|

|

|
| NGD-z6a d |

|

|

|

|

|

|
| NGD-z6b a |

|

|

|

|

|

|
| NGD-z6c a |

|

|

|

|

|

|
| NGD-z6d a |

|

|

|

|

|

|
| NGD-z6e a |

|

|

|

|

|

|
| NGD-z6f |

|

|

|

|

|

|
| NGD-z6g a |

|

|

|

|

|

|
| NGD-z6h a |

|

|

|

|

|

|
| NGD-z7a |

|

|

|

|

|

|
| NGD-z7c |

|

|

|

|

|

|
| NGD-z7d(i) a |

|

|

|

|

|

|
| NGD-z7d(ii) a |

|

|

|

|

|

|
| NGD-z8g(i) a , d |

|

|

|

|

|

|
| NGD-z8g(ii) a , d |

|

|

|

|

|

|
| NGD-z8h a |

|

|

|

|

|

|
| NGD-z8i a |

|

|

|

|

|

|
| NGD-z8j a |

|

|

|

|

|

|
| NGD-z9d |

|

|

|

|

|

|
Notes. Three different SFH parameterizations were adopted, consisting of a delayed exponential model (SFR ∝ te−t/τ ), an exponential model (SFR ∝ e−t/τ ), and a constant SFR, respectively. We observe a large dependence on SFH (as seen in, e.g., Labbé et al. 2023), with the constant SFH model giving consistently higher masses and lower SFRs than both the delayed and exponential models. These properties have been corrected for extended sources with flux beyond our fixed apertures where appropriate. We also show the results from the cross-matches to other candidates in the HUDF-Par2 by Bouwens et al. (2011), Wilkins et al. (2011), and McLure et al. (2013). Note that we exclude NGD-z7b from this table owing to a potential cosmic ray in F200W leading to poor-fitting Bagpipes SEDs. We also fix the redshift of NGD-z8g(ii) to the EAZY solution at z = 7.8.
a Rest-frame UV (optical) extended source correction has been performed for the UV properties (mass) of the galaxy following the prescription at the top of Section 3. b Indicates presence of a blue contaminant in close proximity to the object. c Source may be contaminated by a large resolved structure. d Candidate selected in F356W rather than F444W. e EAZY Balmer break solution.Download table as: ASCIITypeset image
High-redshift 5.9 < z < 9.0 solutions are measured for 21 sources, with LePhare and EAZY consistent to within 5%–10% for all but NGD-z5b, which has an EAZY Balmer break solution. One of these galaxies falls within our redshift range of interest (UDF092y-04242094); however, we do not select it as part of our high-z sample owing to its 5.9σ F115W detection coupled with our requirement of a nondetection blueward of the Lyman break. Additionally, four cross-matched objects (P34.z.2397, P34.z.3990, and P34.z.4501 from Wilkins et al. 2011, and UDF092y-03811034 from Bouwens et al. 2011) are observed as Balmer break galaxies in both LePhare and EAZY at 0.8 < z < 1.8. These low-z objects are not included in Table 2 or Table 3.
As a sanity check on the SED fitting for these sources, we compare to an F356W-selected catalog, finding that NGD-z6a is better centered in the aperture used for flux extraction and NGD-z8g is separated into two components. We conclude that NGD-z8g is likely a merging system of two extended sources at z = 8 separated by a proper transverse distance of 1.4 kpc, the 30 × 30 pixel cutout for which is shown in Figure 5. Since our LePhare solution for NGD-z8g (ii) at z = 7.3 is inconsistent with that of, and has a significantly larger χ2 than, the best-fit z = 7.8 EAZY solution, we rerun our LePhare SED fit for this source while fixing the redshift to that from EAZY. We find that both sources have similar β slopes and are intrinsically bright in the UV (−20.5 < MUV < −20.0). Spanning close to an arcsecond in size, this source is an ideal target for JWST's NIRSpec integral field unit (IFU) to study gas flow kinematics in early major mergers. Furthermore, with the higher resolution of NIRCam compared to Hubble's WFC3/IR, we detect P34.z.3996 from Wilkins et al. (2011) as two sources at z = 8 separated by 0.8 kpc, which is another potential merger within the HUDF-Par2.
We also note the proximity to NGD-z8g of both NGD-z8i (within 3'' ) and NGD-z8h (within 30'') , which may indicate that this is an overdense region forming a protocluster at z = 8 similar to those found by Laporte et al. (2022) and Morishita et al. (2023) in early JWST data.
2.3.2. Comparisons to the MIRI Deep Survey
The NIRCam NGDEEP observations are not the first to be conducted in the HUDF-Par2 field. The MIRI Deep Survey (PID: 1283; PI's Hans Ulrik Nrgaard-Nielsen, Göran Östlin) has conducted a four-band NIRCam survey to depths just deeper than magnitude 30, reporting 45 candidate high-z galaxies (Pérez-González et al. 2023). We find that only one of these galaxies enters our final sample, largely due to the low luminosities of the Pérez-González et al. (2023) sample failing our 5σ selection criteria with very poor SED fits. The brightest source in the overlap region (MDS011049, our NGD-z11a) is successfully recovered with a redshift of  compared to the first published redshift of
  . Our higher-redshift estimate is likely due to the addition of the F200W band in our study, which has a bright measured flux relative to the F150W band, indicating that the Lyman break is located partially through the F150W band and not blueward of the band. Since the Pérez-González et al. (2023) objects are selected as faint objects from their F277W NIRCam data with a 5σ depth of
  mag (in 015-radius circular apertures) as opposed to our shallower F444W-selected catalog, we find that few sources are successfully cross-matched. For those that are, the majority have a very low S/N and subsequently have poor SED constraints. This, coupled with the small overlapping area between MIRI-DS and the NGDEEP NIRCam footprint, means that we do not provide a further comparison of sources in this paper.
2.4. Cross-checking with Deep HST ACS F814W Data
As a straightforward check of the validity of our sample, we download deep F814W HST ACS data from version 2.0 of the Hubble Legacy Fields (HLF) program (Whitaker et al. 2019). These data cover  in the HUDF-Par2 and include
  overlap with HUDF-2012 data (HST Program ID 12498; PI: R. Ellis; Ellis et al. 2013; Koekemoer et al. 2013). We align with Gaia DR3 similarly to our NIRCam imaging and mask the image edges and stellar diffraction spikes before splitting the F814W observations into "deep" and "shallow" regions with/without HUDF-2012 overlap, finding median 5σ depths of 28.80 and 30.95 in 032-diameter apertures, respectively.
After combining both F814W and NIRCam image masks, we find a "shallow" F814W–NIRCam overlap of  containing three sources (8a, 9a, 12a) and a "deep" F814W–NIRCam overlap of
  containing 10 candidates (8c, 8f, 9b, 10a, 10b, 10c, 11a, 11b, 11c, 15a), constituting ∼70% (13/18) of our original high-z NGDEEP sample. Using the Python version of SExtractor (sep; Barbary 2016), we calculate F814W fluxes for each of our high-redshift candidates, and combining these with our local depths, we find 4.7σ and 3.0σ detections for NGD-z8f and NGD-z9b, respectively, with all other sources nondetected with S/N < 2σ.
To determine the impact of this, we rerun the combined F814W and NIRCam photometry through our robust pipeline and display the results in Tables 2 and 3. SED fits including the F814W photometry are shown in Figure 3, where the F814W cutout is rotated 69 9 counterclockwise compared to those from NIRCam. We note the following impact on our high-z galaxy sample: (1) NGD-z8f is removed owing to the significant F814W detection and the now prominent EAZY Balmer break solution; (2) NGD-z9b retains its high-redshift solution in both LePhare and EAZY regardless of its low-sigma F814W detection, which is possibly inflated owing to a nearby blue contaminant object; (3) NGD-z10a gains an EAZY Balmer break solution, but we retain it in our sample owing to the nondetection at the <2σ level in F814W.
3. NGDEEP High-z Galaxy Properties
As we perform our SED fitting using fluxes taken from fixed 032 apertures, we correct the derived masses and SFRs for extended sources using SExtractor's "FLUX_AUTO" with default "PHOT_AUTOPARAMS" parameters. This measurement captures ≳90% of the total flux of each object within an elliptical aperture derived from Kron's "first moment" algorithm (Kron 1980; Bertin & Arnouts 1996). We calculate mass and SFR correction factors from the ratio of "FLUX_AUTO" to our aperture-corrected aperture fluxes, using F444W for the mass and the band closest to the rest-frame UV at 1500 Å for the SFR and MUV. This ensures that we are obtaining the total light from these objects regardless of their size or morphology.
3.1. Stellar Masses, SFRs, and β Slopes
In this section we discuss the stellar masses, SFRs, and β slopes of our sample. These quantities are important for understanding the formation state and the physical mechanisms at play in these galaxies and how they relate to previously discovered populations.
We compare our stellar masses as derived from LePhare to stellar masses calculated from previous JWST work using the GLASS, SMACS 0723, and CEERS fields. Figure 6 shows the distribution of detected stellar masses versus redshift, where we compare to a variety of galaxies from early JWST studies and the 9 < z < 11 sample by Finkelstein et al. (2022) and Tacchella et al. (2022) in the HST Cosmic Assembly Near-infrared Deep Extragalactic Legacy Survey (CANDELS; Grogin et al. 2011; Koekemoer et al. 2011). Our stellar masses are calculated with a standard Chabrier (2003) initial mass function (IMF), and thus there could indeed be systematic deviations from true stellar masses in these calculations if the IMF is different at high redshifts. Regardless, this allows us to show how a standard measured stellar mass compares to these shallower surveys. What we can see is that with NGDEEP we are finding many more low-mass galaxies at z > 8.5, which, if these masses are accurate, puts these systems into the regime of dwarf galaxies. This is a sign that there are many more faint, low-mass galaxies at these high redshifts to discover in deep JWST data.

Figure 6. Corrected LePhare stellar masses as a function of redshift ("Z_BEST") for our NGDEEP candidates at z > 8.5. We find an abundance of low-mass galaxies, with ∼50% of our sample having LePhare masses M* < 108 M⊙. Our NGD-z9a is seen with M⋆ ≃ 1010 M⊙ and is comparable to the large masses found by Labbé et al. (2023) and Tacchella et al. (2022). LePhare does not perform Bayesian SED fitting; therefore, we do not include stellar mass errors here, although we note the typical 0.2−0.3 dex mass errors from our Bagpipes fits. Previous results from JWST are shown as stars (Curtis-Lake et al. 2023; Arrabal Haro et al. 2023; Fujimoto et al. 2023; Nakajima et al. 2023; Tang et al. 2023, spectroscopy) and diamonds (Naidu et al. 2022b; Bouwens et al. 2022; Labbé et al. 2023; Leethochawalit et al. 2022; Atek et al. 2023, photometry). We also show pre-JWST data from the HST CANDELS fields by Tacchella et al. (2022) and the stacked sample of Stefanon et al. (2023) from GOODS with mass calculated assuming a nonparametric SFH. The singular HST-selected source at z > 8.5 (NGD-z9d) is shown as a beige diamond.
Download figure:
Standard image High-resolution imageWe follow the procedure in, for example, Bhatawdekar et al. (2019) and D. Austin et al. (2023, in preparation) to calculate near-SED-template-independent (all but derived redshift) SFRs. We fit the rest-frame UV photometry (1216 < λrest/Å < 3000) while fixing the best-fitting redshift from LePhare with a power law of the form fλ ∝ λβ . This fit is conducted with the use of emcee (Foreman-Mackey et al. 2013) to obtain Bayesian errors. From this, we determine UV continuum slopes, β, directly and MUV by averaging the flux within a top hat of width 100 Å centered on 1500 Å applying the same UV correction factor outlined at the top of Section 3 for extended sources. From this rest-frame UV flux, we calculate the observed UV luminosity correcting for dust as per the Meurer et al. (1999) relation and convert to SFR using the Madau & Dickinson (2014) factor. Calculated masses and SFRs are shown in Table 2.
Our β slopes are plotted as a function of MUV in Figure 7. We notice that our calculated β slopes appear as expected, with the majority of our candidates having −3 < β < −1.5. Our NGD-z11c is surprisingly blue and far beyond the limit expected from our SED template sets. This could be a result of either photometric uncertainties, as noted in Cullen et al. (2023), or a system with increased Lyα continuum emission (Topping et al. 2022). We also show a comparison of our calculated MUV values as a function of z in Figure 8.
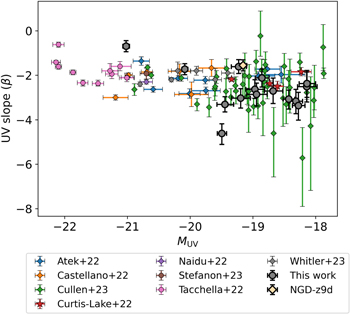
Figure 7. Ultraviolet continuum spectral slope (β) as a function of absolute UV magnitude (MUV) at z > 8.5 only. JWST galaxies are plotted as stars (spectroscopically confirmed; Curtis-Lake et al. 2023) and diamonds (photometric candidates; Naidu et al. 2022b; Castellano et al. 2022; Atek et al. 2023; Cullen et al. 2023; Whitler et al. 2023). We also show the bright HST CANDELS and stacked GOODS galaxies by Stefanon et al. (2023) and Tacchella et al. (2022) as brown and pink circles, respectively. We note here that the faint Cullen et al. (2023) sources have larger σβ , as they take into account redshift uncertainties that increase the errors by a factor 1.13. There is good agreement between the majority of our results and the previous literature, except for the extremely blue NGD-z11c and NGD-z9a, which are our intrinsically brightest and reddest candidates. The singular HST-selected source at z > 8.5 (NGD-z9d) is shown as a beige diamond.
Download figure:
Standard image High-resolution image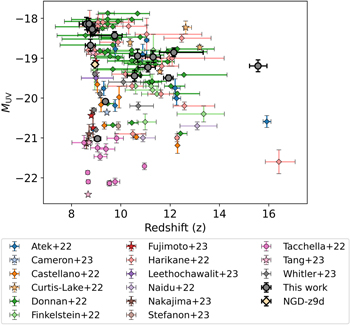
Figure 8. Absolute UV luminosity plotted against LePhare redshift ("Z_BEST") for z > 8.5. JWST galaxies are plotted as stars (spectroscopically confirmed; Curtis-Lake et al. 2023; Cameron et al. 2023; Fujimoto et al. 2023; Nakajima et al. 2023; Tang et al. 2023) and diamonds (photometric candidates; Finkelstein et al. 2023; Naidu et al. 2022b; Castellano et al. 2022; Donnan et al. 2023; Harikane et al. 2022; Atek et al. 2023; Leethochawalit et al. 2023; Whitler et al. 2023). HST CANDELS sources and stacked GOODS results by Tacchella et al. (2022) and Stefanon et al. (2023), respectively, are shown as circles. The singular HST-matched source at z > 8.5 (NGD-z9d) is shown as a beige diamond. Our NGD-z15a is unique in that it is the faintest and least massive object at z > 13.5 seen in JWST data.
Download figure:
Standard image High-resolution image3.2. Nonparametric Mass and SFR Fitting
We use the Bayesian SED fitting code Bagpipes (Carnall et al. 2018) to determine galaxy properties such as stellar masses, SFRs, dust content, and metallicity for our galaxies in NGDEEP. The latter two properties are less well constrained with photometric data alone, so we do not report those values here. Table 3 shows the stellar mass and SFR estimates for these galaxies.
We use the built-in BC03 template set, assume a Kroupa & Boily (2002) IMF, and we set logarithmic priors for the age, metallicity, and dust while fixing the redshift to the best-fitting LePhare solution.
6
We run Bagpipes three times with different SFHs (exponential, delayed exponential, and constant) while assuming a Calzetti et al. (2000) dust extinction law, which has been found to be closely followed at high redshifts (R. Bowler et al. 2023, in preparation). We allow the stellar mass to be fit between 5  12. The age is allowed to vary between 0 and 15 Gyr, and for the exponential and delayed SFH models the e-folding timescale, τ, is allowed to vary between 0.01 and 15 Gyr. For the dust extinction AV
is fit between 0 and 6 mag, and for nebular emission the ionization parameter (U) is fit from
12. The age is allowed to vary between 0 and 15 Gyr, and for the exponential and delayed SFH models the e-folding timescale, τ, is allowed to vary between 0.01 and 15 Gyr. For the dust extinction AV
is fit between 0 and 6 mag, and for nebular emission the ionization parameter (U) is fit from  . The metallicity is allowed to vary between −4
  1. We also reduce the star formation timescale from the base Bagpipes code to 10 Myr to allow for the expected increase in sSFR for galaxies at these redshifts compared to those at lower z.
We carry out these calculations to determine the range of SFR and masses for our sample as compared with the LePhare observations that we use in our plots. We find, roughly independent of the method of the assumed star formation, that the stellar masses and SFRs roughly agree for these early galaxies with our SED fitting results. We also find, unsurprisingly, that a constant SFH is unlikely to be an accurate representation of these galaxies. The exponential fits and delayed exponential fits give similar results, and with our fitting we cannot distinguish which is the better of the two.
3.3. Sérsic Indices and Half-light Radii
We use GALFIT to determine the Sérsic indices and half-light radii of these extended sources. GALFIT is a least-squares fitting algorithm that uses a Levenberg−Marquardt algorithm to find the optimum solution to a fit (Peng et al. 2002, 2010). We follow a similar method to that presented in Kartaltepe et al. (2023), whereby the SExtractor catalog is used for the initial parameter guesses. We run GALFIT for all available filters but only report results for the filters that best match the rest-frame optical wavelength of the source. This minimizes the effect of morphological k-correction, as the qualitative and quantitative structure of galaxies changes as a function of wavelength (Taylor-Mager et al. 2007), which can result in significant structural changes between rest-frame UV and rest-frame optical images. In this case, all results reported are in the F444W band. We fit a 2D Sérsic profile, with results shown in Table 4 and an example fit shown in Figure 9.

Figure 9. Sérsic profile fit for NGD-z10c. The left panel shows the source, the middle panel shows the two-dimensional Sérsic model, and the right panel shows the residual image.
Download figure:
Standard image High-resolution imageTable 4. Sérsic Indices and Half-light Radii for Each Object for Which a Clean Fit Could Be Obtained Using the Two-dimensional Fitting Software GALFIT
| Name | Sérsic Index | R e (kpc) |
|---|---|---|
| NGD-z9a | 1.25 ± 0.20 | 1.34 ± 0.23 |
| NGD-z8a | 0.79 ± 0.25 | 0.82 ± 0.08 |
| NGD-z9c | 2.75 ± 2.12 | 0.37 ± 0.11 |
| NGD-z10c | 0.07 ± 0.85 | 0.44 ± 0.05 |
| NGD-z11c | 0.06 ± 1.10 | 0.43 ± 0.71 |
| NGD-z10d | 0.30 ± 0.30 | 0.98 ± 0.17 |
Note. We quote the symmetrical 1σ errors obtained from GALFIT.
Download table as: ASCIITypeset image
Out of the 18 sources in our original sample, 11 of these were flagged owing to at least one parameter meeting a constraint limit, or the model being identified as a poor fit by eye, using the residual image created by GALFIT. The high percentage of poorly fitting models is likely due to the unprecedented depths achieved by JWST, resulting in detection of faint sources. It is likely in future that the method of light profile fitting will need some refinement in order to accurately model the faintest sources.
Most of our modeled galaxies are compact sources (R e < 1 kpc), with two galaxies being exceptionally small sources with R e < 0.5 kpc. These small sizes are in agreement with other structural analyses of high-redshift objects (Adams et al. 2023b; Mascia et al. 2023).
4. Discussion
A source of early debate within the high-redshift community was with regard to the stellar masses of some high-redshift candidates (e.g., Boylan-Kolchin 2023; Endsley et al. 2023; Labbé et al. 2023; Lovell et al. 2023). In particular, galaxies with redshifts greater than z > 9 were found to have stellar masses of up to 1011 M⊙, with such high stellar masses raising tension with the ΛCDM cosmological model (Lovell et al. 2023). The stellar masses obtained in this study are generally much lower, and in the regime of 108 M⊙, we compare these to the Lovell et al. (2023) cosmological estimations for the most massive galaxies expected in JWST-like survey volumes. Both our highest-redshift source and most massive source sit comfortably within the 1σ and 2σ regions, respectively, of these models. Subsequently, the physical properties we measure for these sources show no significant tension with such cosmological models.
In terms of other simulations, the stellar masses derived here are in agreement with the results of Astraeus (Hutter et al. 2021), the largest simulation fully coupling galaxy formation and reionization. This is such that the most massive galaxy we find at z = 9 seems to hint at the region being slightly overdense (by about 10%), as seen from predictions of JWST-JADES surveys accounting for the impact of cosmic variance (Ucci et al. 2021).
To determine the number of expected galaxies at our survey depths, we assume that the UV luminosity function (UV LF) follows that of recent observations (e.g., Bouwens et al. 2021; Donnan et al. 2023) and integrate these to predict the number of galaxies that would be expected from NGDEEP at z = 9 and z = 10. We find that the number of galaxies identified is broadly consistent with these predictions from past studies (five to eight galaxies at z = 9 and one to three galaxies at z = 10), indicating that NGDEEP is not extremely over- or underdense. This also shows that there may not be a large evolution in the LF at fainter absolute magnitudes.
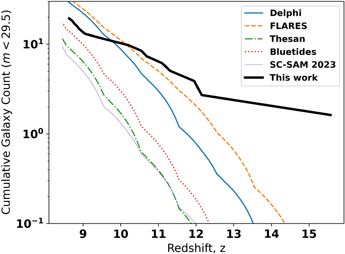
To explore the expected numbers of high-redshift galaxies further, we calculate the cumulative number counts as a function of redshift for our sample. These are completeness corrected by weighting each individual galaxy based on the redshifts and F444W magnitudes given in Table 2 using the simulations in Adams et al. (2023a). For reference, at m = 29.5 (the average depth of our F150W and F200W imaging) our 8.5 < z < 16 sample is expected to be 75%–80% complete, falling to 70%–75% at the m = 29.6 5σ limiting F444W survey depth. We compare the completeness-corrected cumulative number counts to the FLARES (Vijayan et al. 2021; Wilkins et al. 2023), Delphi (Dayal et al. 2014, 2022), Thesan (Kannan et al. 2022), BlueTides (Feng et al. 2016), and Santa Cruz semianalytic model (SC SAM; Yung et al. 2023) simulations by integrating the simulated UV LFs to the rest-frame magnitude that would be probed by observations with an apparent depth of m = 29.5. The results are examined in two primary redshift regimes at both 8.5 < z < 10.5 and z > 10.5 and are shown graphically in Figure 10.
Figure 10. A comparison of our z > 8.5 NGDEEP completeness-corrected cumulative number counts against those predicted by simulations covering the same sky area to limiting magnitude m = 29.5. We find an underabundance of 8.5 < z < 10.5 galaxies owing to our requirement of an F115W nondetection, which would be remedied by including bluer HST data. Our z = 15.6 galaxy stands out in the z > 10.5 regime, although the large ∼50% cosmic variance (Driver & Robotham 2010) could help explain this discrepancy.
Download figure:
Standard image High-resolution image
In the lower-redshift regime, we obtain 11 candidate high-redshift galaxies. Examining the cumulative number counts as a function of redshift, our observations lie centrally in the range of predictions obtained by the different simulations. FLARES and Delphi predict greater numbers of galaxies (upward of 20), while Thesan and SC SAM predict relatively fewer (seven to nine galaxies).
Our selection criteria require that a nondetection be present in the NIRCam F115W bandpass. As a consequence of this, we expect to miss galaxies at z ∼ 8.5–9 that are very luminous (e.g., NGD-z9d). This is because the Lyman break is located partway through the F115W band at this redshift, and so some flux will be recorded. We subsequently expect to be incomplete to these luminous, lower-redshift sources and underestimate the total number of galaxies in the field. However, the nature of the shape of the UV LF means that these sources are expected to be relatively few in number.
In the ultra–high-redshift regime (z > 10.5), we obtain seven candidate galaxies. Unlike in the lower-redshift regime, the cumulative number counts of galaxies are high relative to the simulations we compare against. The Thesan and SC SAM simulations predict only a single galaxy within this redshift range, while Delphi and FLARES predict 5 and 7, respectively. The UV LF's of various simulations agree with each other to within factors of 2 or so across the UV LF at z = 8–9, but beyond z > 10 they begin to diverge more in their predictions, with factors of >10 differences in the UV LFs by z ∼ 12. Our candidate z = 15.6 source stands out in these comparisons. However, this source has its rest-frame UV in the much deeper F277W band. Increasing the apparent depth used in the calculations to 29.8, we find that only the FLARES simulation predicts a galaxy to be routinely found above z > 13, the Delphi simulation indicates a 43% chance, and all other simulations indicate a 2%–5% chance of a z > 13 galaxy lying in the field.
With only 6.3 arcmin2 of unmasked area, cosmic variance is expected to highly influence our observations. When using the Driver & Robotham (2010) cosmic variance calculator, a broad estimate of σN /N = 0.5 (i.e., a 50% uncertainty on number counts) is obtained in redshift bins of size Δz = 1. However, it should be noted that clustering and how galaxies populate dark matter halos in this time period is uncertain, meaning that cosmic variance could be even greater (Dawoodbhoy et al. 2023). Significantly greater volumes are thus required in order to reliably discern which simulations provide the most robust descriptions of early galaxy formation.
In terms of SFRs among our sample, NGD-z9a shows a much higher SFR (194.1 M⊙ yr−1) than other galaxies in our sample. One explanation for this high SFR is that it could include an AGN contribution. Further submillimeter observations (e.g., ALMA) could provide far-infrared information to make this clear. In addition, we believe that the neighboring bright source may be increasing its Kron radius, meaning that we are likely overcorrecting using the currently implemented ratio of "FLUX_AUTO" to aperture-corrected "FLUX_APER," which will boost both the mass and SFR of this source. The scale of this correction is currently 0.5 dex.
5. Summary and Conclusions
We provide in this paper a first view and analysis of the galaxies found within the NGDEEP field, which will be the deepest public NIRCam imaging set once complete. We find 16 8.5 < z < 16 galaxies through our bespoke reduction, analysis, and selection methods identified using two different photometric redshift codes, LePhare and EAZY.
Even though incomplete in terms of its depth, the NGDEEP survey has allowed us to identify galaxies with low inferred stellar mass. These galaxies provide a new window into the early universe, allowing us to study the formation and evolution of galaxies and increase our understanding of the faintest and most distant objects in the universe.
Our major conclusions can be summarized as follows. We find a significant number of low-mass dwarf galaxies with M* < 108.5
M⊙. One of our objects is at  , which we find has a blue UV slope of
  and a stellar mass of M* = 107.4
M⊙. The majority of the galaxies in this field are faint, low-mass galaxies at z ∼ 9 that have blue colors and UV slopes. In general, these galaxies all have flat surface brightness profiles and are small with R
e
< 1 kpc. Thus, our major finding is that there is a significant population of low-mass and low-luminosity galaxies in the epoch of reionization that we are just now beginning to be able to study with JWST. Future studies will determine the contribution of these populations to the UV flux at high redshift and its contribution to reionization.
and a stellar mass of M* = 107.4
M⊙. The majority of the galaxies in this field are faint, low-mass galaxies at z ∼ 9 that have blue colors and UV slopes. In general, these galaxies all have flat surface brightness profiles and are small with R
e
< 1 kpc. Thus, our major finding is that there is a significant population of low-mass and low-luminosity galaxies in the epoch of reionization that we are just now beginning to be able to study with JWST. Future studies will determine the contribution of these populations to the UV flux at high redshift and its contribution to reionization.
In addition, we find redshifts and properties for 25 HST dropout candidates at 6 < z < 9 from Bouwens et al. (2011), Wilkins et al. (2011), and McLure et al. (2013). Of these objects, 21 have high-redshift (5.9 < z < 9.0) solutions, including two z = 8 mergers. Our NGD-z8g merger appears in an overdense region of sky with two additional sources within 30'' at the same redshift, potentially forming one of the earliest protoclusters yet observed. Balmer break solutions at 0.8 < z < 1.8 are measured for the other four cross-matched sources, indicating the utility of NIRCam for removing low-z interlopers at 6 < z < 9.
The discovery of the distant galaxies in this paper is a major step forward in our understanding of the universe and its history, and the information gathered by deep NIRCam JWST imaging will be crucial in furthering our knowledge of the early universe and the processes that shaped it.
Acknowledgments
We thank the NGDEEP team for their work in designing and preparing these observations, the STScI staff that carried them out, and the NIRISS team, whose prompt action to resolve technical issues at the end of 2023 January enabled these data to be taken.
We acknowledge support from the ERC Advanced Investigator Grant EPOCHS (788113; PI Conselice), as well as two studentships from STFC to D.A. and T.H. L.F. acknowledges financial support from Coordenao de Aperfeioamento de Pessoal de Nvel Superior—Brazil (CAPES) in the form of a PhD studentship. This work is based on observations made with the NASA/ESA Hubble Space Telescope (HST) and NASA/ESA/CSA James Webb Space Telescope (JWST) obtained from the Mikulski Archive for Space Telescopes (MAST) at the Space Telescope Science Institute (STScI), which is operated by the Association of Universities for Research in Astronomy, Inc., under NASA contract NAS 5-03127 for JWST and NAS 526555 for HST. The DOI connecting this publication to the raw data source is 10.17909/v7ke-ze45. P.D. acknowledges support from the NWO grant 016.VIDI.189.162 ("ODIN") and the European Commission's and University of Groningen's CO-FUND Rosalind Franklin program.
Footnotes
- 4
DOI:10.17909/v7ke-ze45.
- 5
All SED plots and reduced NIRCam images can be found at https://1drv.ms/u/s!AjXt-wkeMSXAgq52YO_LqY5nvB1NWA?e=KCy4Vr. We also include a figure set associated with Figure 3 accessible in the online journal.
- 6
Note that fixing the redshift means that the errors on our masses/SFRs are underestimated, as the photometric redshift pdf's are not taken into account in our analysis.