


Abstract
We present the first results study of the effects of the powerful gamma-ray burst GRB 221009A that occurred on 2022 October 9, and was serendipitously recorded by electron and proton detectors on board the four spacecraft of the NASA THEMIS mission. Long-duration gamma-ray bursts (GRBs) are powerful cosmic explosions, signaling the death of massive stars, and, among them, GRB 221009A is so far the brightest burst ever observed due to its enormous energy (Eγ iso ≈ 1055 erg) and proximity (the redshift is z ≈ 0.1505). The THEMIS mission launched in 2008 was designed to study the plasma processes in the Earth's magnetosphere and the solar wind. The particle flux measurements from the two inner magnetosphere THEMIS probes, THA and THE, and two outer probes (renamed ARTEMIS after 2010), THB and THC, orbiting the Moon captured the dynamics of GRB 221009A with a high time resolution of 4 (up to 8) measurements per second. This allowed us to resolve the fine structure of the GRB and determine the temporal scales of the two main bursts' spiky structure, complementing the results from gamma-ray space telescopes and detectors.
Export citation and abstract BibTeX RIS

Original content from this work may be used under the terms of the Creative Commons Attribution 4.0 licence. Any further distribution of this work must maintain attribution to the author(s) and the title of the work, journal citation and DOI.
1. Introduction
GRB 221009A was a bright and long-lasting gamma-ray burst (GRB) detected by the Burst Alert Telescope (BAT) on board the Swift satellite, 1 hr later by the Gamma-ray Burst Monitor (GBM; Dichiara et al. 2022) on board the Fermi Gamma-ray Space Telescope (FGST; Veres et al. 2022; Bissardi et al. 2022; Lesage et al. 2022; Pillera et al. 2022), by other space observatories such as Swift (Dichiara et al. 2022), AGILE (Piano et al. 2022; Ursi et al. 2022), INTEGRAL (Gotz et al. 2022), Solar Orbiter (Xiao et al. 2022), The Spektrum-Roentgen-Gamma orbital observatory (Lapshov et al. 2022), Konus (Frederiks et al. 2022, 2023), GRBAlpha (Ripa et al. 2022), and STPSat-6 (Mitchell et al. 2022), High Energy Burst Searcher (HEBS) on SATech-01 (Liu et al. 2022), by the ground observatory LHAASO (The Large High Altitude Air Shower Observatory) with striking very-high-energy (VHE) features (Huang et al. 2022). The GBM light curve consists of an initial ∼10 s long pulse at 13:16:59 UTC, followed by an extraordinarily bright episode roughly ∼180 s after the trigger time, lasting at least 100 s (Veres et al. 2022). The afterglow outburst outshone all other GRBs seen before (Sahu et al. 2023). The Large High Altitude Air Shower Observatory (LHAASO) with the water Cherenkov detector array (WCDA) and the larger air shower kilometer square area (KM2A) detector observed more than 5000 VHE photons in the 500 GeV–18 TeV energy range within 2000 s from the trigger, making them the most energetic photons ever observed from a GRB (Huang et al. 2022). The event was so long and intense that it caused sudden Earth global ionospheric disturbances (both day and night)—a result of the increased ionization by X- and gamma-ray emission (Hayes & Gallagher 2022; Pal et al. 2023) from the very low frequency/low frequency subionospheric signals dynamics in the D region of Earth's ionosphere (∼60–100 km). The optical observations of this burst (located at around R.A. = 288.282 and decl. = 19.495; Pillera et al. 2022) have a relatively small redshift z = 0.1505 (Castro-Tirado et al. 2022; de Ugarte Postigo et al. 2022) compared to most other long bursts, which indicates that this is one of the closest observed long-duration GRB (GRB 211211A had even lower redshift of 0.076, which corresponded to a distance of ∼346 Mpc (Mei et al. 2022; Rastinejad et al. 2022; Troja et al. 2022; Gompertz et al. 2023). The total emitted isotropic-equivalent gamma-ray energy from GRB 221009A is estimated to be (2–6) × 1054 erg (de Ugarte Postigo et al. 2022; Kann & Agui Fernandez 2022).
The high-energy gamma photons guide the sputtering of secondary particles (proton, electrons, and probably secondary photons) from the material of the spacecraft, which can be detected by particles detectors on board spacecraft (Pisacane 2014). Similar effects were reported by Schwartz et al. (2005) and Terasawa et al. (2005) after the gamma-ray giant flare of SGR 1806220. These measurements from spacecraft particle detectors provide an alternative perspective that complements observations from the gamma-ray telescopes by providing high sampling rates capable of resolving the fine structure of bursts (Schwartz et al. 2005; Terasawa et al. 2005). GRB 221009A was detected in the electron flux measurements made by the HEPP-L charged particle detector on board the low Earth orbit (LEO) China Seismo-Electromagnetic Satellite (Battiston et al. 2023). Battiston et al. (2023) showed that the recorded anomalous signal of GRB 221009A in the electron fluxes originated from secondary electrons produced via photon absorption in the passive material of the detector. The signal dynamics followed quite well the structure of the GRB 221009A signal recorded by HEBS (Liu et al. 2022). Here we report observations of the fine structure of the GRB 221009A gamma burst signal recorded in electron and proton flux measurements (the bursts of secondary electrons produced through interactions of gamma photons with material of the detectors Battiston et al. 2023) by the electrostatic analyzers ESA (McFadden et al. 2008) and solid-state telescopes (SSTs) on board the four (of the five) THEMIS spacecraft (Angelopoulos 2014) on 2022 October 9. The configuration of the spacecraft is shown in Figure 1. Specifically, we use data from THB and THC, orbiting the Moon as part of the ARTEMIS mission (Angelopoulos 2014) and the two inner magnetosphere probes THA and THE. The THEMIS ESA and SST provide proton and electron distribution functions with a sampling rate of the spin period (3 s for THA, THD, THE and 4 s for THB and THC). Battiston et al. (2023) showed that the signal from secondary electrons provides a full solid-angle coverage, which allows us to decompose the spin resolution to individual measurements and increase the temporal resolution to 0.25 s (up to 0.125 s) to resolve the fine structure of the burst. The data recorded by SST and ESA detectors are unsaturated during the entire interval of observations, and resolve the fine structure of most intensive bursts, supplementing high-resolution measurements of the most intense period of the burst activity (some of gamma telescopes experienced saturation periods) made by HEBS (Liu et al. 2022, unsaturated data with subsecond timing resolution) and by HEPP-L (Battiston et al. 2023, unsaturated electron flux data with a second sampling rate).
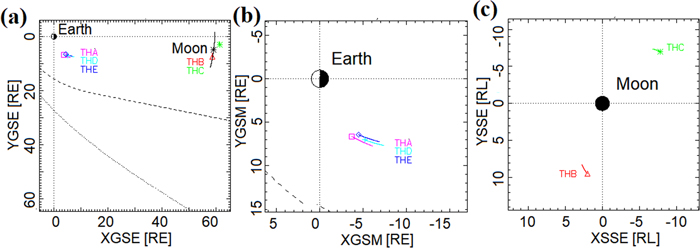
Figure 1. The configuration of THEMIS and ARTEMIS spacecraft during the GRB 211211A event is shown in panel (a) with the traces during the interval of 1200-1400 UT shown in the ecliptic plane. The modeled locations of Earth's magnetopause and bow shock are indicated by the dashed and dotted curves respectively. (b)—the inner THEMIS spacecraft configuration. (c)—the ARTEMIS spacecraft THB and THC in the selenocentric system (the ecliptic plane projection).
Download figure:
Standard image High-resolution image2. Data and Methods
Time History of Events and Macroscale Interactions during Substorms (THEMIS) is NASA's (National Aeronautics and Space Administration) mission, which consists of the five identically equipped satellites (probes THA, THB, THC, THD, and THE). The main goal of this mission is to carry out multipoint investigations of substorm phenomena in the tail of the terrestrial magnetosphere (Sibeck & Angelopoulos 2008). After starting the Acceleration, Reconnection, Turbulence, and Electrodynamics of the Moon's Interaction with the Sun (ARTEMIS) mission, which is a spin-off from THEMIS, two of the five THEMIS probes (THB and THC) were repositioned to the lunar equatorial orbit, at distances of ∼55–65 geocentric earth radii, RE (∼1.1–12 selenocentric lunar radii, RL). These probes perform systematic, two-point observations of the distant magnetotail, the solar wind, and the lunar space and planetary environment (Angelopoulos 2014). The three inner probes (THA, THD, and THE) continue to collect data in the inner magnetosphere (∼1.2–9 RE).
A pair of back-to-back top hat hemispherical electrostatic analyzers (ESAs) measure the distribution functions of ions (0.005–25 keV) and electrons (0.005–30 keV) over 4π str to produce 3 s time resolution plasma moments (McFaddenetal.2008). The instrument consists of a pair of "top hat" electrostatic analyzers with common 180° × 6° fields of view that sweep out 4π str each 3 s spin period. The sensors generally swept in energy (logarithmically) from ∼32 keV for electrons and ∼25 keV for ions, down to ∼6–7 eV. Nominal operations have 32 sweeps per spin, with 31 energy samples per sweep, plus one sample energy retrace, resulting in a typical measurement resolution of ΔE/E ∼ 32%. Particle events are registered by microchannel plate detectors. At low time resolution, THEMIS generally maintains the "full" 32 energies sampled, and has an solid-angle map composed of 88 bins. Combining the energy and solid-angle measurements can sufficiently improve time resolution. SSTs measure the superthermal (0.02–1 MeV) part of the ion and electron distributions over 4π str with similar measurement regimes.
The configuration of THEMIS and ARTEMIS spacecraft during the GRB 221009A event is shown in Figure 1. Two THB and THC (ARTEMIS) were located near the Moon in the tail magnetosphere at geocentric distances of ∼58 RE (THB) and 61 RE (THC) from Earth. The interspacecraft distance was ∼3.5 RE (∼13 RL). The inner probes were at geocenctric distances of ∼8.5 RE, with an interspacecraft distance of ∼1 RE.
The four spacecraft (THA, THB, THC, and THE) detected the effects of GRB 221009A, which appear as two very intense bursts at 13:20:36–13:21:30 and a subsequent less intense burst at around 13:25:30 (Figure 2). The fifth THEMIS spacecraft, THD, did not collect particle data during this time interval. The ARTEMIS spacecraft THB and THC carried particles measurements in the same mode: spin-resolution ESA and spin-resolution SST (protons). The omnidirectional electron and proton flux dynamics recorded on board THA, THB, THC, and THE by the SST detectors are shown in Figure 2. The electron and proton apparent flux enhancements associated with GRB 221009A are observed at energies up to 1 MeV in the SST measurements following the GRB 221009A dynamics reported by Xiao et al. (2022) from Solar Orbiter STIX measurements of five energy bands in the range between 4 and 150 keV (with the temporal resolution of 4 s) and by Liu et al. (2022) from HEBS detection in the range from 400 to 6000 keV. The decrease of the flux recorded by SST with energy above 1 MeV is in an agreement with the results of HEPP-L (Battiston et al. 2023). The data available from THA and THE were at spin averaged sampling rate of 3 s, so the processing of subsecond data could be applied only to the ARTEMIS probes THB and THC. The distance between the inner probes (THA, THD, and THE) and the ARTEMIS spacecraft (THB and THC) corresponded to ∼1 light second (less than 0.25 s taking into account the geometry of the event). The spin-resolution data from THA and THE do not sufficiently resolve the time delay of the GRB signal between the spacecraft. In the following we compare the timing of the signal recorded by THB and THC (available with the better time resolution) with the time of the signals from HEPP-L (Battiston et al. 2023) and HEBS (Liu et al. 2022) recorded on board the LEO spacecraft.
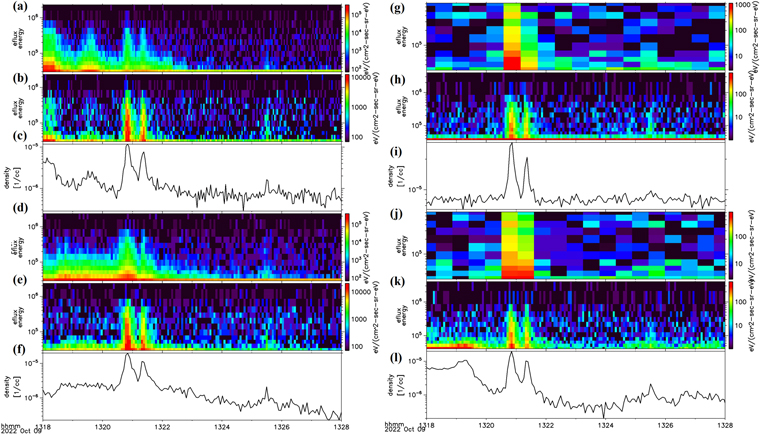
Figure 2. The electron and proton flux recorded by the SST detectors on board the THA and THE probes: (a)—the proton flux from the THA SST detector; (b)—the electron flux from the THA SST detector; (c)—the proton density in the SST energy range. Panels (d)–(f) present the same characteristics recorded on board THC, panels (g)–(i)—on board THB, and panels ((j)–(l))—on board THC.
Download figure:
Standard image High-resolution imageThe polar and azimuthal angular resolution of the ESA and SST detectors provide information on the directionality of particle fluxes. The THEMIS spacecraft THB and THC collected spin-resolution ESA proton and electron data shown in Figure 3. Such flux enhancement dynamics demonstrate the effects of the GRB over the full energy range of the ESA (from 8 eV to ∼20 keV) and over all polar and azimuthal angles (Figures 3(b), (c)). The particle fluxes given as a function of polar and azimuthal angles in Figures 3(b), (c) indicate that the GRB-associated secondary particles flux distributions are similar at different polar and azimuthal angles confirming the isotropy of the electron flux measurements during GRB 221009A reported by Battiston et al. (2023). The fluxes recorded during the spacecraft spin rotation combined from THB and THC SSTs and ESAs are shown in Figures 4(a) and (b) respectively with 0.125 s temporal resolution, which we decimate to 0.25 s resolution by accumulating 32 energy channels and data from the two spacecraft for the higher significance of the results. The distance between THB and THC corresponded to ∼0.1 light second during GRB 221009A and, taking into account the geometry of the source (Pillera et al. 2022), the actual maximal time shift was ∼0.07 s, so we combined measurements from THB and THC into a merged time series.
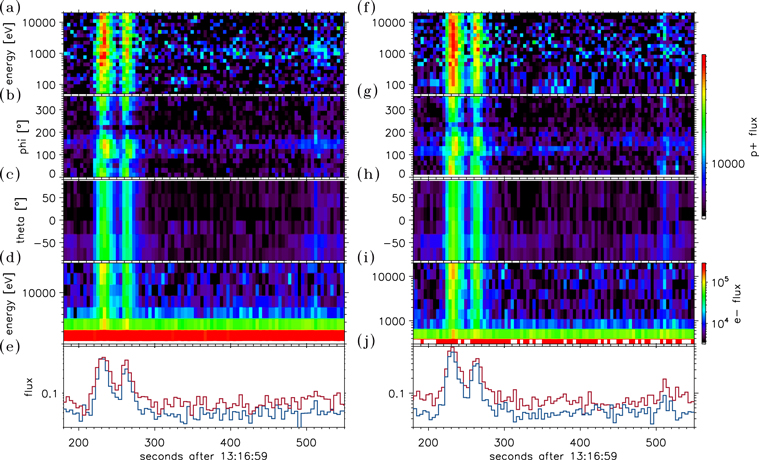
Figure 3. The apparent electron and proton fluxes recorded on board THB and THC probes with electrostatic analyzers (ESAs): (a)—the omnidirectional proton flux from the THB ESA detector; (b)—the energy integrated proton flux on the azimuthal angle phi; (c)—the energy integrated proton flux on the polar angle theta; (d)—the omnidirectional electron flux from the THB SST detector; (e)—the integrated proton (red) and electron (blue) fluxes. Panels (f)–(j) present the same characteristics from THC.
Download figure:
Standard image High-resolution image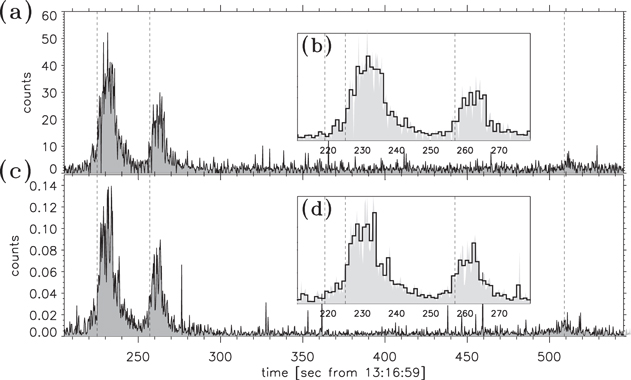
Figure 4. (a)—the light curve of the combined THB and THC ESA proton flux counts in the energy range from 8 eV to 20 keV. (b)—zoomed-in plot of the two main bursts from (a) with curve shown at 1 s resolution. (c)—the light curve of the combined THB and THC SST proton flux counts in the energy range from 30 keV to 1 MeV. (d)—zoomed-in plot of the two main bursts from (c) with solid curve shown at 1 s resolution.
Download figure:
Standard image High-resolution imageThe light curve of counts from THB and THC ESA detectors is presented in Figure 4(a), and the combined flux light curve recorded by the SST detectors is shown in Figure 4(b). The triggering impulse at 13:16:59 UT (T0 in the following) is not seen on the background of particles flux perturbation and the three peaks are resolved continuously without any signs of saturation: the shoulder beginning of the first main peak is at T0+219 s (SST) and at T0+220 s (ESA); the first main peak at T0+225 s; the second peak is at T0+256 s (SST and ESA), and the third peak is at T0+509 (SST) and T0+511 (ESA). The time marks of the GRB 221009A temporal profile reported by Battiston et al. (2023) from HEPP-L and by Liu et al. (2022) the HEBS data collected on board the LEO spacecraft (T0+219 s for the shoulder, T0+225 s for the first peak, T0+256 s for the second peak, and T0+509 for third peak are indicated by the vertical dashed lines). The timing uncertainties of THEMIS spacecraft synchronization (∼0.1 s) and time resolution do not allow us to resolve the time shift between the GRB signal recorded on board THB and THE and the data recorded on board the LEO spacecraft presented in detail by Battiston et al. (2023). Thus, we present a 1 s resolution version of the ESA and SST data to compare with the 1 s light curves of HEPP-L (Battiston et al. 2023) and HEBS (Liu et al. 2022). The two main peaks are zoomed in Figure 4(b) (ESA) and Figure 4(d) (SST). The light curve of 1 s resolution ESA counts in Figure 4(b) is in very good agreement with the 1 s resolution light curve of GRB 221009A profile presented by Liu et al. (2022) and Battiston et al. (2023): the first two subpeaks of the first burst (T0+225-236) s are similarly resolved by ESAs and SSTs as well as by HEPP-L and HEBS; the SSTs resolved two later subpeaks (the later one is seen in the HEPP-L light curve), which can be seen in the 0.05 s resolution HEBS data; the second burst at (T0+256-266 s) has four subpeaks (three from the SST) confirming the measurements from HEPP-L and the 0.05 s resolution HEBS data. The good agreement with the direct observations from the gamma-ray detector HEBS indicates that charged particle detectors can indeed provide highly useful observations of intense gamma bursts with, owing to their high time resolution of measurements, higher saturation thresholds, and long base lines, which are complementary to LEO spacecraft equipped with gamma-ray telescopes
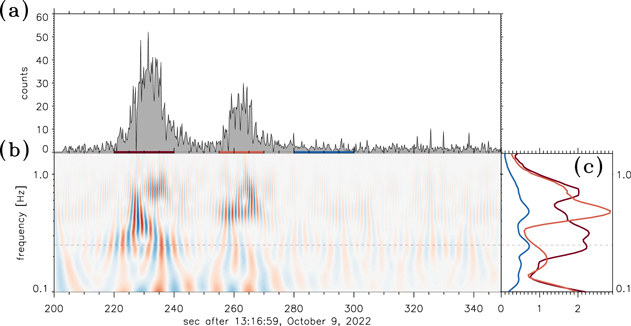
From the 0.25 s sampling rate data, we note that the main peaks have complicated spiky fine structure. The two main bursts are zoomed in Figure 5(a). The wavelet decomposition (based on the Morlet wavelet) reveals the scales of pulses indicating the pulse widths and interpulse time intervals—presented in Figure 5(b). Figure 5(d) shows the time-averaged wavelet spectra color coded according to corresponding averaging intervals highlighted in Figure 5(a). The first main burst has these scales to lie between 0.7 and 1.0 s, with a mean scale of  s. The second main burst has two groups of scales with mean values of
  and
and  s (the smaller scale of ∼0.5 s is close to the the double spin frequency, so its significance is not clear). These scales are in the range of the pulse scales reported by Bhat et al. (2011), where it was shown that the mean values of pulse widths were 0.81 s for long bursts and 0.04 s for short bursts, respectively: the observed GRBs statistically grouped to longer and shorter duration events with a minimum around 2 s suggesting that there are two separate populations of bursts (Bhat et al. 2011).
Figure 5. (a)—the light curve of composite THB and THC ESA proton flux counts showing the fine structure of the two main bursts of GRB 221009A. (b)—wavelet decomposition of the light curve (b). The dashed line indicates the spacecraft spin frequency. (c)—time-averaged wavelet spectra collected during the interval indicated by the corresponding color in panel (a).
Download figure:
Standard image High-resolution image
We have searched for the effects of GRB 2210009A in the observations of other magnetosphere and solar wind missions carrying onboard charged particle detectors and we found the effects of GRB 2210009 recorded by WIND and GOES15 spacecraft. The processing of these data will be a subject of a future publication.
3. Conclusions
We present the first report of the effects of the powerful gamma-ray burst GRB 221009A by the spacecraft particles detectors on board the probes of the NASA THEMIS and ARTEMIS. The four spacecraft (two inner Earth's magnetosphere probes, THA and THE, and two spacecraft orbiting the Moon, THB and THC) detected the event through their ESA and SST proton and electron flux measurements. By combining the energy channels and the multiple spacecraft data, the fine structure of the gamma flare has been resolved with time sampling of 4 measurements per second, which make particle detectors to be additional instruments for addressing the fine structure of the intense GRBs. The obtained timescales of the fine structure spikes of the two main GRB 221009A are consistent with the characteristic parameters of long GRBs.`
We acknowledge NASA contract NAS5-02099 for use of data from the THEMIS Mission, D. Larson for use of SST data and J. P. McFadden for use of ESA data. O.V.A is grateful to J.P. McFadden for the helpful discussion. O.V.A was supported by NSF grant No. 1914670, NASA's Living with a Star (LWS) program (contract 80NSSC20K0218), and NASA grants contracts 80NNSC19K0848, 80NSSC22K0433, 80NSSC22K0522, 80NSSC20K0697, and 80NSSC20K0697.