


Abstract
RR Lyrae variables are excellent Population II distance indicators thanks to their well-defined period–luminosity relations (PLRs) at infrared wavelengths. We present results of near-infrared (NIR) monitoring of Galactic globular clusters to empirically quantify the metallicity dependence of NIR PLRs for RR Lyrae variables. Our sample includes homogeneous, accurate, and precise photometric data for 964 RR Lyrae variables in 11 globular clusters covering a large metallicity range (Δ[Fe/H] ∼ 2 dex). We derive JHKs-band period–luminosity–metallicity (PLZ) and period–Wesenheit–metallicity (PWZ) relations anchored using 346 Milky Way field RR Lyrae stars with Gaia parallaxes, and simultaneously solved for independent distances to globular clusters. We find a significant metallicity dependence of ∼0.2 mag dex−1 in the JHKs-band PLZ and PWZ relations for RR Lyrae stars independent of the adopted metallicity scale. The metallicity coefficients and the zero-points of the empirical PLZ and PWZ relations are in excellent agreement with the predictions from the horizontal branch evolution and pulsation models. Furthermore, RR Lyrae–based distances to our sample of globular clusters are also statistically consistent with other independent measurements in the literature. Our recommended empirical JHKs-band PLZ relations for RR Lyrae stars with periods of fundamental mode pulsation (Pf) are:
Export citation and abstract BibTeX RIS

Original content from this work may be used under the terms of the Creative Commons Attribution 4.0 licence. Any further distribution of this work must maintain attribution to the author(s) and the title of the work, journal citation and DOI.
1. Introduction
RR Lyrae variables are old (>10 Gyr), low-mass (∼0.5–0.8M⊙) stars that are located at the intersection of the horizontal branch and the classical instability strip in the Hertzsprung-Russell diagram. These pulsating stars have long been used as distance indicators thanks to the correlation of their visual magnitudes with metallicity (see the reviews by Sandage & Tammann 2006; Catelan & Smith 2015; Beaton et al. 2018; Bhardwaj 2020, and references therein). Since the pioneering work by Longmore et al. (1986) it has been known that RR Lyrae stars follow a well-defined period–luminosity relation (PLR) in the Ks band. Near-infrared (NIR) PLRs offer advantages over the visual magnitude–metallicity relation for distance determinations due to smaller dependence on interstellar extinction, smaller variability amplitude, and less sensitivity to evolutionary effects (Bono et al. 2001; Catelan et al. 2004; Marconi et al. 2015).
Stellar evolution and pulsation models of RR Lyrae stars have predicted a strong effect of metallicity on NIR PLRs (∼0.18 mag dex−1 in JHKs ; Catelan et al. 2004; Marconi et al. 2015). Empirical studies however have reported a wide range for the metallicity coefficient of period–luminosity–metallicity (PLZ) relations (0.03–0.23 mag dex−1 in Ks ; Sollima et al. 2006, 2008; Bono et al. 2011; Muraveva et al. 2015; Braga et al. 2018; Muraveva et al. 2018; Layden et al. 2019; Neeley et al. 2019; Cusano et al. 2021; Muhie et al. 2021, and references therein). Most of these empirical investigations were carried out only in the Ks band, and very few of them included all three JHKs filters. Neeley et al. (2019) used Milky Way (MW) field RR Lyrae stars with parallaxes from Gaia data release 2 (Gaia Collaboration et al. 2016, 2018) to derive the PLZ relations in the NIR bands. These authors found a metallicity coefficient that is consistent with theoretical predictions but with 4 times larger scatter. Bhardwaj et al. (2021b) showed that the lack of homogeneous NIR photometry and spectroscopic metallicities limits the precision of the PLZ relation for field RR Lyrae stars in the MW despite the improvements in their parallax measurements with the early Gaia data release 3 (Gaia Collaboration et al. 2021). The latest Gaia parallaxes of MW field RR Lyrae stars have also been used to calibrate the PLZ relations at mid-infrared wavelengths based on Wide-field Infrared Survey Explorer data (e.g., Gilligan et al. 2021; Mullen et al. 2023).
RR Lyrae variables in globular clusters (GCs) of different mean metallicities provide a unique opportunity to quantify the metallicity coefficient of the PLZ relations. A previous such study was carried out by Sollima et al. (2006) in the Ks band using literature photometry of 538 RR Lyrae stars in 16 GCs with Δ[Fe/H] = 1.3 dex, which resulted in a weak constraint on the metallicity coefficient (0.08 ± 0.11 mag dex−1). This work aims to use homogeneous JHKs time-series photometry of RR Lyrae variables in GCs from our ongoing observational program to empirically calibrate their PLZ relations and extinction-free period–Wesenheit–metallicity (PWZ) relations. The empirical calibrations of the RR Lyrae PLZ and PWZ relations at NIR wavelengths will be crucial for stellar astrophysics and distance scale studies based on Population II standard candles. The well-established infrared PLZ relations for RR Lyrae stars will be particularly important for the James Webb Space Telescope, upcoming Nancy Grace Roman Space Telescope, and ground-based 30 meter class telescopes, which will operate predominantly at infrared wavelengths and will enable observations of a large number of RR Lyrae stars in galaxies beyond the Local Group.
2. The Data
We use NIR photometry of RR Lyrae variables in GCs from our ongoing observational programs using the WIRCam instrument at the Canada–France–Hawaii Telescope (CFHT) and the FLAMINGOS-2 instrument at the Gemini South telescope. 12 All the photometric data for GCs have been calibrated to the Two Micron All Sky Survey (2MASS; Skrutskie et al. 2006) photometric system. Time-series photometry has been published for NGC 5272, NGC 5024, NGC 7078, and NGC 6441 (Bhardwaj et al. 2020, 2021a, 2021b, 2022) and will be presented for NGC 5904, NGC 6402, NGC 6934, and NGC 7089 in a subsequent study (A. Bhardwaj et al. in preparation). We also included homogeneous JHKs mean magnitudes for RR Lyrae variables in NGC 6341 (Del Principe et al. 2005), NGC 6121 (Stetson et al. 2014), and NGC 5139 (Braga et al. 2018). Our sample consists of 964 stars including 588 fundamental mode (RRab), 345 first-overtone (RRc), and 31 mixed-mode RR Lyrae (RRd) variables. The top panel of Figure 1 shows period distributions of 964 GC RR Lyrae stars, and the bottom panel shows the distribution of mean metallicities for their parent GCs. Table 1 lists the GCs that host RR Lyrae with JHKs time-series photometric data together with their homogeneous distances, mean metallicities, and reddening values.

Figure 1. Histograms of period distributions (top) of 964 GC RR Lyrae variables and distribution of mean metallicities (bottom) for their parent GCs. The peak and the width of the metallicity distribution represent the mean metallicity and its scatter from Carretta et al. (2009), respectively.
Download figure:
Standard image High-resolution imageTable 1. Globular Clusters with JHKs Time-series Photometric Data
| GC | N | References a | [Fe/H] b | E(B-V)c | μGC d | μTW e | ||
|---|---|---|---|---|---|---|---|---|
| RRab | RRc | dex | mag | mag | mag | |||
| NGC 6441 | ⋯ | 21 | 9 | B22 | −0.44 ± 0.07 | 0.47 | 15.52 ± 0.03 | 15.48 ± 0.02 |
| NGC 6121 | M4 | 30 | 12 | S14 | −1.18 ± 0.02 | 0.35 | 11.34 ± 0.02 | 11.29 ± 0.02 |
| NGC 5904 | M5 | 67 | 32 | B23 | −1.33 ± 0.02 | 0.03 | 14.37 ± 0.02 | 14.30 ± 0.02 |
| NGC 6402 | M14 | 47 | 47 | B23 | −1.39 ± 0.09 | 0.60 | 14.80 ± 0.06 | 14.75 ± 0.02 |
| NGC 5272 | M3 | 171 | 57 | B20 | −1.50 ± 0.05 | 0.01 | 15.04 ± 0.02 | 15.02 ± 0.02 |
| NGC 6934 | ⋯ | 63 | 12 | B23 | −1.56 ± 0.09 | 0.10 | 15.98 ± 0.02 | 15.95 ± 0.02 |
| NGC 5139 | ω Cen | 83 | 97 | B18 | −1.64 ± 0.09 | 0.12 | 13.67 ± 0.02 | 13.67 ± 0.02 |
| NGC 7089 | M2 | 22 | 15 | B23 | −1.66 ± 0.07 | 0.06 | 15.34 ± 0.02 | 15.31 ± 0.03 |
| NGC 5024 | M53 | 28 | 31 | B21a | −2.06 ± 0.09 | 0.02 | 16.34 ± 0.02 | 16.35 ± 0.03 |
| NGC 7078 | M15 | 48 | 61 | B21b | −2.33 ± 0.02 | 0.10 | 15.15 ± 0.02 | 15.14 ± 0.03 |
| NGC 6341 | M92 | 8 | 3 | D05 | −2.35 ± 0.05 | 0.02 | 14.65 ± 0.02 | 14.65 ± 0.04 |
Notes.
a References: B22—Bhardwaj et al. (2022), S14—Stetson et al. (2014), B20—Bhardwaj et al. (2020), B18—Braga et al. (2018), B21a—Bhardwaj et al. (2021a), B21b—Bhardwaj et al. (2021b), D05—Del Principe et al. (2005), B23—A. Bhardwaj et al. 2023 (in preparation). b The mean metallicities were taken from Carretta et al. (2009). c The reddening values were adopted from Harris (2010) with an average uncertainty of 0.02 mag, which represents the scatter in E(B − V) values from Harris (2010) and Green et al. (2019). d The homogeneous distance moduli (μGC) are from the catalog of Baumgardt & Vasiliev (2021). e The average distance moduli to GCs derived in this work (μTW) using the NIR PLZ and PWZ relations in the form of Equation (1) for the whole sample of 1310 RR Lyrae stars.Download table as: ASCIITypeset image
To calibrate the absolute zero-point of the NIR PLZ relations, we also included MW field RR Lyrae stars with Gaia data and JHKs photometry from 2MASS. The initial sample of ∼400 stars with positions, metallicities, and reddening values from the literature was taken from Muraveva et al. (2018). This sample was crossmatched, within a 1'' search radius, with the 2MASS catalog and the Gaia distances and RR Lyrae variability catalogs (Bailer-Jones et al. 2021; Clementini et al. 2022). The combined sample of 382 stars was further restricted to have a metallicity range (−0.3 < [Fe/H] < − 2.5 dex) similar to that of cluster variables and have a 2MASS quality flag "A" in JHKs filters (346 stars). We did not apply random-phase corrections to single-epoch 2MASS magnitudes because no proper quantification of amplitude ratios or phase lags is available between the G and JHKs bands, and these observations are not contemporaneous. A comparison of intensity-averaged magnitudes of 342 RR Lyrae stars in GCs with single-epoch 2MASS magnitudes (with quality flag "A" in JHKs ) results in a median offset of 0.026/0.015/0.051 mag and a scatter of 0.13/0.11/0.12 mag in J/H/Ks . These systematic offsets were propagated to the photometric uncertainties on 2MASS magnitudes of MW field stars.
Figure 2 displays JHKs
PLRs for MW field RR Lyrae stars using the final sample of 346 field variables (321 RRab and 25 RRc stars). The 2MASS JHKs
magnitudes were corrected for reddening assuming the reddening law of Cardelli et al. (1989) with an RV
= 3.23, and the total-to-selective absorption ratios in NIR filters as:  . The periods and classification of RR Lyrae variables from the Gaia catalog (Clementini et al. 2022), literature reddening estimates (Muraveva et al. 2018), and Gaia-based distances (Bailer-Jones et al. 2021) were used to obtain absolute magnitudes for individual stars. A large scatter in the PLZ relations (0.20/0.17/0.16 mag in J/H/Ks
) for MW field stars is seen in Figure 2 as compared to the theoretical relations (0.06/0.04/0.04 mag in J/H/Ks
; Marconi et al. 2015), which is not only due to random-phase magnitudes but also due to parallax uncertainties, heterogeneous metallicity, and reddening estimates. Nevertheless, the slopes of NIR PLRs for RR Lyrae variables in GCs are well constrained (Bhardwaj 2022), which will allow an accurate determination of the absolute zero-points of the PLZ and PWZ relations at JHKs
wavelengths using MW field stars. This analysis will use the combined sample of 1310 RR Lyrae stars from GCs (964 sources) and MW field (346 sources).
. The periods and classification of RR Lyrae variables from the Gaia catalog (Clementini et al. 2022), literature reddening estimates (Muraveva et al. 2018), and Gaia-based distances (Bailer-Jones et al. 2021) were used to obtain absolute magnitudes for individual stars. A large scatter in the PLZ relations (0.20/0.17/0.16 mag in J/H/Ks
) for MW field stars is seen in Figure 2 as compared to the theoretical relations (0.06/0.04/0.04 mag in J/H/Ks
; Marconi et al. 2015), which is not only due to random-phase magnitudes but also due to parallax uncertainties, heterogeneous metallicity, and reddening estimates. Nevertheless, the slopes of NIR PLRs for RR Lyrae variables in GCs are well constrained (Bhardwaj 2022), which will allow an accurate determination of the absolute zero-points of the PLZ and PWZ relations at JHKs
wavelengths using MW field stars. This analysis will use the combined sample of 1310 RR Lyrae stars from GCs (964 sources) and MW field (346 sources).

Figure 2. Near-infrared PLRs for MW field RR Lyrae variables in the J (top), H (middle), and Ks (bottom) bands. The solid black and dashed red lines represent the theoretical PLZ relations for [Fe/H] = −0.4 dex and −2.4 dex, respectively. The representative error bars on the left display ±3σ scatter in the theoretical relations (Marconi et al. 2015).
Download figure:
Standard image High-resolution image3. Linear Regression Formalism
Our goal is to simultaneously solve for a common slope and a metallicity coefficient, and a separate zero-point for each GC. This approach does not require a prior assumption of an independent distance to a given GC, which can be obtained simultaneously given an absolute zero-point based on field RR Lyrae stars. In the mathematical form, the extinction-corrected apparent magnitude or the Wesenheit magnitude of the jth RR Lyrae star in ith GC at wavelength λ is defined as:

where Pi,j is the period in days and [Fe/H]i,j is the metallicity of RR Lyrae stars. For a given cluster, the mean metallicity from Carretta et al. (2009), listed in Table 1, was adopted for all RR Lyrae members. The term (μi + aλ ) also gives the apparent zero-point of the PLZ/PWZ relation in a given cluster. In the case of field variables, the absolute magnitude of a given RR Lyrae in the above equation is:

To simultaneously solve Equations (1) and (2), we setup a matrix formalism, where vector Y includes all the magnitude measurements. The set of equations are given by a matrix L of nY
rows and nQ
columns. Here, nY
is the total number of magnitude measurements in Y, and nQ
is the number of free parameters (11 GC distances, zero-point, slope, and metallicity coefficient) in vector Q. The χ2 statistics is given as χ2 = (Y − LQ)T
C−1(Y − LQ), where C is the error matrix. The maximum-likelihood parameters are obtained using  , while the standard errors on the free parameters come from the covariance matrix
  . This setup of matrix equations is similar to those described in detail in Riess et al. (2016, in the Appendix). This matrix formalism is employed to obtain free parameters Q, which are used to compute residuals of the best-fitting linear regression. This process is iterated by removing the single largest outlier in each iteration until all residuals are within 3σ, where σ is the standard deviation of the global fit. We created 103 random realizations by varying the magnitudes, adopted mean metallicity, and reddening values within their uncertainties to obtain the final coefficients and their associated uncertainties.
4. Period–Luminosity–Metallicity Relations
We used JHKs
mean magnitudes for 964 RR Lyrae variables in GCs and 2MASS single-epoch magnitudes for 346 MW field stars jointly to derive the PLZ and PWZ relations. Three different samples of RR Lyrae stars were considered separately: RRab, RRc+RRd, and the combined sample of all 1310 RR Lyrae variables. The mixed-mode RRd variables have the dominant first-overtone periods as seen in Figure 1. Therefore, the first-overtone periods of RRc and RRd stars were fundamentalized using the equation:  (e.g., Coppola et al. 2015; Braga et al. 2022) for the combined sample of all 1310 RR Lyrae stars.
The intensity-averaged JHKs
magnitudes for variables in GCs were corrected for reddening assuming the previously mentioned reddening law of Cardelli et al. (1989) and absorption ratios, and using E(B − V) values provided by Harris (2010) listed in Table 1. The extinction-free Wesenheit magnitudes (Madore 1982) in NIR filters were defined as in Bhardwaj et al. (2016): WJ,H
= H − 1.83(J − H), 
 = K − 1.92(H − Ks
).
= K − 1.92(H − Ks
).
We simultaneously solved for individual GC distances and derived the PLZ relations for the global sample of 1310 RR Lyrae stars. In the case of RRc variables, we also added 52 RRc models with 0.25 < P < 0.45 days (Marconi et al. 2015) to the calibrator sample because there are only 25 MW field RRc stars. These RRc models allowed us to break the degeneracy between the metallicity coefficient and the zero-points. Table 2 lists the results of the best-fitting linear regression formalism discussed in Section 3. Figure 3 displays the PLZ/PWZ relations for the combined sample of RR Lyrae variables in GCs. The metallicity effect on RR Lyrae magnitudes is distinctly evident in the top panels showing that the metal-poor stars are brighter. Tighter PLZ/PWZ relations are seen in the bottom panels where the metallicity term is taken into account, and the residuals do not exhibit any significant trend as a function of the period or metallicity. These empirical metallicity coefficients are the most precisely determined in JHKs filters, and are in excellent agreement with the horizontal branch evolution and pulsation model predictions. There is a hint of increasing metallicity dependence at shorter wavelengths, but the differences are not statistically significant. We did not find any statistically significant changes in the PLZ relations for different metallicity scales and reddening values as discussed in Appendix A.

Figure 3. Near-infrared PLZ and PWZ relations for RR Lyrae variables in GCs in the JHKs
bands. In each case, the color-coded solid lines in the top panels correspond to [Fe/H] = [−0.5, −1.5, −2.5] dex. The solid line in the bottom panels shows the best-fitting linear regression while the dashed line displays the predicted relation from Marconi et al. (2015). The average residuals (ΔJ, ΔH, ΔKs
) in a period bin of  days are shown for visualization purposes. The data points are color coded according to the color bar.
Download figure:
Standard image High-resolution imageTable 2. NIR Period–Luminosity–Metallicity and Period–Wesenheit–Metallicity Relations
| Band | Type | a | b | c | σ | Nf |

| Δμ | Δa | Δb | Δc |
|---|---|---|---|---|---|---|---|---|---|---|---|
| J | RRL | −0.44 ± 0.03 | −1.83 ± 0.02 | 0.20 ± 0.02 | 0.05 | 1049 | 1.03 | 0.02 ± 0.05 | −0.06 | −0.07 | −0.02 |
| H | RRL | −0.74 ± 0.02 | −2.29 ± 0.02 | 0.19 ± 0.01 | 0.05 | 1037 | 0.98 | −0.01 ± 0.04 | −0.02 | 0.06 | −0.01 |
| Ks | RRL | −0.80 ± 0.02 | −2.37 ± 0.02 | 0.18 ± 0.01 | 0.05 | 1077 | 1.02 | −0.01 ± 0.03 | −0.02 | 0.12 | −0.00 |
| WJ,H | RRL | −1.20 ± 0.02 | −2.96 ± 0.02 | 0.18 ± 0.01 | 0.07 | 989 | 1.07 | −0.05 ± 0.04 | 0.01 | 0.20 | 0.02 |

| RRL | −1.06 ± 0.03 | −2.73 ± 0.02 | 0.16 ± 0.02 | 0.06 | 1096 | 0.99 | −0.04 ± 0.03 | 0.01 | 0.23 | 0.02 |

| RRL | −0.93 ± 0.02 | −2.45 ± 0.02 | 0.16 ± 0.01 | 0.07 | 1033 | 1.17 | −0.01 ± 0.04 | −0.01 | 0.13 | 0.02 |
| J | RRab | −0.46 ± 0.02 | −1.97 ± 0.04 | 0.20 ± 0.01 | 0.05 | 651 | 0.83 | 0.03 ± 0.05 | −0.05 | −0.01 | 0.01 |
| H | RRab | −0.74 ± 0.02 | −2.28 ± 0.03 | 0.19 ± 0.01 | 0.05 | 667 | 0.88 | −0.01 ± 0.04 | −0.02 | 0.04 | −0.00 |
| Ks | RRab | −0.81 ± 0.03 | −2.39 ± 0.03 | 0.18 ± 0.02 | 0.05 | 709 | 0.99 | −0.02 ± 0.04 | −0.01 | 0.12 | 0.00 |
| WJ,H | RRab | −1.19 ± 0.03 | −2.91 ± 0.04 | 0.18 ± 0.02 | 0.07 | 632 | 0.88 | −0.06 ± 0.04 | 0.02 | 0.24 | 0.02 |

| RRab | −1.07 ± 0.03 | −2.69 ± 0.04 | 0.16 ± 0.02 | 0.06 | 714 | 0.84 | −0.05 ± 0.05 | 0.04 | 0.20 | 0.03 |

| RRab | −0.93 ± 0.03 | −2.41 ± 0.04 | 0.16 ± 0.01 | 0.07 | 680 | 0.99 | 0.00 ± 0.06 | 0.01 | 0.07 | 0.01 |
| J | RRc+RRd | −0.89 ± 0.04 | −2.14 ± 0.05 | 0.17 ± 0.03 | 0.05 | 437 | 1.02 | 0.03 ± 0.04 | −0.18 | −0.32 | −0.02 |
| H | RRc+RRd | −1.23 ± 0.04 | −2.51 ± 0.05 | 0.17 ± 0.03 | 0.05 | 428 | 0.93 | 0.04 ± 0.02 | −0.08 | −0.19 | −0.01 |
| Ks | RRc+RRd | −1.30 ± 0.04 | −2.60 ± 0.05 | 0.17 ± 0.03 | 0.05 | 435 | 1.03 | 0.04 ± 0.03 | −0.08 | −0.12 | −0.02 |
| WJ,H | RRc+RRd | −1.72 ± 0.04 | −2.92 ± 0.06 | 0.18 ± 0.03 | 0.06 | 392 | 1.08 | 0.09 ± 0.05 | 0.00 | −0.16 | −0.01 |

| RRc+RRd | −1.55 ± 0.04 | −2.88 ± 0.05 | 0.18 ± 0.03 | 0.05 | 422 | 1.07 | 0.06 ± 0.03 | −0.03 | −0.02 | −0.02 |

| RRc+RRd | −1.37 ± 0.04 | −2.71 ± 0.05 | 0.18 ± 0.03 | 0.06 | 410 | 1.22 | 0.07 ± 0.04 | −0.11 | −0.04 | −0.03 |
Note. The zero-point (a), slope (b), metallicity coefficient (c), dispersion (σ), number of stars (Nf
), and chi-square per degree of freedom ( ) of the final PLR fits are tabulated. Δμ represents the mean and the standard deviation of residuals between distance moduli from this work and those from Baumgardt & Vasiliev (2021). The last three columns show the difference in the zero-points, the slopes, and the metallicity coefficients between predicted (Marconi et al. 2015) and empirical relations derived in this study. In the case of RRc+RRd stars only, the calibrator sample of MW field stars also includes 52 models from Marconi et al. (2015) as mentioned in the text.
Download table as: ASCIITypeset image
Figure 3 also shows the predicted PLZ/PWZ relations from (Marconi et al. 2015; corresponding to [Fe/H] = −0.5, −1.5 and −2.5 dex) which suggest a good agreement with our empirical relations. The last three columns of Table 2 list the differences in the slopes, zero-points, and metallicity coefficients between the theoretical (Marconi et al. 2015) and empirical PLZ/PWZ relations derived in this work. While the metallicity coefficients are very similar, there are some differences in the slopes and zero-points for some specific sample and/or filter combinations. In particular, the slope and zero-point of RRc stars in the J band are significantly shallower and fainter than the model predictions, respectively. We note that the error in the predicted slope for RRc stars in the J band is 0.08 mag (Marconi et al. 2015), and therefore the difference of −0.32 mag in the slopes between predicted and empirical relations is just beyond 3σ of their combined uncertainties. Similarly, the largest difference in the zero-point (−0.18 ± 0.06 mag) also occurs for RRc stars in the J band, but it is within ± 0.05 mag for most sample and/or filter combinations.
4.1. Distance Moduli to Globular Clusters
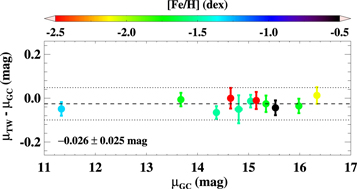
Table 1 also lists the average distance moduli to the GCs derived after solving Equations (1) and (2), for the PLZ and PWZ relations for the sample of all 1310 RR Lyrae stars. Figure 4 in Appendix B shows no obvious trend in the difference between the distance moduli derived in this work and those from Baumgardt & Vasiliev (2021) as a function of the metallicity. While the residual offset in the average distance moduli is statistically small for all RR Lyrae sample (−0.026 ± 0.025 mag), the RR Lyrae distances to GCs are systematically smaller using empirical calibrations for all/RRab sample and larger using semiempirical calibrations for the RRc+RRd sample (see Δμ in Table 2). Bhardwaj et al. (2021b) also found a similar result with absolute zero-points of −0.76/−0.84 mag in Ks using empirical/theoretical calibrations. The empirical calibrations use Gaia distances taking the parallax zero-point offset from Lindegren et al. (2021) into account. A fainter absolute zero-point of the empirical PLZ/PWZ relation, which results in smaller distance moduli, suggests an overcorrection in parallaxes because a smaller parallax zero-point offset than the Lindegren et al. (2021) correction will result in a brighter zero-point for RR Lyrae stars (see Bhardwaj et al. 2021b). A large scatter in the PLZ relations for MW field stars (Figure 2) precludes us from quantifying this small offset in parallaxes in the latest Gaia data. A comparison of the distance moduli listed in Table 1 also suggests that the difference is larger for metal-rich GCs while metal-poor GCs show excellent agreement. This difference can be attributed to a small number of both RR Lyrae stars and GCs for [Fe/H] < −1.2 dex (see Figure 1), which could affect the accuracy of the apparent zero-points of the PLZ relations, and in turn of the distance moduli, for the relatively metal-rich GCs.
4.2. Validation of the Empirical Period–Luminosity–Metallicity Relations
To validate the accuracy of our empirically derived PLZ and PWZ relations, we determined a distance to the LMC using NIR photometry available in the literature. We use ∼18,500 RR Lyrae stars (13611 RRab, 4848 RRc) from Cusano et al. (2021) with JKs photometry from the VMC survey together with their photometric metallicity and reddening estimates. Our empirical calibrations result in an average distance modulus to the LMC of 18.54 ± 0.13, 18.57 ± 0.12, and 18.60 ± 0.15 mag in the Ks band using the whole sample, RRab, and RRc+RRd stars, respectively. The quoted values and their uncertainties represent the peak and the width of the Gaussian distribution taking the uncertainties on the metallicity scale and on individual metallicities into account. When using the theoretical relations of Marconi et al. (2015), we obtained a distance of 18.60 ± 0.13, and 18.59 ± 0.15 mag for all/RRab and RRc+RRd samples, respectively, which reflects the difference in the slopes and zero-points between the empirical and theoretical calibrations. The difference in the LMC distance modulus with a percent-level precise value of 18.477 ± 0.026 mag (Pietrzyński et al. 2019) is likely due to the differences in the calibrator and target PLZ relations, and due to uncertainties in the photometric metallicities and reddening, and geometrical effects, which contribute to a 3 times larger scatter in the PLZ relations for RR Lyrae stars in the LMC.
5. Conclusions
We presented the results of an NIR monitoring program of GCs to quantify the metallicity dependence on the RR Lyrae PLZ and PWZ relations. The largest sample of 964 cluster RR Lyrae stars with homogeneous JHKs mean magnitudes based on time-series data in 11 GCs of different mean metallicities was used in this analysis. When anchored using additional 346 MW field RR Lyrae stars with Gaia parallaxes, we obtained purely empirical PLZ and PWZ relations that agree well with the theoretical predictions based on horizontal branch evolution and pulsation models. The metallicity coefficient of the NIR PLZ and PWZ relations is ∼0.2 mag dex−1, in excellent agreement with the predicted relations. We simultaneously obtained distance moduli to individual GCs and found those to be consistent with most recent and independent measurements in the literature based on Gaia data. While the metallicity coefficients and the slopes are firmly constrained, the absolute zero-points of the PLZ/PWZ relations are sensitive, at the percent-level precision, to the uncertainties in parallaxes, parallax zero-point offset, lack of homogeneous time-series photometry, and spectroscopic metallicities for MW field stars. Furthermore, any possible variations in the slopes of the underlying PLZ/PWZ relations in different stellar environments may also affect the zero-point, and this basic assumption of universality of the PLRs will be investigated in detail in a future study. Nevertheless, our accurate and precise empirical calibrations of the PLZ/PWZ relations will be crucial for RR Lyrae–based distance measurements and the calibration of the distance scale based on Population II standard candles in the era of space telescopes and next-generation ground-based facilities operating mainly at infrared wavelengths.
We thank the anonymous referee for the constructive referee report that helped improve the manuscript. This project has received funding from the European Union's Horizon 2020 research and innovation program under the Marie Sklodowska-Curie grant agreement No. 886298. This research was supported in part by the Australian Research Council Centre of Excellence for All Sky Astrophysics in 3 Dimensions (ASTRO 3D), through project number CE170100013. HPS acknowledges grant 03(1428)/18/EMR-II from Council of Scientific and Industrial Research (CSIR), India. CCN thanks the funding from the National Science and Technology Council (Taiwan) under the contract 109-2112-M-008-014-MY3. Access to the CFHT was made possible by the Institute of Astronomy and Astrophysics, Academia Sinica.
Facilities: CFHT-WIRCam - , Gemini FLAMINGOS-2. -
Software: IDL (Landsman 1993), Astropy (Astropy Collaboration et al. 2013).
Appendix A: Impact of Different Metallicity Scales and Reddening Values
We tested for possible variations in the PLZ relations due to different metallicity scales and reddening values in the literature using the full sample of 1310 RR Lyrae stars. Our calibrator sample of 346 RR Lyrae stars was adopted from Muraveva et al. (2018), which was based on the homogenized compilation of spectroscopic and photometric metallicities by Dambis et al. (2013) in the Zinn & West (1984) metallicity scale. Crestani et al. (2021) published high-resolution spectroscopic metallicities for 208 MW field RR Lyrae stars. There are 166 RR Lyrae stars in the Crestani et al. (2021) sample after restricting that to the same metallicity range and 2MASS quality flag criteria as in Section 2. The coefficients of the PLZ relations derived using these 166 stars together with 964 GCs variables are statistically consistent with those listed in Table 2 within 1σ of their quoted uncertainties. This was expected considering a small median offset of Δ[Fe/H] = 0.09 ± 0.02 dex for 133 common stars in the two calibrator samples of MW field stars.
In the case of mean metallicities of GCs, the two sets of independent estimates were obtained from the catalogs of Harris (2010) and Dias et al. (2016). The mean difference in the [Fe/H] values of 11 GCs is 0.03 dex between the estimates from Harris (2010) and Carretta et al. (2009). This difference in the [Fe/H] values is 0.08 dex between the measurements of Dias et al. (2016) and Carretta et al. (2009). Given these small mean differences with our adopted metallicities, the coefficients of the PLZ relations were found to be in agreement with the values listed in Table 2 within 0.5σ of their uncertainties, when using the aforementioned two independent sets of mean [Fe/H] values.
To investigate the impact of the adopted extinction law and reddening values, we obtained E(B − V) values from the Baystar19 3D dust map (Green et al. 2019). The Baystar19 map does not cover NGC 6441 or NGC 5139, for which E(B − V) values were adopted from Schlegel et al. (1998). The E(B − V) values from these maps are in the same units and the corresponding absorption ratios in JHKs were taken from Green et al. (2019, Table 1). After applying these independent reddening corrections, we derive the JHKs -band PLZ relations, which exhibit the same slope as listed in Table 2. The metallicity coefficients increase by 0.01 dex in all three NIR filters, and the zero-points are fainter by 0.04/0.02/0.02 mag in the J/H/Ks bands. These differences in the J- and HKs -band zero-points are within 1.4σ and 1σ of their associated uncertainties, respectively.
Appendix B: Difference in the Distance Moduli to Globular Clusters
Figure 4 displays the difference in the distance moduli listed in the last two columns of Table 1.
Figure 4. Difference between the distance moduli (μTW) resulting from Equation (1) and those from Baumgardt & Vasiliev (2021; μGC), as listed in Table 1. The mean and the standard deviations of the residuals are quoted at the bottom left. The dashed and dotted lines represent the mean and 3 times the standard deviation of the residuals, respectively.
Download figure:
Standard image High-resolution image
Footnotes
- 12