


Abstract
We have monitored the Didymos–Dimorphos binary asteroid in spectropolarimetric mode in the optical range before and after the DART impact. The ultimate goal was to obtain constraints on the characteristics of the ejected dust for modeling purposes. Before impact, Didymos exhibited a linear polarization rapidly increasing with phase angle, reaching a level of ∼5% in the blue and ∼4.5% in the red. The shape of the polarization spectrum was anticorrelated with that of its reflectance spectrum, which appeared typical of an S-class asteroid. After impact, the level of polarization dropped by about 1 percentage point (pp) in the blue band and about 0.5 pp in the red band, then continued to linearly increase with phase angle, with a slope similar to that measured prior to impact. The polarization spectra, once normalized by their values at an arbitrary wavelength, show very little or no change over the course of all observations before and after impact. The lack of any remarkable change in the shape of the polarization spectrum after impact suggests that the way in which polarization varies with wavelength depends on the composition of the scattering material, rather than on its structure, be this a surface or a debris cloud.
Export citation and abstract BibTeX RIS

Original content from this work may be used under the terms of the Creative Commons Attribution 4.0 licence. Any further distribution of this work must maintain attribution to the author(s) and the title of the work, journal citation and DOI.
1. Introduction
The goal of NASA's Double Asteroid Redirection Test (DART) was to test the deflection of a near-Earth object (NEO) through an impact by a dedicated spacecraft in the context of planetary defense (Daly et al. 2022). DART was launched on 2021 November 23 for a 10 month journey to the binary asteroid Didymos. The targeted system is composed of the 780 m asteroid Didymos (primary), around which orbits the 160 m secondary Dimorphos. The DART probe impacted Dimorphos head-on on 2022 September 26 at 23:14 UT, changing its orbital period around the primary by about 30 minutes and enabling the measurement of the efficiency of the kinetic impactor technique in producing a change in the linear momentum of the target (Thomas et al. 2022). The epoch of the impact was chosen to optimize the geometry for ground-based observing, hoping that observations will allow the assessment of the excess linear momentum exerted on Dimorphos as a result of ejecta leaving its surface due to the DART impact—which is essential for extrapolating the results of the DART impact on Dimorphos to other objects.
Linear polarization measurements have long been used as a remote sensing tool for the characterization of objects in the solar system. Measurements in the standard optical filters may be plotted as a function of the phase angle α, that is, the angle between the Sun and the observer, as seen from the target object. A simple Rayleigh scattering model predicts that the plane of polarization should be perpendicular to the scattering plane (the plane determined by the Sun, observer, and target object). In fact, at small phase angles (α ≲ 20°), the polarization is oriented in the direction parallel to the scattering plane; this phenomenon of negative polarization is commonly interpreted in terms of coherent backscattering (e.g., Muinonen et al. 2002; Muinonen 2004, and references therein) and scattering by wavelength-scale particles (e.g., Lumme & Rahola 1998; Muinonen et al. 2011). At larger phase angles, the polarization increases up to α ∼ 90°–100°, although main-belt asteroids may be observed only up to a maximum of α ≃ 30°–35°, where the polarization reaches at most a value of 1%–2%. The analysis of the global shape of the phase-polarization curves, combined with photometric and spectroscopic data, provides a way to assess the physical properties of the topmost surface layer of the surfaces of small solar system bodies, including the complex refractive index, particle size, packing density, and microscopic optical heterogeneity.
Important constraints may also be provided by the observations of how polarization depends upon wavelength. While multiband polarimetric measurements have been obtained and analyzed in the past (e.g., Belskaya 2009), spectropolarimetry of asteroids is still a relatively unexploited technique; to the best of our knowledge, the only data set published in the literature so far is the outcome of a mini-survey by Bagnulo et al. (2015), who showed, for instance, that objects characterized by very similar reflectance spectra may exhibit quite different polarized spectra, underscoring the fact that intensity measurements alone may not be sufficient to fully characterize the light scattering properties of planetary bodies. We therefore decided that a multiwavelength polarimetric monitoring of the Didymos–Dimorphos binary system before and after the DART impact would be especially useful to characterize the possible changes in the polarimetric properties of a binary system as a consequence of the excavation and ejection of a subsurface layer of regolith and subsequent variation of the surface properties of the two components of the binary system due to ejecta impacts on Didymos or Dimorphos. These observations are also unique because they are obtained at phase angles not observable from Earth for main-belt asteroids; only an handful of NEOs have been observed with broadband polarimetric techniques in the past.
In this letter, we describe spectropolarimetric measurements obtained at the ESO Very Large Telescope (VLT) before and after impact and provide a preliminary assessment of what these measurements tell us about the ejecta properties.
2. Observations
Polarimetry of the Didymos–Dimorphos system was acquired before and after the DART impact with the FORS2 instrument on the ESO VLT in both spectropolarimetric and imaging polarimetric mode, as well as through aperture polarimetry with the ALFOSC instrument on the Nordic Optical Telescope (NOT). Here we report the 10 polarization spectra obtained with VLT FORS2 from August 23 to October 24, five prior to and five after the DART impact. The quantity we are interested in as a function of the phase angle and wavelength is

where F∥ and F⊥ refer to the fluxes measured through a linear polarizer parallel or perpendicular to the scattering plane, respectively. The definition of Equation (1) is equivalent to that given by Zellner et al. (1974) as  , where P is the observed fraction of linear polarization, and θr is the angle between the position angle of the observed polarization and the normal to the plane of the scattering. Technical details about observing strategy, data reduction, and quality checks are given in the Appendix.
3. Results
The values of the synthetic broadband polarization measurements in the BVRI filters as a function of phase angle, calculated as explained in Appendix A.3, are given in Table 1 and plotted in Figure 1. It appears that in the filters BVRI, the polarization decreases with wavelength, reaching a plateau around the R and I filters (the data for the I filter are not shown in Figure 1, as they would overlap with the data in R). As will be further discussed in Section 4, the polarization spectra extend to the very near-IR and also contain information at wavelengths longer than those of the optical filters. The spectra show that at wavelengths longer than the I filter, the polarization starts to increase with wavelength, reaching values similar to those of the V band at λ ∼ 900 nm.

Figure 1. Symbols joined by dashed curves show the synthetic broadband polarization values as a function of the phase angle obtained from FORS2 spectropolarimetric observations. Solid curves represent the best fits obtained with Equation (2) on the data obtained prior to impact. Different symbols and colors refer to different filters as shown in the legend. The error bars would have a size about the same as the symbol size or smaller and hence are not shown. The dotted lines represent the ±1σ uncertainties around the best fits on the B- and R-filter values. The vertical dotted line shows the phase angle at the time of impact. Data for the I filter are not plotted, as they would largely overlap with the data in the R filter. Postimpact data are marked with the time at which they were obtained, measured in hours from impact. The inset shows the fractional variation of the observed polarization as explained in the text.
Download figure:
Standard image High-resolution imageTable 1. Broadband Polarization Values in the BVRI Filters Measured from the Spectra
| Date | Δt | α | Pr (%) | |||
|---|---|---|---|---|---|---|
| YYYY-MM-DD | (deg) | B | V | R | I | |
| 2022-08-28 | −716h 25m | 23.29 | 0.34 | 0.27 | 0.24 | 0.19 |
| 2022-09-07 | −471h 44m | 29.86 | 1.26 | 1.15 | 1.07 | 1.04 |
| 2022-09-17 | −232h 54m | 39.99 | 2.89 | 2.59 | 2.47 | 2.46 |
| 2022-09-23 | −91h 49m | 47.68 | 4.30 | 3.79 | 3.61 | 3.59 |
| 2022-09-26 | −15h 49m | 52.25 | 5.24 | 4.63 | 4.39 | 4.35 |
| 2022-09-27 | +05h 37m | 53.60 | 4.56 | 4.16 | 3.98 | 4.01 |
| 2022-09-28 | +33h 59m | 55.34 | 4.88 | 4.43 | 4.25 | 4.27 |
| 2022-09-30 | +80h 30m | 58.26 | 5.39 | 4.86 | 4.65 | 4.65 |
| 2022-10-01 | +104h 59m | 59.76 | 5.63 | 5.10 | 4.87 | 4.84 |
| 2022-10-24 | +633h 01m | 76.16 | 9.08 | 7.91 | 7.47 | 7.37 |
Note. The second column gives the time from impact. The uncertainties on the polarization values, dominated by systematics and not by photon noise, are estimated to be less than 0.1%.
Download table as: ASCIITypeset image
Figure 1 shows that the DART impact produced a dramatic effect; immediately after the impact, the polarization dropped by ∼1 percentage point (pp) in the B filter and ∼0.5 pp in the R filter. After the polarization drop induced by the impact, linear polarization continued to increase with phase angle with a slope similar to that observed prior to the impact.
To compare the polarization observed postimpact with the values that would have been expected from the untouched Didymos–Dimorphos system, it is useful to fit the preimpact polarimetric data with the linear-exponential function

in which α is the phase angle, and A, B, and C are free parameters. This semiempirical function (Kaasalainen et al. 2003) was found suitable to fit phase-polarization curves in asteroid polarimetry, at least up to phase angles of ∼50° (see also Cellino et al. 2015; Belskaya et al. 2017; Cellino et al. 2018, and references therein). In fact, the trigonometric function

in which b, c1, c2, and α0 are free parameters, would potentially provide a suitable description at much larger phase angles (e.g., Penttilä et al. 2005). However, with only five preimpact observations for each filter obtained at phase angles between ∼24° and 52°, the free parameters are not sufficiently constrained to allow for an accurate extrapolation.
The best-fitting curves for the measurements obtained in the various filters using Equation (2) are shown with solid lines in Figure 1. For the cases of the B and R filters, Figure 1 also shows the uncertainties (±1σ, ±2σ, and ±3σ intervals) of the fitted solutions.
The inset of Figure 1 shows the quantity

where Pr is the observed broadband polarization, and  is the value predicted by the best-fit solution based on the preimpact data. The result of this exercise convincingly shows that, for several days after impact, the polarization of the system was not back to values close to those that would have been expected without impact, and that the relative variation of the polarization was more pronounced at shorter than at longer wavelengths. Figure 1 also suggests that this lower polarization level persisted until at least 4 weeks after impact. However, this latter result crucially relies on the assumption that the exponential function of Equation (2) provides a realistic representation of the polarimetric curve even at phase angles as large as ∼75°; therefore, it should be taken with caution.
Figure 2 shows the reflectance and the polarization spectra obtained before the DART impact (September 26 at 07:26 UT) and after the impact (September 27 at 04:52 UT). One can clearly see the drop of polarization described by the wavelength-integrated values of Table 1, while no obvious change of the overall shape of the polarization spectrum as a function of wavelength is evident. Both polarization spectra are inversely correlated with the reflectance spectra, as predicted by the Umov law (Umov 1905), and reflectance (shown with dotted lines) seems slightly increased at longer wavelengths compared to shorter wavelengths. However, it must be clearly remarked that our spectrophotometric calibration (described in Appendix A.6) is very approximate, and the dotted lines of Figure 2 should only serve to verify that the observed polarization obeys Umov's law, something that does not always happen with asteroid polarization spectra (Bagnulo et al. 2015).
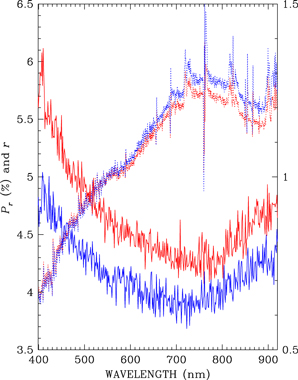
Figure 2. Polarization spectra obtained with FORS2 at the phase angles before (red solid line) and after (blue solid line) impact, with scale on the left axis. Dotted lines show the approximate relative reflectance spectra (normalized to 1 at 550 nm), with scale on the right axis.
Download figure:
Standard image High-resolution imageThe left panels of Figure 3 show all polarization spectra obtained at various phase angles. The shape and amplitude of the polarization spectra depend on the phase angle and wavelength. Following Bagnulo et al. (2015), we assume that the dependence of the polarization upon phase angle may be separated from the dependence upon wavelength as the product of two functions,  . The polarization spectra normalized to the value measured at an arbitrary wavelength λ = λ0,

are therefore independent of phase angle. The middle panels of Figure 3 show the normalized polarization spectra defined by Equation (5), which allow us to better compare the shape of the spectra among themselves (each spectrum was normalized to the value in the V band). The right panels show the difference between all normalized polarization spectra and the one obtained on September 26, about 20 hr before impact, multiplied by 10. It is possible to appreciate a small change produced by the impact in that, at shorter wavelengths, the postimpact neutralization of polarization seems marginally more efficient in the blue than in the red. This change could be caused by some instrumental effect, but since it is present in four spectra after the impact and none of the spectra obtained prior to the impact, it is possible that this tiny change is real, if marginal. According the the Umov law, this change in polarization should come with a relative increase of the reflectance at shorter wavelengths and decrease of the reflectance at longer wavelengths. This is not confirmed by our FORS2 reflectance spectra, but it must be remarked again that our spectrophotometric calibration is only approximate and cannot really be used to validate this marginal result from polarimetry.

Figure 3. Spectropolarimetry obtained at the phase angles shown on the right-hand side of the plots. The bottom panels refer to data obtained prior to impact, and the top panels refer to data after the impact. The left panels show the polarization spectra Pr(λ). The middle panels show the same spectra normalized to the values in the V filter. For display purposes, they are vertically offset by a quantity equal to the normalization factor. The right panels show the difference between each normalized polarization spectrum and the one obtained the night before the impact, September 26 at 07:26 UT), multiplied by 10. Again, for display purposes, these data have been offset by the normalization quantity Pr(V). For clarity, among the group of postimpact spectra (top panels), error bars are shown only for one representative case. In the middle and right panels, we have omitted the polarization spectrum obtained on 2022 August 23 because, being taken close to the inversion angle, it would represent a noisy ratio between two small quantities.
Download figure:
Standard image High-resolution image4. Discussion
Our observations represent the first spectropolarimetric monitoring of a binary asteroid system (the single components are too small and close to be resolved) over a large phase angle range (20°–75°). Most important, our observations of the DART mission offer a unique opportunity to compare the polarimetric properties of the light scattered by a surface (preimpact) and by a dust cloud (presumably) of similar composition (postimpact). Previous potential examples of similar polarimetric observations could be those of cometary nuclei (e.g., 2P/Encke; Boehnhardt et al. 2008) or "main-belt comets" or "active asteroids" (e.g., 133P/Elst-Pizarro or P/2010 R2; Bagnulo et al. 2010; Moreno et al. 2011a), which display a coma and/or tail close to perihelion and offer the opportunity to directly study their surface, as well as their ejecta. Despite the fact that their observations were a combination of the objects with and without activity (that is, of a surface and then a dust cloud), they are not comparable to the contrast displayed between the preimpact (point source) and postimpact (extended source) observations of the Didymos–Dimorphos system. The activity of the main-belt comets is caused by the fast rotation and shedding of the material from the surface due to centrifugal forces, and in some of them, the activity is caused by the undersurface ice (Jewitt & Hsieh 2023). So far, only asteroids Scheila and P/2010 A2 have been identified as active asteroids that showed activity caused by collision (Jewitt et al. 2010; Jewitt et al. 2011; Moreno et al. 2011b), and an impact experiment was performed on the surface of asteroid (162173) Ryugu using spacecraft Hayabusa2 (Kadono et al. 2020), but none of these events were monitored in polarimetric mode.
The closest event that can be compared with the DART one is the outcome of the Deep Impact (DI) mission to comet 9P/Tempel 1 (9P). The DI occurred in 2005 July when a 364 kg impactor struck the surface of 9P, excavating a dust cloud of cometary material from the nucleus (e.g., Meech et al. 2005). Rather than attempting to alter the orbital path of the comet, the goal of the mission was to study the material of the ejecta. Opposite to what we observed after the DART impact on Dimorphos, the observed polarization increased by ∼1 pp as a result of the DI event and quickly returned to the previous "regular" behavior a few days after the impact (Furusho et al. 2007; Hadamcik et al. 2007). The observed increase of polarization may be explained in the following terms. Cometary particles are mainly formed by fragile aggregates of submicron-sized grains (e.g., Hornung et al. 2016) that were shattered by the impact, producing a cloud of small particles dominated by those in the micron size range (Jorda et al. 2007). Light scattered by this type of smaller particle is expected to be more polarized than that scattered by larger particles. Furthermore, an increased amount of ice in the particles ejected from the subsurface layers may increase polarization, as shown by the comparison between the polarization from icy particles and that from silicates or organics made by Mackowski & Kolokolova (2022).
Our polarimetric measurements of Didymos–Dimorphos cover the three fundamental phases of the DART experiment, namely, (1) the preimpact situation, (2) a short interval of time (between 5.5 and ∼34 hr) just following the impact, and (3) the postimpact phase over a longer timescale of ∼4 weeks. Observations in imaging polarimetric mode of the latter will be reported in a forthcoming paper.
The preimpact polarimetric behavior is typical of moderate-albedo asteroids (mostly belonging to the S taxonomic complex) observed in the positive branch of polarization. For instance, around α = 50°, S-class asteroid (433) Eros exhibits in V-band light a fraction of linear polarization of ∼3%, that is, comparable to (but slightly less than) the values shown by the Didymos system. By contrast, low-albedo NEOs belonging to the B and F taxonomic classes, like (101955) Bennu and (3200) Phaethon (Cellino et al. 2018), exhibit a much steeper polarimetric curve. Figure 4 shows that the reflectance spectra of Didymos–Dimorphos also resemble those of an S-class asteroid like (433) Eros (NEO) or the main-belt asteroid (7) Iris. The polarization spectrum shows an overall decrease of polarization up to wavelengths around 0.7 or 0.8 μm, followed by an increase that, among the objects shown in this figure, is shared only by (7) Iris. A general decrease of polarization for increasing wavelength is typical of moderate-albedo asteroids observed in the positive polarization branch (Belskaya 2009; Bagnulo et al. 2015).
The most obvious consequence of the impact on the polarimetric behavior of the Didymos–Dimorphos system is a drastic decrease of the observed linear polarization. In the B filter, we measure a drop by 0.9–1.0 pp (from an expected value of ∼5.5% down to 4.6%). The observed drop is by ∼0.5–0.6 pp (from an expected ∼4.5% down to 4.0%) in the R filter. The relative change in polarization in the two filters was ∼17% and 13%, respectively.
Our current knowledge of the phenomena of light scattering would suggest as a possible explanation the occurrence of some mechanism injecting some amount of dust into the system, provoking neutralization of polarization by multiple scattering of the light coming from the object. Another phenomenon to take into account is that, as a consequence of the space weathering, the outer layers of asteroid surfaces become darker, i.e., more polarizing. The ejecta material, being excavated from the asteroid subsurface and not affected by the space weathering, could be lighter and produce less polarization.
The second piece of strong evidence from our observations is that, following the impact, the shape of the polarization spectrum did not change or changed very marginally, as shown in Figures 2 and 3. In fact, there are much more remarkable differences between the polarization spectra of different asteroids (even of similar spectral class) shown in the left panel of Figure 4 than between those of the system Didymos–Dimorphos observed before and after the impact.
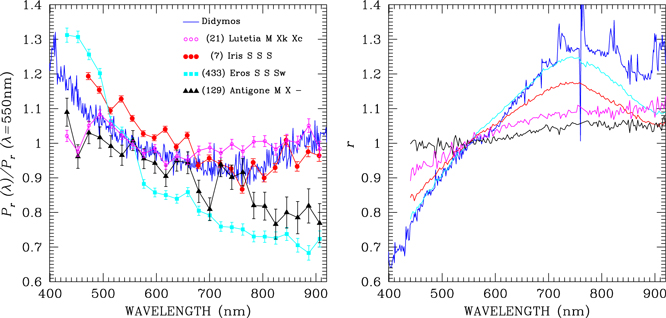
Figure 4. Left panel: normalized polarization spectra of Didymos obtained just before impact on 2022 September 26 compared to that of other asteroids. The right panel shows the corresponding reflectance spectra. The three symbols after the asteroid name refer to the classification according to Tholen (1984), Bus & Binzel (2002a), and DeMeo et al. (2009), respectively.
Download figure:
Standard image High-resolution imageThe situation following the impact was characterized by the presence of a cloud of ejecta expanding from the Didymos satellite (Li et al. 2022), which quickly surrounded the whole binary system before starting to slowly dissipate over longer timescales, while some fraction of this dust cloud was probably settling on the surfaces of the two companion asteroids. The dissipation of the dust cloud and the timescale needed by the system to reach a new stable configuration will be determined by the observations that will be collected in the months to come. From the point of view of the polarimetric behavior we have measured so far, we have to deal with the problem of a transient cloud of dust near Didymos and Dimorphos and the fact that the observed degree of linear polarization corresponds to that of the entire system of ejecta and small bodies.
Assuming, first, that the dust cloud and the surfaces of Didymos and Dimorphos are composed of the same material, a decrease in the degree of linear polarization would follow, for example, from the realistic hypothesis that the dust cloud particles are smaller than the particles on the surfaces, thereby having higher single-scattering albedos and less pronounced positive polarization in the current phase angle range (Muinonen et al. 1996; Liu et al. 2015; Frattin et al. 2022), while still large enough to scatter light in the geometric-optics regime (≲50 μm; Muñoz et al. 2021, and references therein).
Second, another realistic possibility would be that the ejecta particles would largely represent excavated, less space-weathered subsurface particles that would have higher single-scattering albedos than the topmost particles on the surfaces. In this case, there would be a slight compositional gradient in the regolith particles. The polarization spectra would depend, foremost, on the single-scattering albedos, and the similarity of the spectra would be explained in both cases. But we still have to infer the overall effect of the dust cloud on the degree of polarization more quantitatively, carefully addressing the contributions from Didymos, Dimorphos, the dust cloud, and even multiple scattering among these three components (see, e.g., Moreno et al. 2002). The fact that the polarization spectrum did not change appreciably may be a consequence of the fact that the transient cloud of ejecta consisted of dusty material having the same optical properties of the regolith layer covering the surfaces of the two system components, assumed to be identical for the two asteroids. This allows us to conclude that polarization behavior with wavelength is controlled by material composition rather than bulk structure (that is, solid surface versus diffuse cloud), while the total level of polarization was strongly affected by the dispersal of material into an ejecta cloud. More detailed characterization and modeling of these effects will be the subject of a future study, but the observations already point to the DART mission as an experiment providing important clues in the understanding of how scattering material may be characterized by polarimetry.
Based on observations obtained with the FORS2 instrument at the ESO Telescopes at the La Silla Paranal Observatory under program IDs 109.23GL.001 and 109.23GL.002 for Didymos–Dimorphos and 092.C-0639, 095.C-0925(A), and 097.C-0853(A) for the other asteroids shown in Figure 4. All raw data and calibrations of FORS2 are available at archive.eso.org. This work was supported by the DART mission, NASA contract No. 80MSFC20D0004 and NASA PSP grant 80NSSC21K1131. We are thankful for the great support received during observations by the VLT staff. Research by K.M., A.P., and M.G. is supported in part by Academy of Finland grant Nos. 336546 and 345115.
Appendix: Observations and Data Reduction
Spectropolarimetric observations were obtained with the FORS2 instrument (Appenzeller et al. 1998) attached to the Cassegrain focus of one of the ESO VLT units. FORS2 is an imaging and low-resolution spectrograph equipped with polarimetric optics consisting of a retarder wave plate that may be rotated at fixed positions and a Wollaston prism following a scheme described by Appenzeller (1967). Exposure times and other details of the observations are given in Table 2.
Table 2. Observing Log
| Date | UT | Exp. | α | Φ | χ | δ | Observed |
|---|---|---|---|---|---|---|---|
| YYYY-MM-DD | hh:mm:ss | (s) | (deg) | (deg) | (deg) | (deg) | Parameters |
| (1) | (2) | (3) | (4) | (5) | (6) | (7) | (8) |
| 2022-08-28 | 02:49:36 | 8 × 300 | 23.29 | 309.72 | 43.5 | 0, 22.5, ..., 157.5 | PQ and PU (NQ and NU ) |
| 2022-09-07 | 07:30:42 | 4 × 300 | 29.86 | 317.31 | 46.0 | 0, 45, 90, 135 | PQ (NQ ) |
| 2022-09-17 | 06:20:52 | 4 × 300 | 39.99 | 312.54 | 40.0 | 0, 45, 90, 135 | PQ (NQ ) |
| 2022-09-23 | 03:25:36 | 4 × 300 | 47.68 | 304.38 | 33.0 | 0, 45, 90, 135 | PQ (NQ ) |
| 2022-09-26 | 07:26:12 | 4 × 300 | 52.25 | 299.10 | 29.0 | 0, 45, 90, 135 | PQ (NQ ) |
| 2022-09-27 | 04:51:57 | 2 × 300 | 53.60 | 297.55 | 27.5 | 0, 45 | PQ |
| 2022-09-28 | 09:13:50 | 8 × 300 | 55.34 | 295.59 | 26.0 | 0, 22.5, ..., 157.5 | PQ and PU (NQ and NU ) |
| 2022-09-30 | 07:53:23 | 4 × 200 | 58.26 | 292.44 | 22.5 | 0, 45, 90, 135 | PQ (NQ ) |
| 2022-10-01 | 08:14:35 | 2 × 250 | 59.76 | 290.91 | 21.0 | 0, 45 | PQ |
| 2022-10-24 | 06:37:24 | 4 × 360 | 76.16 | 281.90 | 12.0 | 0, 22.5, 45, 67.5 | PQ and PU |
Note. Column (4) gives the phase angle α; column (5) gives the position angle Φ of the plane containing the Sun, Earth, and asteroid; and column (6) gives the instrument position angle χ on the plane of the sky. We always tried to set Φ + 90° ≃ χ for the reasons explained in the text. Column (7) gives the position angles δ of the λ/2 retarder wave plate used in the observing series, and column (8) gives the Stokes and null parameters that have been measured in the observing series (see text).
Download table as: ASCIITypeset image
A.1. Instrument Setting and Observing Strategy
We used grism 300 V, which, with the order-separating filter, covers a useful spectral range between approximately 430 and 920 nm. Following the considerations by Patat et al. (2010) and the comparisons between observations obtained both with and without the order-separating filter presented by Bagnulo et al. (2017), we concluded that it was safe to use grism 300 V without the order-separating filter and extend the observed interval range into the blue, down to ∼400 nm. For all observations, we set a 2'' slit width, which for an extended object would provide a spectral resolving power of ∼220. During the observations preimpact, the actual spectral resolution was dictated by the seeing. In general, we were interested in the overall shape of the continuum polarization, which did not require a high spectral resolution.
The CCD readout mode was set to 200 kHz and 2 × 2 binning, except for one case in which a slower readout (100 kHz) mode was adopted to confirm that the contribution of readout noise—which is higher in the faster readout mode—is negligible with respect to photon noise, at least in the context of the high signal-to-noise ratio (S/N) data needed to perform polarimetric measurements with the level of precision we are interested in.
What we are interested in measuring is defined by Equation (1), but the quantities F⊥ and F∥ of that equation cannot be accurately measured in such a simple way as observing through a linear polaroid without introducing large spurious effects. Various techniques and instrument designs have been proposed to maximize the accuracy of the polarimetric measurements (e.g., Serkowski 1974; Keller et al. 2015). The polarimetric mode of the FORS2 instrument is designed to implement the beam-swapping technique, that is, to allow the observer to swap the beams in which the polarization of the target is measured along two perpendicular directions, and recombine the signal so that the instrumental polarization is canceled (see, e.g., Bagnulo et al. 2009). We obtained various observing series with a λ/2 retarder wave plate at position angles δ = 0°, 22 5, 45°, ..., 1575 or subsamples of this set, as detailed in the observing log of Table 2. Reduced Stokes parameters PQ
= Q/I and PU
= U/I (as defined by Landi Degl'Innocenti et al. 2007) were obtained using the equations of the double-difference method,
5, 45°, ..., 1575 or subsamples of this set, as detailed in the observing log of Table 2. Reduced Stokes parameters PQ
= Q/I and PU
= U/I (as defined by Landi Degl'Innocenti et al. 2007) were obtained using the equations of the double-difference method,
where  and
and  are the fluxes measured in the parallel and perpendicular beams, respectively, with the retarder wave plate at the position angle δ; for X = Q, δj
∈ {0°, 90°}; for X = U, δj
∈ {225, 1125}, and N is the number of pairs of exposures per Stokes parameter.
9
are the fluxes measured in the parallel and perpendicular beams, respectively, with the retarder wave plate at the position angle δ; for X = Q, δj
∈ {0°, 90°}; for X = U, δj
∈ {225, 1125}, and N is the number of pairs of exposures per Stokes parameter.
9
Linear polarization was measured in the instrument reference system, that is, with respect to the direction of the principal plane of the Wollaston prism. Measurements in the instrument reference system  were transformed into the reduced Stokes parameters PX
expressed with respect to a reference direction perpendicular to the scattering plane using (e.g., Landi Degl'Innocenti et al. 2007)
were transformed into the reduced Stokes parameters PX
expressed with respect to a reference direction perpendicular to the scattering plane using (e.g., Landi Degl'Innocenti et al. 2007)
where Θ = χ + Φ + π/2 +  (λ); χ is the angle of the direction of the principal plane of the Wollaston prism counted counterclockwise from the great circle passing for the target and the north celestial pole; Φ is the position angle of the scattering plane, again counted counterclockwise from the great circle passing from the object and the north celestial pole; (λ) is the correction to add to δ to obtain the position angle of the fast axis of the retarder wave plate measured with respect to the direction of the principal beam of the Wollaston prism; and its values, which oscillate by a few degrees around zero, are tabulated in the FORS2 user manual. After this rotation, the quantity Pr defined in Equation (1) is exactly given by PQ
of Equation (A2). To save telescope time, in most of our observations, we rotated the instrument so that the position angle of the principal beam of the Wollaston prism was aligned to the direction perpendicular to the scattering plane; in other words, we set χ to obtain Θ ≃ 0. In that configuration, we expect
(λ); χ is the angle of the direction of the principal plane of the Wollaston prism counted counterclockwise from the great circle passing for the target and the north celestial pole; Φ is the position angle of the scattering plane, again counted counterclockwise from the great circle passing from the object and the north celestial pole; (λ) is the correction to add to δ to obtain the position angle of the fast axis of the retarder wave plate measured with respect to the direction of the principal beam of the Wollaston prism; and its values, which oscillate by a few degrees around zero, are tabulated in the FORS2 user manual. After this rotation, the quantity Pr defined in Equation (1) is exactly given by PQ
of Equation (A2). To save telescope time, in most of our observations, we rotated the instrument so that the position angle of the principal beam of the Wollaston prism was aligned to the direction perpendicular to the scattering plane; in other words, we set χ to obtain Θ ≃ 0. In that configuration, we expect  and (for symmetry reasons)
  . The alignment was not always perfect because the exact epoch of the execution of the observations in service mode could not be predicted in advance. The observations were thus corrected assuming that PU
= 0 in Equation (A2) and deriving
. The alignment was not always perfect because the exact epoch of the execution of the observations in service mode could not be predicted in advance. The observations were thus corrected assuming that PU
= 0 in Equation (A2) and deriving  . From the values of Φ and χ given in Table 2, one can see that this correction was practically negligible in all cases.
A.2. Correction for Instrumental Polarization
Previous literature (e.g., Patat & Romaniello 2006; Fossati et al. 2007; Bagnulo et al. 2009, 2017; Cikota et al. 2017) has highlighted the presence of a small offset value of instrumental polarization mainly due to crosstalk from I to Q and from I to U, which, in the center of the field of view and in spectropolarimetric mode, is of the order of 0.1%. This was better quantified by Cikota et al. (2017) as
where λ is expressed in angstroms. We note that these values refer to the instrument with position angle set to zero, and they need to be rotated to take into account the instrument position angle χ at the time of the observations using formulae similar to those of Equation (A2).
A.3. Filter Polarimetry from Polarization Spectra
For comparison with previous and future broadband filter measurements, we have calculated the quantities

where TF is the transmission function of a certain F filter, and
In this work, we consider the transmission curves of the FORS2 filters bhigh, vhigh, R_SPECIAL, and I_BESS tabulated in the instrument webpages; in this paper we refer to these filters with the symbols B, V, R, and I, respectively. The actual broadband linear polarization values do indeed depend on the filter transmission curves, but only slightly. For instance, if we were considering the transmission curve of the V Bessel filter used by the ACAM instrument of the William Herschel Telescope, instead of the FORS2 V filter, the value measured on September 1 would result in 5.092% instead of 5.096%. Effectively, these differences are negligible in the context of this study.
A.4. Rebinning
The polarization spectra may be rebinned to increase the S/N at the expenses of the spectral resolution. We note that rebinning must be carried out on the original fluxes f∥ and f⊥ rather than on the final reduced Stokes parameters. The dispersion of the original frames was ∼0.3 nm pixel–1; all spectra shown in the figures of this paper are shown with an ∼1.3 nm wavelength bin.
A.5. Uncertainties
The analytical expressions for the uncertainties of the reduced Stokes parameters may be found in Appendix A of Bagnulo et al. (2009). Practically, they are well approximated by the inverse of the S/N accumulated in all beams used to measure the polarization in a certain wavelength bin. When fluxes are integrated to calculate the polarization in broadband filters, formally, the S/N becomes extremely high, and the real uncertainties become dominated by instrumental polarization. A reasonable estimate is that after the correction given by Equation (A3), the uncertainty of the polarization measured in broadband filters is of the order of 0.05 - 0.10% (see also Appendix A.7).
A.6. Reflectance Spectra
In principle, our observations could also be used to obtain reflectance spectra by observing solar analogs at the same airmass as the target and with the same instrument setting. However, our target was observed by other instruments and telescopes to obtain exactly this information. Therefore, it was decided that concentrating FORS2 on the acquisition of polarimetric data would represent a better use of telescope time. Nevertheless, we used archive observations of a solar analog, star HD 144585, obtained with FORS2 in spectropolarimetric mode on 2016 April 17, to calculate the approximated reflectance spectra of Didymos shown in Figures 2 and 4. The wavelength-dependent extinction coefficients for Paranal tabulated by Patat et al. (2011) were used to correct the fluxes obtained at different airmasses. The remaining asteroid reflectance spectra of Figure 4 are from Bus & Binzel (2002b) and Binzel et al. (2004).
A.7. Quality Checks
The quality of our observations was checked with various tests. First of all, observations obtained on August 23 and September 28 were examined to check that the polarization was all in PQ
, and that PU
was consistent with zero. These observations were taken with Θ ≃ 0, and they were also used to check that  as explained in Appendix A.1. A small inconsistency was found in the bluest regions of the spectrum, in that the PU
values at shorter wavelengths were found to be systematically slightly different from zero. We ascribed this discrepancy to an incorrect characterization of the chromathism of the retarder wave plate (λ). The position angle of the polarization measured on September 28 was used to apply a small correction to the (λ) function tabulated in the instrument user manual, in practice decreasing its value around the B filter by about 1°. With this correction, the PU
values also became perfectly consistent with zero in the bluest spectral regions. It was also verified that applying the small correction of instrumental polarization given by Equation (A3), rotated to take into account the actual instrument position angle, led to a better consistency with zero of the PU
profile observed on August 23.
as explained in Appendix A.1. A small inconsistency was found in the bluest regions of the spectrum, in that the PU
values at shorter wavelengths were found to be systematically slightly different from zero. We ascribed this discrepancy to an incorrect characterization of the chromathism of the retarder wave plate (λ). The position angle of the polarization measured on September 28 was used to apply a small correction to the (λ) function tabulated in the instrument user manual, in practice decreasing its value around the B filter by about 1°. With this correction, the PU
values also became perfectly consistent with zero in the bluest spectral regions. It was also verified that applying the small correction of instrumental polarization given by Equation (A3), rotated to take into account the actual instrument position angle, led to a better consistency with zero of the PU
profile observed on August 23.
Other important checks were systematically performed by determining the null profiles NQ and NU and making sure that they were always consistent with zero within the error bars. The null profiles are defined as
and practically represent the difference between two consecutive measurements of a Stokes parameter. Instrument flexures and/or inaccurate guiding could cause the null profile to exhibit significant departures from zero, which in fact were never observed in any of our data sets. Figure 5 shows the NQ values for the phase angle at which they could be measured. All points are consistent with zero within the estimated uncertainties of 0.05%.

Figure 5. The NQ values calculated in the BVRI filters, offset by 0%, +0.5%, +1.0%, and +1.5%, respectively. Error bars are set to 0.05%.
Download figure:
Standard image High-resolution image
A.8. Spectropolarimetry of Asteroids Shown in Figure 4
Observations of asteroids (7) Iris, (21) Lutetia, (129) Antigone, and (433) Eros were obtained with the same technique, instrument, and instrument settings as for the binary system Didymos–Dimorphos. Observing dates were 2013 October 25 at phase angle α = 282 for Iris (already published by Bagnulo et al. 2015), 2015 June 2 (α = 275) for Lutetia, 2015 April 17 (α = 245) for Antigone, and 2016 July 6 (α = 282) for Eros.
Footnotes
- 9