


Abstract
The millimeter-wave spectrum of the SiP radical (X2Πi) has been measured in the laboratory for the first time using direct-absorption methods. SiP was created by the reaction of phosphorus vapor and SiH4 in argon in an AC discharge. Fifteen rotational transitions (J + 1 ← J) were measured for SiP in the Ω = 3/2 ladder in the frequency range 151–533 GHz, and rotational, lambda doubling, and phosphorus hyperfine constants determined. Based on the laboratory measurements, SiP was detected in the circumstellar shell of IRC+10216, using the Submillimeter Telescope and the 12 m antenna of the Arizona Radio Observatory at 1 mm and 2 mm, respectively. Eight transitions of SiP were searched: four were completely obscured by stronger features, two were uncontaminated (J = 13.5 → 12.5 and 16.5 → 15.5), and two were partially blended with other lines (J = 8.5 → 7.5 and 17.5 → 16.5). The SiP line profiles were broader than expected for IRC+10216, consistent with the hyperfine splitting. From non-LTE radiative transfer modeling, SiP was found to have a shell distribution with a radius ∼300 R*, and an abundance, relative to H2, of f ∼ 2 × 10⁻⁹. From additional modeling, abundances of 7 × 10⁻⁹ and 9 × 10⁻¹⁰ were determined for CP and PN, respectively, both located in shells at 550–650 R*. SiP may be formed from grain destruction, which liberates both phosphorus and silicon into the gas phase, and then is channeled into other P-bearing molecules such as PN and CP.
Export citation and abstract BibTeX RIS
1. Introduction
Phosphorus is a key ingredient for the origin of life. It is the fifth most abundant element in living systems by mass after C, N, O, and H (e.g., Maciá 2005), and plays a major role in replication, metabolism, and cellular structure. In addition to its obvious biological importance, phosphorus is relevant in solar system mineralogy. Apatite, Ca10(PO4)6(OH,F,Cl)2, is widely distributed in planetary bodies, including moon rocks and meteorites, as are other phosphates (e.g., Hughes & Rakovan 2015). The phosphide schreibersite, (Fe,Ni)3P, is commonly found in meteorites (Pasek 2019), and has been identified in comets (Brownlee et al. 2012). The element also exists in the atmospheres of Jupiter and Saturn as gas-phase PH3, phosphine (e.g., Fletcher et al. 2009).
Outside the solar system, phosphorus has been an elusive element. From the atomic viewpoint, the favorable transitions of this element either occur in the near-infrared (PI) or in the far-ultraviolet (PII). They therefore are in regions generally inaccessible by ground-based telescopes. Furthermore, the UV lines are often contaminated by the stellar continuum (Roederer et al. 2014), while those in the near-infrared are blocked by atmospheric telluric features (Majewski et al. 2017). There is therefore limited information on the element in the diffuse ISM and in stellar photospheres (e.g., Hinkel et al. 2020).
Molecules containing phosphorus, on the other hand, offer an alternative avenue by which to trace this element in the ISM. The first interstellar P-bearing compound detected was PN, identified toward Orion-KL (Ziurys 1987). PN was subsequently observed in additional molecular clouds (e.g., Turner et al. 1990; Fontani et al. 2016; Lefloch et al. 2016). CP was then identified in the shell of the carbon-rich asymptotic-giant branch (AGB) star, IRC + 10216 (Guélin et al. 1990), followed by PN, CCP, HCP, and PH3 (e.g., Halfen et al. 2008; Milam et al. 2008; Tenenbaum & Ziurys 2008; Agúndez et al. 2007, 2008, 2014). PO and PN were subsequently observed in the O-rich envelopes of supergiants, VY Canis Majoris and NML Cygni (Tenenbaum et al. 2007; Milam et al. 2008; Ziurys et al. 2018), as well as in those of more ordinary AGB stars (De Beck et al. 2013; Ziurys et al. 2018). The biologically relevant PO has more recently been identified in a series of molecular clouds, including the star-forming regions W51, W3(OH), L1157, G + 0.693-0.03, and AFGL 5142 (Lefloch et al. 2016; Rivilla et al. 2016, 2018; Bergner et al. 2019; Rivilla et al. 2020), and in the shocked "plateau" outflow of Orion-KL (Bernal et al. 2021). PN and PO have also been detected toward low mass protostars (Wurmser & Bergner 2022), and PN has been identified toward the starburst galaxy NGC 253 (Haasler et al. 2022).
The identification of six phosphorus-containing molecules thus far suggests that other such species might be present in circumstellar/interstellar gas. However, new discoveries depend on the availability of accurate rest frequencies. Here we present the first laboratory measurement of the pure rotational spectrum of the SiP radical (X2Πi). Multiple transitions were recorded in the range 151–533 GHz. Based on these new data, an astronomical search was conducted toward IRC+10216 using the Arizona Radio Observatory (ARO) telescopes. In this Letter, we describe our laboratory and observational results and implications for interstellar phosphorus chemistry.
2. Experimental
The pure rotational spectrum of the SiP radical (X2Πi) was recorded using one of the direct-absorption spectrometers of the Ziurys group (Savage & Ziurys 2005). The radiation sources are phase-locked Gunn oscillators, used in combination with Schottky diode multipliers such that the frequency range 65–850 GHz can be accessed. The radiation is quasioptically passed through a 1 m long glass reaction cell, sealed with focusing lenses at either end, and into a helium-cooled hot electron bolometer detector. Two cylindrical electrodes support a longitudinal AC discharge across the cell. Frequency modulation of the Gunn oscillator is employed for phase-sensitive detection. Silicon phosphide was synthesized by the reaction of gas-phase phosphorus, produced by heating the red form of the element, with SiH4 in an AC discharge in argon. Optimized signals were produced with ∼30 mTorr of ∼0.8% SiH4 in argon, with an AC discharge power of 250 W (600 Ω impedance).
Transition frequencies were determined using 5 MHz wide frequency scans, centered at a given feature. An average of six scans, three in ascending and three in descending frequency, were typically needed to achieve a reasonable signal-to-noise level. The estimated experimental accuracy is ±50 kHz.
3. Observations
The measurements were conducted December 2018—June 2022 using the facilities of the ARO: the 12 m at Kitt Peak and the Submillimeter Telescope (SMT) on Mt. Graham, AZ. The 1 mm observations, conducted with the SMT, were averaged with previous data from the spectral survey of Tenenbaum et al. (2010). A dual-polarization receiver was used consisting of ALMA Band 6 sideband-separating (SBS) mixers, with typical image rejection of >15 dB. The temperature scale for the SMT is TA *, the chopper-wheel corrected scale, where TR = TA*/ηb and ηb is the main beam efficiency (ηb = 0.72 for the SMT). A 2048-channel filterbank with 1 MHz resolution was employed as the backend, configured in parallel mode.
The 2 mm observations were conducted with the ARO 12 m. A dual-polarization receiver with SBS mixers, developed at ARO, was employed for these measurements, with typical image rejections >20 dB. The temperature scale at the 12 m is TA* as defined, and ηb = 0.82 at 2 mm. The backend used was the ARO Wideband Spectrometer (AROWS), configured with 2 × 4 GHz of bandwidth for each receiver channel and 625 kHz spectral resolution.
Observations were conducted in beam-switching mode, with a throw of ±2', toward IRC+10216 (α = 9h47m57 4; δ = 13°16'44.0'' (J2000.0)). Local oscillator shifts of 10–20 MHz for all measurements were performed to check for image contamination; for the SMT, the IF frequency was also varied (∼5–7 GHz). Pointing and focus were regularly checked using close-by planets such as Jupiter and Venus, or line pointing on CO.
4. Results and Analysis
4.1. Laboratory Spectroscopy
The initial search for SiP was based on the previous laser induced fluorescence (LIF) study of Jakubek et al. (2002) and focused on the lower-lying spin-orbit ladder, Ω = 3/2, which was predicted to consist of closely spaced lambda doublets. After over 20 GHz of scanning (∼2.5 B), a repeating set of doublets was found within ∼1 GHz of the predictions, separated by a few MHz. As scanning continued to lower frequency, each doublet then further split into two lines, creating a closely spaced quartet. As the frequency further decreased, the features evolved into a broad doublet.
This behavior can be explained by a combination of lambda doubling and hyperfine interactions, the latter arising from phosphorus nuclear spin of I = 1/2. The lambda doubling for the Ω = 3/2 state increases with J, from ∼0.2 MHz at 151 GHz to ∼6 MHz at 485 GHz. The hyperfine splitting does the opposite. As a consequence, at higher frequency, only a lambda doublet is observed, as the hyperfine splitting collapses. As the frequency decreases, the hyperfine components from the doublets cross and then blend together, creating another "doublet," but with much broader features. Along with chemical tests, which showed the lines depended on both phosphorus and silane, this pattern securely identified the spectra as arising from the Ω = 3/2 ladder of SiP. Lambda doublets arising from the Ω = 1/2 spin-orbit ladder were subsequently found; their splitting was considerably larger, as predicted, but the spectra were obviously perturbed. These data are the subject of another paper (Burton et al. 2022).
The pattern observed for the Ω = 3/2 spin-orbit component of SiP is illustrated in Figure 1. Here, measured spectra of the J = 30.5 ← 29.5, J = 14.5 ← 13.5, and J = 9.5 ← 8.5 rotational transitions of SiP in the Ω = 3/2 ladder near 485 GHz, 231 GHz, and 151 GHz are shown. The lambda doublets are labeled by e and f , and the sets of hyperfine components by Fe or Ff , depending on their lambda doublet, where F = J + I. The spectrum in the upper panel (J = 30.5 ← 29.5) only shows the lambda doublets, as the hyperfine splitting is collapsed. The quartet pattern is clearly visible in the middle panel (J = 14.5 ← 13.5), as the hyperfine interaction increases to lower frequency. The splitting continues to increase until two hyperfine components of opposite lambda doublets cross and then blend together, creating two broad features, as shown in the lower panel (J = 9.5 ← 8.5).
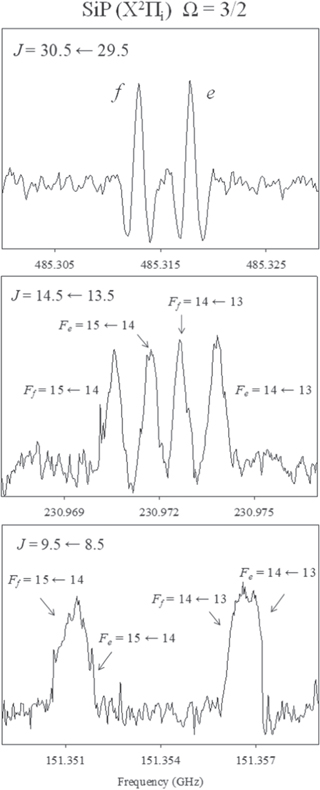
Figure 1. Laboratory spectra of SiP (X2Πi) in the Ω = 3/2 ladder showing the J = 30.5 ← 29.5, J = 14.5 ← 13.5 and J = 9.5 ← 8.5 rotational transitions near 485 GHz, 231 GHz, and 151 GHz, respectively. The lambda doublets are labeled by e and f , and the phosphorus hyperfine components by quantum number F (Ff and Fe specifically). The J = 30.5 ← 29.5 line (top panel) only shows lambda doublets, as the hyperfine is collapsed. In the J = 14.5 ← 13.5 transition (middle panel), the spectrum is a doublet of doublets, as the hyperfine interaction is resolved. For the J = 9.5 ← 8.5 line (lower panel), the hyperfine components of opposite lambda doublets blend together, creating doublets with broader linewidths. The spectrum in the top panel is a single 110 MHz wide scan, truncated to 30 MHz; the middle and lower spectra are six scan averages, each 10 MHz in frequency.
Download figure:
Standard image High-resolution imageOverall, 15 rotational transitions (J + 1 ← J) were measured for SiP in the Ω = 3/2 ladder in the frequency range 151–533 GHz, as listed in Table 1. The data were analyzed using a Hund's case (c) Hamiltonian consisting of rotational, effective lambda doubling (qeff ) and magnetic hyperfine (h) terms. Note that h = aΛ + (b + c)Σ = a + 1/2 (b + c) in this case. The results of this analysis are given in Table 2; the rms of the fit was 55 kHz. For comparison, the rotational constant for the Ω = 3/2 ladder was estimated from the LIF study of Jakubek et al. (2002). The derived constant, B3/2 ∼ 7917 MHz, is within 50 MHz of the measured mm-wave value, in good agreement.
Table 1. Transition Frequencies of SiP (X2 Πi Ω = 3/2) a
| J' ← J'' | F' ← F'' | Parity | νobs | νobs–νcalc |
|---|---|---|---|---|
| 8.5 ← 7.5 b | 9 ← 8 | f | 135422.130 | ⋯ |
| 9 ← 8 | e | 135422.532 | ⋯ | |
| 8 ← 7 | f | 135429.113 | ⋯ | |
| 8 ← 7 | e | 135429.515 | ⋯ | |
| 9.5 ← 8.5 | 10 ← 9 | f | 151351.095 | 0.058 |
| 10 ← 9 | e | 151351.538 | −0.001 | |
| 9 ← 8 | f | 151356.500 | −0.007 | |
| 9 ← 8 | e | 151356.912 | −0.097 | |
| 13.5 ← 12.5 b) | 14 ← 13 | f | 215050.405 | ⋯ |
| 14 ← 13 | e | 215051.415 | ⋯ | |
| 13 ← 12 | f | 215052.832 | ⋯ | |
| 13 ← 12 | e | 215053.843 | ⋯ | |
| 14.5 ← 13.5 | 15 ← 14 | f | 230970.567 | −0.051 |
| 15 ← 14 | e | 230971.745 | −0.036 | |
| 14 ← 13 | f | 230972.709 | 0.058 | |
| 14 ← 13 | e | 230973.790 | −0.025 | |
| 15.5 ← 14.5 | 16 ← 15 | f | 246888.654 | −0.068 |
| 16 ← 15 | e | 246890.020 | −0.028 | |
| 15 ← 14 | f | 246890.498 | 0.064 | |
| 15 ← 14 | e | 246891.731 | −0.032 | |
| 16.5 ← 15.5 | 17 ← 16 | f | 262804.558 | −0.024 |
| 17 ← 16 | e | 262806.060 | −0.022 | |
| 16 ← 15 | f | 262806.060 | 0.029 | |
| 16 ← 15 | e | 262807.548 | 0.015 | |
| 17.5 ← 16.5 b) | 18 ← 17 | f | 278718.059 | ⋯ |
| 18 ← 17 | e | 278719.745 | ⋯ | |
| 17 ← 16 | f | 278719.288 | ⋯ | |
| 17 ← 16 | e | 278720.976 | ⋯ | |
| 20.5 ← 19.5 | 21 ← 20 | f | 326442.748 | −0.066 |
| 20 ← 19 | f | 326443.630 | 0.063 | |
| 21 ← 20 | e | 326445.034 | −0.078 | |
| 20 ← 19 | e | 326445.945 | 0.075 | |
| 21.5 ← 20.5 | 22 ← 21 | f | 342345.318 | −0.052 |
| 21 ← 20 | f | 342346.111 | 0.104 | |
| 22 ← 21 | e | 342347.855 | −0.037 | |
| 21 ← 20 | e | 342348.622 | 0.088 | |
| 22.5 ← 21.5 | 23 ← 22 | f | 358244.755 | −0.088 |
| 22 ← 21 | f | 358245.380 | 0.000 | |
| 23 ← 22 | e | 358247.593 | −0.005 | |
| 22 ← 21 | e | 358248.101 | −0.040 | |
| 23.5 ← 22.5 | 24 ← 23 | f | 374141.078 | −0.013 |
| 23 ← 22 | f | 374141.578 | 0.038 | |
| 24 ← 23 | e | 374144.123 | 0.033 | |
| 23 ← 22 | e | 374144.632 | 0.087 | |
| 27.5 ← 26.5 | 28 ← 27 | f | 437691.076 | 0.074 |
| 27 ← 26 | f | 437691.106 | −0.083 | |
| 28 ← 27 | e | 437695.146 | 0.084 | |
| 27 ← 26 | e | 437695.176 | −0.083 | |
| 28.5 ← 27.5 | 29 ← 28 | f | 453569.080 | 0.082 |
| 28 ← 27 | f | 453569.080 | −0.056 | |
| 29 ← 28 | e | 453573.437 | 0.093 | |
| 28 ← 27 | e | 453573.437 | −0.057 | |
| 29.5 ← 28.5 | 30 ← 29 | f | 469442.977 | 0.061 |
| 29 ← 28 | f | 469442.977 | −0.033 | |
| 30 ← 29 | e | 469447.603 | 0.046 | |
| 29 ← 28 | e | 469447.603 | −0.061 | |
| 30.5 ← 29.5 | 31 ← 30 | f | 485312.639 | 0.025 |
| 30 ← 29 | f | 485312.639 | −0.030 | |
| 31 ← 30 | e | 485317.622 | 0.063 | |
| 30 ← 29 | e | 485317.622 | −0.005 | |
| 31.5 ← 30.5 | 32 ← 31 | f | 501177.950 | 0.000 |
| 31 ← 30 | f | 501177.950 | −0.018 | |
| 32 ← 31 | e | 501183.202 | −0.003 | |
| 31 ← 30 | e | 501183.202 | −0.037 | |
| 32.5 ← 31.5 | 33 ← 32 | f | 517038.771 | −0.009 |
| 32 ← 31 | f | 517038.771 | 0.005 | |
| 33 ← 32 | e | 517044.343 | −0.011 | |
| 32 ← 31 | e | 517044.343 | −0.014 | |
| 33.5 ← 32.5 | 34 ← 33 | f | 532894.938 | −0.025 |
| 33 ← 32 | f | 532894.938 | 0.019 | |
| 34 ← 33 | e | 532900.838 | −0.025 | |
| 33 ← 32 | e | 532900.838 | 0.025 |
Notes.
a All values in MHz. b Predicted transition based on case (c) fit.Table 2. Spectroscopic Constants for SiP (X2 Πi Ω = 3/2)
| Parameter | This work a | LIF Study b ) |
|---|---|---|
| B | 7967.0589(13) | 7917 |
| D | 0.00595192(78) | |
| qeff | 0.001869(85) | |
| qeffD | −5.9(5.4) × 10−8 | |
| h3/2 | 359(11) | |
| h3/2D | 0.355(43) | |
| rms | 0.055 |
Notes.
a All values in MHz; uncertainties are 3σ. b Jakubek et al. (2002).Download table as: ASCIITypeset image
4.2. Astronomical Observations
Following the laboratory measurements, a search was conducted for the 2 and 1.2 mm transitions of SiP toward the envelope of AGB star IRC+10216. Unfortunately, four of the eight transitions were completely contaminated by other strong lines. The J = 14.5 → 13.5 transition near 230 GHz was masked by CO, while the J = 9.5 → 8.5, J = 10.5 → 9.5, and J = 15.5 →14.5 transitions were obscured by C4H v7 = 1, C13CCN, and C4H v7 = 1, respectively. Only the J = 8.5 → 7.5, J = 13.5 → 12.5, J = 16.5 → 15.5, and J = 17.5 → 16.5 were not completely hidden. As shown in Figure 2, the J = 13.5 → 12.5 and J = 16.5 → 15.5 were clean of contamination and appear as individual lines in IRC+10216 (middle panels), although slightly broadened by lambda doubling and phosphorus hyperfine structure. The J = 8.5 → 7.5 line is a "shoulder" on the J = 48.5 → 47.5 transition of C6H (top panel), while the J = 17.5 → 16.5 transition appears as a "trough" between features of Si13CC and SiC2 v3 = 1 (bottom panel); emission is clearly present at the respective frequencies. There are no other molecules that can account for the SiP features. Integration times are 113, 112, 103, and 61 hr at 278, 262, 215, and 135 GHz, respectively.

Figure 2. Spectra of SiP (X2Πi) measured toward IRC+10216 using the ARO telescopes. The temperature scale is TA*(K). The positions of the four phosphorus hyperfine components are given in red (or gray scale) underneath each spectrum. In the top panel, the J = 8.5 → 7.5 transition is shown near 135 GHz, which appears as a shoulder on the J = 48.5 → 47.5 transition of C6H. The two middle panels display the J = 13.5 → 12.5 and J = 16.5 → 15.5 lines near 215 and 263 GHz, respectively, which are uncontaminated and display a broadened linewidth due to hyperfine structure. The bottom panel shows the J = 17.5 → 16.5 transition near 279 GHz, which appears in between two stronger features arising from Si13CC and SiC2 (v3 = 1). The ESCAPADE fits are shown over the line profiles in the inset in each panel. The spectra at 1 mm were measured with the ARO SMT (2 MHz resolution), while the 2 mm line was observed with the ARO 12 m (1.25 MHz resolution). Integration times are 103, 112, 113, and 61 hr for 215 GHz, 262 GHz, 278 GHz, and 135 GHz.
Download figure:
Standard image High-resolution image
The line parameters TA*(K), VLSR and ΔV1/2 for SiP were derived from the line profiles and are listed in Table 3. As shown in the table, the lines are quite weak with TA*(K) ≤ 1.2 mK, and appear at the expected velocity, VLSR = −26 km s−1. The nominal linewidths (∼36–39 km s−1) are slightly broader than those typically found for this object (ΔV1/2 ∼ 30 km s−1) because of hyperfine splitting.
Table 3. Observations of SiP (X2 Πi) and Related Molecules Toward IRC+10216
| Molecule | Transition a | TA*(mK) | VLSR (km s−1) | ΔV1/2(km s−1) | f0 c | rpeak (R*) | rmax (R*) |
|---|---|---|---|---|---|---|---|
| SiP | J = 8.5 → 7.5 b | ∼1 | ∼−26 | ∼30 | ∼2 × 10⁻⁹ | ∼300 | ∼550 |
| J = 13.5 → 12.5 | 1.0 ± 0.5 | −26.6 ± 3.5 | 37.4 ± 4.6 | ||||
| J = 16.5 → 15.5 | 1.2 ± 0.5 | −26.1 ± 3.5 | 39.1 ± 4.6 | ||||
| J = 17.5 → 16.5 | ∼ 1 | ∼−26 | ∼ 30 | ||||
| CP | N = 2 → 1 J = 2.5 → 1.5 b | 4.0 ± 0.6 | −26.0 ± 4.0 | 28.0 ± 4.0 | 7 × 10⁻⁹ | 650 | 900 |
| N = 3 → 2 J = 2.5 → 1.5 b | ∼ 4 | ∼−26 | ∼ 30 | ||||
| N = 5 → 4 J = 4.5 → 3.5 | 6.1 ± 1.8 | −26.7 ± 2.6 | 28.0 ± 2.6 | ||||
| PN | J = 2 → 1 b | 3.3 ± 0.6 | −26.1 ± 4.0 | 29.0 ± 4.0 | 9 × 10⁻¹⁰ | 550 | 700 |
| J = 3 → 2 b | ∼6 | ∼−26 | ∼30 | ||||
| J = 5 → 4 | 5.6 ± 1.2 | −26.5 ± 2.6 | 27.6 ± 2.6 |
Notes.
a Measured with the ARO SMT unless indicated otherwise. b Measured with the ARO 12 m. c Peak abundance in a shell model; see text.Download table as: ASCIITypeset image
The abundances for SiP were derived using the non-LTE radiative transfer code developed in the Ziurys group, ESCAPADE (Adande et al. 2013). The code, based on the Sobolev approximation, employs the escape probability formalism. Levels are populated by collisions and radiation from dust, and spectra are predicted as a function of r, the distance from the star. A density profile was assumed based on a mass-loss rate of ∼10−5 M⊙ yr−1 (Anderson & Ziurys 2014), and the temperature law TK (r) = 200 K (1015 cm/r)0 .73 was employed (Crosas & Menten 1997). Here 1015 cm is the distance from the star where the gas kinetic temperature is TK = 200 K. The dust was modeled as a blackbody at a temperature of 400 K (Crosas & Menten 1997). A stellar radius of R* ∼ 3.5 × 1013 cm and an average expansion velocity of Vexp = 14.5 km s−1 were assumed. The calculation was started at r ∼ 7.0 × 1014 cm ("rinner "), the edge of the dust formation zone (∼20 R*) where the envelope reaches its terminal velocity (Men'shchikov et al. 2001).
The line profiles for SiP were modeled with a shell distribution following the equation  (Adande et al. 2013; Anderson & Ziurys 2014), with variables peak abundance f0
, rshell
, and router
. The radius rshell
is the distance from the star where the abundance reaches a maximum, and the radius router
is when the abundance drops by a factor of 1/e from its peak value, defining the width of the shell with maximum radius rmax
= rshell
+ router
. The fitting parameters f0
, rshell
, and router
were varied over a grid of values. The ranges were 10−10 –10−8, 200–800 R*, and 20 R*–500 R*, for f0
, rshell
, and router
, respectively. The best fit was determined by a reduced chi-squared analysis, along with visual inspection. Initially, the unblended J = 13.5 → 12.5 and J = 16.5 → 15.5 lines, along with the shoulder feature of the J = 8.5 → 7.5 transition, were fit. Then the blended J = 17.5 → 16.5 transition was modeled with the same parameters, and the predicted line profile was consistent with the observed spectra. Neighboring lines were not fit in the analysis. A purely spherical distribution was also attempted (here rshell
= 0), but with poorer results, based on the above criteria.
(Adande et al. 2013; Anderson & Ziurys 2014), with variables peak abundance f0
, rshell
, and router
. The radius rshell
is the distance from the star where the abundance reaches a maximum, and the radius router
is when the abundance drops by a factor of 1/e from its peak value, defining the width of the shell with maximum radius rmax
= rshell
+ router
. The fitting parameters f0
, rshell
, and router
were varied over a grid of values. The ranges were 10−10 –10−8, 200–800 R*, and 20 R*–500 R*, for f0
, rshell
, and router
, respectively. The best fit was determined by a reduced chi-squared analysis, along with visual inspection. Initially, the unblended J = 13.5 → 12.5 and J = 16.5 → 15.5 lines, along with the shoulder feature of the J = 8.5 → 7.5 transition, were fit. Then the blended J = 17.5 → 16.5 transition was modeled with the same parameters, and the predicted line profile was consistent with the observed spectra. Neighboring lines were not fit in the analysis. A purely spherical distribution was also attempted (here rshell
= 0), but with poorer results, based on the above criteria.
The collision cross-sections were scaled from those of SiS (Schöier et al. 2005); infrared excitation was considered for the v = 1 level of SiP, which lies ∼615 cm−1 above the v = 0 state (Jakubek et al. 2002). The dipole moment derivative for SiP is not known and was estimated from that of SiS. Only a theoretical dipole exists for SiP: 0.9 D (Ornellas et al. 2000). Uncertainty in the modeling results is estimated at ∼30%. It should be noted that the A2Σ+ excited state of SiP lies ∼427 cm−1 in energy above the ground state, lower than the v = 1 level. However, Frank-Condon factors favor the v = 1 level.
For abundance comparisons, CP and PN spectra were also modeled, based on three, relatively contaminant-free transitions at 1, 2 and 3 mm, measured at ARO (see Table 3). PN is a well-characterized molecule, with a known transition rates and cross-sections (see EXOMOL, LAMBDA, BASECOL). These data do not exist for CP, except for a theoretically derived dipole moment (0.86 D; Rohlfing & Almöf 1988). These quantities were therefore scaled from those of CS (Schöier et al. 2005). The same model parameters were used as for SiP, and, again, a shell distribution gave a better fit. Modeled abundances are listed in Table 3. Uncertainties are estimated at ∼20%.
5. Discussion
5.1. Abundance and Distribution of SiP in IRC+10216
The modeling suggests that the abundance of SiP is f0 ∼ 2 × 10⁻⁹ at its peak value, relative to H2, located in a shell centered at ∼300 R*, extending out to ∼550 R* (1/e point). Moving the shell maximum further from the star resulted in less accurate fits. However, the SiP lines are very weak and the modeling only provides a very rough estimate, given the assumptions and the lack of collisional and radiative parameters for this molecule.
The PN and CP spectra, in comparison, had better signal-to-noise ratios as they are ∼3 times stronger. Two of the four lines analyzed for both molecules were uncontaminated, while the third feature was partially blended. The peak abundance determined for PN in IRC+10216 was f0 ∼ 9 × 10⁻¹⁰, and the molecule was found in a shell at ∼550 R*, extending out to ∼700 R*. The line profiles could not be reproduced with a spherical model, which had previously been used by Milam et al. (2008). These authors, however, derived a similar abundance of f0 ∼ 3 × 10⁻¹⁰, with an outer radius of ∼600 R*, based on the same line measured here but with less sensitivity. For CP, the modeling resulted in f0 ∼ 7 × 10⁻⁹ for a shell at ∼650 R*, extending out to ∼900 R*. Milam et al. determined an abundance of f0 ∼ 10−8 for this radical, in close agreement, determined from a single transition. In this case, a shell distribution was assumed, with the shell maximum at ∼460 R*, extending out to ∼770 R*.
Using the derived abundances, ESCAPADE was used to predict the intensities of the 3 mm transitions (J = 4.5 → 3.5, 5.5 → 4.5 and 6.5 → 5.5 at 71.7, 87.6 and 103.5 GHz, respectively) in IRC+10216 at the ARO 12 m telescope. Values obtained were TA* < 0.3 mK—consistent with the upper limits of 1–2 mK derived from 12 m observations of this source at 3 mm.
SiP is generated in a shell that is closer into the star than either CP or PN at r ∼ 300 R*, SiP formation may be linked to the liberation of both phosphorus and silicon from dust grains. Once formed, SiP is then channeled into other P-bearing molecules, such as PN and CP, which have shells near 550–650 R*.
5.2. Implications for Circumstellar Phosphorus Chemistry
Thermodynamic calculations predict that phosphorus should be condensed into the dust grains as the mineral schreibersite, (Fe,Ni)3P, in circumstellar material (e.g., Lodders & Fegley 1999; Lodders 2003). The condensation temperature of schreibersite is T ∼ 1200 K at 10−4 atm Lodders 2003). Schreibersite is commonly found in meteorites, including primitive carbonaceous chondrites (Pasek 2019). It is therefore possible that at least some phosphorus condenses into schreibersite in the circumstellar dust formation zone. However, some phosphorus may be liberated from the solid state by shocks in the inner envelope. The phosphorus may also remain in the gas phase and avoid condensation, which may not be an equilibrium process (Höfner & Olofsson 2018).
Unlike the other observed P-bearing species in IRC+10216, SiP also contains the refractory element silicon. There are a wide range of Si-containing molecules in IRC+10216, so gas-phase silicon is readily available, perhaps arising from the shock processing of SiC grains (e.g., Bernal et al. 2019). If such shocks also disrupt schreibersite, then SiP could form in the heated material. This scenario could explain its relatively confined spatial distribution.
Recently, Golubev et al. (2013) conducted a theoretical study of the interstellar formation of SiP. Based on a previous work by Andreazza et al. (2006), these authors examined the formation of the radical by radiative association of silicon and phosphorus atoms. They suggest that the reaction Si(3P) + P(4S) creates SiP in its excited state A2Σ+, which, for stabilization, decays to the nearby ground state, releasing a photon:

This reaction is feasible because both the X and A states share the same dissociation limit and are separated in energy by only 427 cm−1 (Jakubek et al. 2002). Golubev et al. (2013) calculated the rate of this reaction to be ∼10−20 cm3 s−1 for 10–1000 K.
There are no reactions for the formation or destruction of SiP listed in the KIDA and UMIST databases (Wakelam et al. 2012; McElroy et al. 2013). However, in analog to SiN, there are two possible alternative gas-phase synthesis processes:


Based on the nitrogen analogs, these reactions are likely to be exothermic. The first reaction can also lead to CP + Si, with an unknown branching ratio. Assuming an equal product distribution, this reaction has a projected rate of k2 ∼ 2 ×10⁻¹¹ cm3 s−1, based on SiN. The second pathway is estimated to have k3 ∼ 2 × 10⁻¹⁰ cm3 s−1, also extrapolated from SiN. Both processes may be sufficiently fast to be the major gas-phase pathways to SiP. Measurements and/or theoretical estimates of these reaction rates are certainly needed.
This research is supported by NSF Grant AST-1907910 and NASA grant 80NSSC18K0584 (Emerging Worlds).