


Abstract
James Webb Space Telescope (JWST) Mid-Infrared Instrument (MIRI) images of the luminous infrared (IR) galaxy VV 114 are presented. This redshift ∼0.020 merger has a western component (VV 114W) rich in optical star clusters and an eastern component (VV 114E) hosting a luminous mid-IR nucleus hidden at UV and optical wavelengths by dust lanes. With MIRI, the VV 114E nucleus resolves primarily into bright NE and SW cores separated by 630 pc. This nucleus comprises 45% of the 15 μm light of VV 114, with the NE and SW cores having IR luminosities, LIR(8 − 1000 μm) ∼ 8 ± 0.8 × 10¹⁰L⊙ and ∼ 5 ± 0.5 × 10¹⁰L⊙, respectively, and IR densities, ΣIR ≳ 2 ± 0.2 × 10¹³L⊙ kpc−2 and ≳ 7 ± 0.7 × 10¹²L⊙ kpc−2, respectively—in the range of ΣIR for the Orion star-forming core and the nuclei of Arp 220. The NE core, previously speculated to have an active galactic nucleus (AGN), has starburst-like mid-IR colors. In contrast, the VV 114E SW core has AGN-like colors. Approximately 40 star-forming knots with LIR ∼ 0.02–5 × 10¹⁰L⊙ are identified, 28% of which have no optical counterpart. Finally, diffuse emission accounts for 40%–60% of the mid-IR emission. Mostly notably, filamentary polycyclic aromatic hydrocarbon (PAH) emission stochastically excited by UV and optical photons accounts for half of the 7.7 μm light of VV 114. This study illustrates the ability of JWST to detect obscured compact activity and distributed PAH emission in the most extreme starburst galaxies in the local universe.
Export citation and abstract BibTeX RIS

Original content from this work may be used under the terms of the Creative Commons Attribution 4.0 licence. Any further distribution of this work must maintain attribution to the author(s) and the title of the work, journal citation and DOI.
1. Introduction
The LIR[8 − 1000μm] = 4.5 × 10¹¹
L⊙ luminous infrared galaxy (LIRG) VV 114 (=IC 1623 = Arp 236) is a prime target for Early Release Science observations with JWST. It is a striking example of how dust obscuration can hide the true nature of a luminous galaxy and cause a drastic transformation in appearance from the UV through the IR. VV 114 is a midstage merger in the Great Observatories All-sky LIRG Survey (GOALS; Armus et al. 2009) consisting of two nuclei separated by ∼20'' (8 kpc). The western component of VV 114 (VV 114W) is bright in UV and optical light (Knop et al. 1994; Goldader et al. 2002; Figures 1(a) and 2(a)) and hosts a large number of optically luminous young star clusters (Linden et al. 2021). The eastern component, VV 114E, is invisible at UV wavelengths and has prominent dust lanes that cover much of the diffuse light of the underlying stellar population at optical wavelengths. Beyond 1 μm, VV 114E increasingly becomes the dominant luminosity component of the merger (Knop et al. 1994; Doyon et al. 1995; Scoville et al. 2000; Soifer et al. 2001; Le Floc'h et al. 2002). Indeed, the total IR-to-UV luminosity ratio of VV 114 is 11.2 (Howell et al. 2010), indicating that VV 114E generates most of the energy in the merger. More specifically, the 7 μm-to-UV flux density ratio of VV 114E is ∼800, with the corresponding ratio of VV 114W being just ∼10 (Charmandaris & Le Floc'h 2004). This color contrast of the two components makes VV 114 the most extreme case ever observed among local LIRGs, and may have important implications on the interpretation of colors of high-z IR-luminous interacting systems (Charmandaris & Le Floc'h 2004). While the most sensitive mid-IR images of VV 114 to date have been obtained with space-based telescopes (Infrared Space Observatory, Spitzer; Figure 2(b), (c)) at 2''–6'' resolutions, high-resolution (0  34) Keck MIRLIN observations detected only the VV 114E nucleus at 12.5 μm due to limited sensitivity at these wavelengths from the ground, but were able to resolve it into a NE and SW core separated by ∼2'' (∼800 pc; Soifer et al. 2001). Radio images of VV 114 further resolved the SW core into four sources at the highest resolution (Condon et al. 1991; Soifer et al. 2001; Song et al. 2022). The NE and SW cores of VV 114E are detected in the rotational transition of CO, with a significant fraction of the cold molecular gas (traced by submillimeter/millimeter-wave rotational molecular transitions) and cold dust far-IR emission emanating from the overlap region between the two galaxies (e.g., Yun et al. 1994; Frayer et al. 1999; Saito et al. 2018). Finally, the power source of the heavily obscured nucleus in VV 114E has been difficult to diagnose, with the primary evidence of an active galactic nucleus (AGN) coming from mid-IR colors (Le Floc'h et al. 2002) and the hard X-ray spectrum (Grimes et al. 2006) of VV 114E (see also J. A. Rich et al. 2022, in preparation). However, the AGN contribution to the total energetics of VV 114 may be minor compared to star formation (Garofali et al. 2020; Ricci et al. 2021).

Figure 1. (a) False-color optical image of VV 114 constructed with HST WFC3/UVIS F330W (0.3 μm) and the ACS/WFC F435W (0.4 μm) and F814W (0.9 μm) data. Both (a) and (b) have the same spatial scale. The blue "+" symbols mark the location of the VV 114E NE and SW cores detected with MIRI. (b) False-color mid-IR image constructed with F560W, F770W, and F1500W MIRI data. Blue (5.6 μm) diffraction spikes emanate from the VV 114E NE and SW cores. The images are displayed in a logarithmic stretch to highlight both high and low surface brightness emission, and they show NUV/UV starlight ((a)—white knots) and dust lanes ((a)—red), the reddened nucleus and star-forming regions ((b)—pink), and the extended, filamentary 7.7 μm PAH emission ((b)—green), which covers much of the MIRI field of view.
Download figure:
Standard image High-resolution image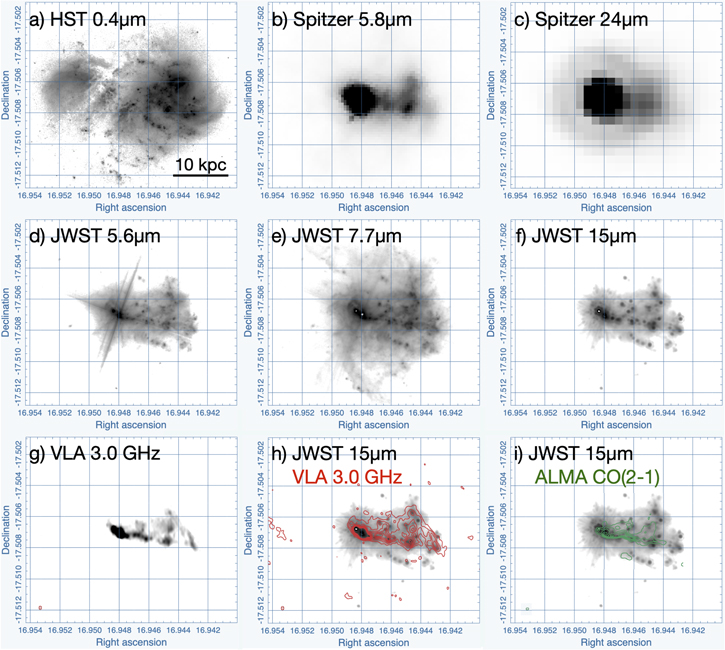
Figure 2. A comparison of the JWST MIRI 5.6, 7.7, and 15 μm images to the HST 0.4 μm, Spitzer IRAC 5.8 μm, MIPS 24 μm, VLA 3.0 GHz (θFWHM ∼ 07 resolution), and ALMA CO(2-1) emission (θFWHM ∼ 05: green contours in (i)). The axes are in degrees of R.A. and decl. The HST and JWST images are displayed in a logarithmic stretch to highlight both high and low surface brightness emission. The Spitzer and VLA images are displayed in a linear stretch. The eastern dust lanes visible in the 0.4 μm image cover the bright mid-infrared emission observed with Spitzer and JWST. Both VV 114E cores are also visible in the VLA images, as well as several of the higher surface brightness star-forming regions observed in the JWST images (i). The JWST images show an order-of-magnitude improvement in resolution and a factor of 50 improvement in sensitivity relative to Spitzer, allowing for the identification of ∼40 mid-IR star-forming regions and underlying diffuse emission at resolutions of ∼100–200 pc.
Download figure:
Standard image High-resolution imageIn this Letter, JWST Early Release Science imaging observations of VV 114 with the Mid-Infrared Instrument (MIRI) are presented. With a spatial resolution of 018–048) over the wavelength range 5.6–15 μm, JWST (6.5 m aperture) provides a factor of ∼8 higher resolution than Spitzer (0.85 m aperture) and nearly 2 orders of magnitude in sensitivity, enabling the highest resolution and most sensitive observations to date of the energy sources that collectively power the high IR luminosity of VV 114. A cosmology with H0 = 70 km s−1 Mpc−1, ΩΛ = 0.72, and Ωmatter = 0.28 is adopted. At the redshift of VV 114 (z=0.020), 1'' subtends 400 pc.
2. Observations and Reduction
Observations of VV 114 were obtained with the MIRI instrument (Bouchet et al. 2015; Rieke et al. 2015) on JWST on 2022 July 2 (Program ID 1328; co-PIs Armus and Evans). Observations were taken with the F560W (λ0 = 5.6 μm), F770W (λ0 = 7.7 μm), and F1500W (λ0 = 15 μm) filters using both the "BRIGHTSKY" Subarray mode (563 × 563 = 512 × 512 pixels) centered to image V114E and VV 114W and the SUB128 Subarray mode (SUB128: 141 × 141 = 128 × 136 pixels) centered at the peak of the mid-IR emission in VV 114E. The SUB128 Subarray mode observations use shorter exposures designed to avoid saturation from the brightest regions. A three-point dither pattern was used for each Subarray mode per filter, and the total exposure times in F560W, F770W, and F1500W with the BRIGHTSKY Subarray mode are 348, 114, and 114 s, respectively, and are 46, 48, and 48 s, respectively, for the SUB128 Subarray mode. The images presented here are Stage 3 products produced through the standard JWST Science Calibration Pipeline using the software version (CRDS_VER) 11.16.3. Finally, World Coordinate System (WCS) corrections to images were derived by spatially correlating sources identified in the MIRI and WCS-corrected JWST NIRCAM images (see S. T. Linden et al. 2022, in preparation).
3. Photometry
In order to derive photometry for sources in the MIRI images, the IDL routine FIND was run with a 25σ threshold and FHWM of 4.36 pixels (=048) on the F1500W MIRI image to identify unresolved sources. Photometry was then measured for the sources in each image in 5 pixel ( = 055) radius apertures and 7–9 pixel ( = 077–099) radius annuli for local background subtraction (where the background is measured via the mode of the pixels in each annulus) using the IDL routine APER. For the NE and SW cores of VV 114E, an 8 pixel ( = 088) radius aperture and a 9–11 ( = 099–11) pixel radius annuli for local background subtraction were adopted. Uncertainties were measured by varying the radius of the annuli over which the background estimates were measured. Aperture corrections were calculated using the encircled aperture-to-total energy for synthetic point-spread functions provided on the STScI website.
29
The resultant photometric estimates are provided in Table 1. For measurements of the total emission in VV 114, the IPAC package SKYVIEW v3.8 was utilized. Measurements were done with a circular  radius with background subtraction.
Table 1. MIRI Photometry of VV 114E Cores and Compact Star-forming Knots
| ID | R.A. (J2000.0) | Decl. (J2000.0) | F560W | F770W | F1500W |
|---|---|---|---|---|---|
| (deg) | (deg) | (mJy) | (mJy) | (mJy) | |
| (NE) 1 | 16.948352 | −17.506821 | 19 ± 7 | 90 ± 2 | 190 ± 6 |
| (SW) 2 | 16.947965 | −17.507073 | 73 ± 10 | 160 ± 8 | 190 ± 6 |
| 3 | 16.942842 | −17.507308 | 0.17 ± 0.001 | 0.85 ± 0.01 | 2.5 ± 0.3 |
| 4 | 16.942898 | −17.508056 | 0.24 ± 0.006 | 1.1 ± 0.05 | 4.5 ± 0.2 |
| 5 | 16.942909 | −17.507061 | 0.045 ± 0.005 | 0.22 ± 0.01 | 0.88 ± 0.16 |
| 6 | 16.9433 | −17.508064 | 0.066 ± 0.002 | <0.29 | 1.1 ± 0.2 |
| 7 | 16.9434 | −17.508269 | 0.14 ± 0.02 | 0.82 ± 0.04 | 1.8 ± 0.1 |
| 8 | 16.943513 | −17.507683 | <0.051 | <0.71 | 0.49 ± 0.02 |
| 9 | 16.943553 | −17.507894 | <0.044 | <0.25 | 1.1 ± 0.1 |
| 10 | 16.943728 | −17.508955 | 0.084 ± 0.03 | 0.48 ± 0.13 | 0.70 ± 0.13 |
| 11 | 16.944169 | −17.506264 | 0.34 ± 0.02 | 2.4 ± 0.05 | 6.2 ± 0.3 |
| 12 | 16.944281 | −17.507305 | 0.46 ± 0.007 | 1.8 ± 0.1 | 6.0 ± 0.3 |
| 13 | 16.944435 | −17.506723 | <0.051 | <0.16 | 0.43 ± 0.12 |
| 14 | 16.944479 | −17.506443 | 0.10 ± 0.05 | 0.61 ± 0.30 | 1.0 ± 0.3 |
| 15 | 16.944516 | −17.505324 | 0.12 ± 0.006 | 0.63 ± 0.04 | 0.93 ± 0.10 |
| 16 | 16.944565 | −17.505749 | 0.62 ± 0.13 | 3.6 ± 1.2 | 5.6 ± 0.6 |
| 17 | 16.944635 | −17.507619 | 1.0 ± 0.08 | 5.3 ± 0.4 | 14 ± 1.0 |
| 18 | 16.944663 | −17.507867 | 0.73 ± 0.04 | 3.1 ± 0.2 | 18 ± 0.2 |
| 19 | 16.944907 | −17.508971 | 0.18 ± 0.01 | 1.0 ± 0.03 | 2.3 ± 0.1 |
| 20 | 16.944914 | −17.507632 | 0.63 ± 0.14 | 3.6 ± 1.0 | 8.0 ± 0.3 |
| 21 | 16.944943 | −17.506742 | 0.22 ± 0.02 | 1.7 ± 0.1 | 2.5 ± 0.1 |
| 22 | 16.944956 | −17.506576 | 0.270 ± 0.03 | 1.7 ± 0.1 | 3.7 ± 0.3 |
| 23 | 16.945271 | −17.507489 | 0.12 ± 0.02 | 0.70 ± 0.22 | 2.6 ± 0.2 |
| 24 | 16.945378 | −17.508882 | 0.15 ± 0.01 | 0.80 ± 0.07 | 0.8 ± 0.1 |
| 25 | 16.945624 | −17.507612 | 0.20 ± 0.04 | <1.1 | 1.4 ± 0.1 |
| 26 | 16.945726 | −17.508725 | 0.14 ± 0.001 | 0.74 ± 0.007 | 0.93 ± 0.04 |
| 27 | 16.945768 | −17.507399 | 0.55 ± 0.02 | 2.8 ± 0.04 | 4.3 ± 0.1 |
| 28 | 16.946031 | −17.508540 | 0.037 ± 0.005 | 0.24 ± 0.05 | 0.80 ± 0.05 |
| 29 | 16.946061 | −17.506651 | 0.20 ± 0.05 | 1.4 ± 0.2 | 3.9 ± 0.1 |
| 30 | 16.946127 | −17.507456 | 0.77 ± 0.12 | 4.1 ± 0.4 | 9.2 ± 1.4 |
| 31 | 16.946162 | −17.508359 | 0.036 ± 0.01 | <0.44 | 1.2 ± 0.1 |
| 32 | 16.946188 | −17.506176 | 0.094 ± 0.001 | 0.62 ± 0.03 | 1.7 ± 0.1 |
| 33 | 16.946347 | −17.506839 | 0.53 ± 0.05 | 2.4 ± 0.3 | 5.0 ± 0.3 |
| 34 | 16.946579 | −17.504668 | 0.066 ± 0.006 | 0.38 ± 0.02 | 0.63 ± 0.04 |
| 35 | 16.946696 | −17.507147 | 0.48 ± 0.01 | 2.6 ± 0.5 | 2.0 ± 0.3 |
| 36 | 16.946775 | −17.506376 | 0.38 ± 0.02 | 2.5 ± 0.04 | 4.8 ± 0.02 |
| 37 | 16.947041 | −17.507356 | 1.09 ± 0.1 | 5.2 ± 0.8 | 13 ± 1 |
| 38 | 16.947402 | −17.507038 | ⋯ | 4.5 ± 0.1 | 6.1 ± 0.7 |
| 39 | 16.947425 | −17.507268 | 1.8 ± 0.4 | 9.4 ± 1.9 | 19 ± 2 |
| 40 | 16.948176 | −17.511765 | 0.047 ± 0.0004 | 0.25 ± 0.004 | 0.47 ± 0.02 |
Download table as: ASCIITypeset image
4. Results
4.1. VV 114E Nucleus and Star-forming Regions
Figure 1 is a comparison of false-color Hubble Space Telescope (HST) optical and JWST images of VV 114. Figure 2 is a comparison of the MIRI images to the HST 0.4 μm image (Kim et al. 2013), archival Spitzer IRAC CH3 (5.8 μm), Spitzer MIPS CH1 (24 μm), ALMA CO(2-1), and VLA 3.0 GHz images (Song et al. 2022). The region of VV 114E that is covered by dust lanes in the optical image (Figures 1(a) and 2(a)) contains the brightest mid-IR sources. In the MIRI images (Figures 1(b), 2(d)–(f), and 3(a)), the unresolved bright mid-IR nucleus in VV 114E, which is visible in the Spitzer images (2(b), (c)), is resolved into two primary cores (which are saturated in the BRIGHTSKY mode images) separated by 630 pc (= 16), consistent with the Keck 12.5 μm MIRLIN data (Soifer et al. 2001). The SW core is further resolved into a northern and southern component with a separation of 045 (=180 pc: Figure 3(a)), and the southern component has a tail of emission that extends to the SW. (For the photometric results, the southern component is treated as part of the SW core). In the VLA 33 GHz image, the SW core is resolved into four components, and thus the tail of emission in the 7.7 μm image corresponds to a separate component at 33 GHz (e.g., Figure 3(b)). The measured mid-IR flux density ratios of the NE to SW core at 5.6, 7.7, and 15 μm are ∼0.3, 0.6, and 1.0, respectively.

Figure 3. A close-up comparison of the VV 114E nucleus at 7.7 μm and 33 GHz (θFWHM ∼ 02: Song et al. 2022). In the JWST image, the nucleus is separated into an NE and SW core. The SW core is further resolved into two components, with the most southern component (SW-S knot) having a tail of emission extending in the SW direction. In the VLA image, the SW core is resolved into four components.
Download figure:
Standard image High-resolution imageThe extended mid-IR emission observed with IRAC and MIPS (Figures 2(b), (c)) west of the VV 114E nucleus is partially resolved by MIRI into ∼40 compact knots. These knots collectively comprise ∼20% of the light at 15 μm. A quarter of the knots have no optical HST 0.4 μm and/or 0.9 μm counterparts within the FWHM of the 15 μm image. All but one of the knots without an optical counterpart are in the overlap region.
The 15 μm emission from VV 114 is morphologically very similar to the 3.0 GHz emission, with many of the brightest radio star-forming regions having a mid-IR counterpart (Figure 2(h)). Finally, the CO(2-1) emission shown as contours in Figure 2(i), which comprises half of the total CO(2-1) emission from VV 114 measured in archival 7'' ALMA data, is cospatial with the VV 114E cores and extends westward into the overlap region. The highest surface brightness CO emission coincide with the optical-obscured knots in the overlap region.
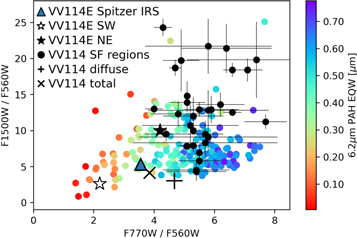
In order to better interpret the nature of the detected sources, their mid-IR colors were compared against those of the LIRGs in GOALS for which Spitzer IRS observations are available (Stierwalt et al. 2013). The IRS spectra were convolved with the MIRI filter transmission functions in order to derive the flux density in each filter. The results are illustrated in Figure 4. In the plot, the flux density ratio F770W/F560W is effectively a measure of the excess in the F770W filter due to PAH emission, and F1500W/F560W is a measure of the mid-IR spectral slope (note that the 6.2 μm PAH feature is redshifted out of F560W for VV 114). The plot clearly shows a gradient across the F770W/F560W axis as a function of 6.2 μm PAH equivalent width (EW), with higher values of F770W/F560W corresponding to high PAH EW. This EW is often used as an AGN diagnostic, with PAH EW <0.25 (red and orange in the plot) being AGN dominant systems (e.g., Armus et al. 2007).
Figure 4. A F770W/F560W vs. F1500W/F560W flux density ratio plot of the VV 114E cores (stars) and the mid-IR knots (filled black circles) in VV 114. The diffuse component of VV 114 is plotted as a "+" symbol. Also plotted are LIRGs in the GOALS sample with ratios derived from Spitzer IRS data. The LIRGs are color coded by their 6.2 μm PAH equivalent width, and the triangle is the IRS-derived ratio of VV 114. The MIRI-derived ratios for the total VV 114 emission (the "×") agree well with the IRS-derived ratio. The MIRI-detected knots and VV 114E NE have MIRI ratios consistent with LIRGs with strong PAH emission, and they are redder in F1500W/F560W relative to the majority of the IRS measured values of the GOALS LIRG sample, indicating that they are reddened star-forming regions. VV 114E SW ratios are consistent with an AGN.
Download figure:
Standard image High-resolution image
In Figure 4, the mid-IR colors of the mid-IR knots are shown. If the assumption is made that MIRI sources and GOALS LIRGs occupying the same area of the plot have nearly identical mid-IR spectra, the majority of the knots have (1) red dust continuum slopes (F1500W/F560W) and (2) strong PAH emission. The colors are thus consistent with highly reddened star-forming regions.
The VV 114E cores are also plotted in Figure 4. The NE core has star formation–like mid-IR colors, whereas the SW core has a bluer dust continuum and a low PAH equivalent width based on the relatively low F770W/F560W.
The mid-IR colors of the total VV 114 emission agree well with colors derived from Spitzer IRS. Further, the total MIRI and Spitzer IRAC measurements of VV 114 ( -radius aperture) in similar wavelength bands agree to within 9%–20%—i.e., F560W (0.21 Jy) versus IRAC 5.8 μm Channel 3 (0.26 Jy) and F770W (0.80 Jy) versus IRAC 8.0 μm Channel 4 (0.73 Jy). The flux densities for the three MIRI bands agree to within 6%–30% of similar ISOCAM filter values reported by Le Floc'h et al. (2002).
4.2. Diffuse PAH Emission
The JWST MIRI images also show that VV 114 contains significant diffuse emission. This emission is most notable at 7.7 μm (PAH + dust continuum emission: Figure 2(e)); filamentary structures extend well beyond the mid-IR star-forming regions (knots). The most prominent 7.7 μm filament extends ∼8 kpc to the south of the nucleus of VV 114E and is cospatial with CO(1-0) (Yun et al. 1994) and the 0.4 μm dust lane that obscures the bright mid-IR nucleus from optical view (Figure 1). In F560W, F770W, and F1500W bands, the diffuse component contributes ∼50%, 60%, and 36% to the total emission from VV 114. In terms of the mid-IR colors, the diffuse component is blue in F1500W/F560W and has F770W/F560W consistent with strong PAH emission.
5. Discussion
The JWST images in Figures 1 and 2 are clearly illustrative of how the vast improvement in both the spatial resolution and sensitivity over space- and ground-based telescopes has enabled the clearest mid-IR view to date of this dust-obscured galaxy merger. The VV 114E nucleus is resolved into two primary cores, with the SW core further resolved into two components. As summarized in Section 4.1, the mid-IR colors of VV 114E NE are consistent with a reddened star-forming region. It has been suggested based on the measured high HCN/HCO+ submillimeter line ratio of the NE core (Iono et al. 2013) that it is the location of the putative AGN hinted at by mid-IR (Le Floc'h et al. 2002) and X-ray (Grimes et al. 2006) observations. The AGN would have to be optically thick at mid-IR wavelengths to be consistent with the present data. In contrast, the SW core has colors consistent with a low PAH equivalent width source and thus may be a more likely AGN candidate. Spatially resolved JWST mid-IR spectra of VV 114E will be analyzed in a companion paper (J. A. Rich et al. 2022, in preparation).
The LIR of the nuclear cores can be estimated by adopting the IR 8–1000 μm (W m−2)-to-15 μm (W m−2 Hz−1) luminosity ratio of the GOALS sources that occupy the same area of Figure 4. This quantity was measured for each GOALS LIRG by interpolating their IRAS 12 and 25 μm flux densities to derive the 15 μm flux density and estimating the LIR from IRAS measurements (Sanders et al. 2003). The IR/15 μm ratios range from 1.2 to 2.1 × 10¹⁴ Hz, with a median value of 1.6 × 10¹⁴ Hz and a standard deviation of 0.18 × 10¹⁴ Hz. Applying these ratios yields an IR luminosity for the NE and SW cores of ∼ 8 ± 0.8 × 10¹⁰
L⊙ and ∼ 5 ± 0.5 × 10¹⁰
L⊙, respectively, which is a combined 30% of the LIR of VV 114. The IR and radio luminosities of these cores are roughly consistent with the IR-to-radio luminosity correlation of star-forming galaxies. As the sources are unresolved, the resolution of JWST at 5.6 μm (θFWHM ∼ 018 = 70 pc) can be used to derive a lower limit of the IR luminosity density of ΣIR ≳ 2 ± 0.2 × 10¹³
L⊙ kpc−2 and ≳ 6.7 ± 0.7 × 10¹²
L⊙ kpc−2, respectively (note that the SW core has two components). These numbers are in the range of that measured for the Orion core (∼2 × 10¹²
L⊙ kpc−2: Soifer et al. 2001) in the Galaxy and the nuclei of Arp 220 (∼1.5 × 10¹³
L⊙ kpc−2: Barcos-Muñoz et al. 2015).
Approximately 40 knots that are bright at mid-IR wavelengths are identified. These knots have mid-IR colors consistent with star-forming regions (Section 4.1) and are distributed in the overlap region and in VV 114W. At the resolution of the 15 μm image, 72% of these knots have optical counterparts. These may be the low optical depth components of the embedded, mid-IR starbursts, or low optical depth star-forming regions that formed in the vicinity of mid-IR-luminous regions. (See S. T. Linden et al. 2022, in preparation, for a discussion of the NIRCAM imaging observations of VV 114). Half of the knots with no optical counterparts are within the overlap region. These optically invisible knots are likely young star-forming regions which are still wholly or partially obscured by their birth clouds. The knots collectively have LIR ∼ 0.02–5 × 10¹⁰ L⊙ (=star formations rates of 0.02–6 M⊙ yr−1), with a median of 9.4 × 10⁸ L⊙ (=0.1 M⊙ yr−2) and an average uncertainty in the IR/15 μm conversion factor of 24%. By comparison, the median LIR derived from the IR–radio correlation for Very Large Array (VLA)-detected star-forming regions with effective radii ∼50–60 pc (i.e., approximately the resolution of the F560W data) are 6.0 ± 4.7 × 10⁷ L⊙ and 7.2 ± 4.4 × 10⁹ L⊙ for normal star-forming galaxies and GOALS LIRGs, respectively (Song et al. 2022).
The most striking feature in the MIRI images is the diffuse emission, especially the filamentary structure that covers most of the F770W image. This band contains the broad 7.7 μm PAH spectral feature, and it is clear from the image that PAH is being excited well beyond the regions in VV 114 occupied by bright mid-IR star-forming regions. The filamentary structure is reminiscent of Spitzer IRAC 8 μm images of nearby spiral galaxies in Elmegreen & Elmegreen (2019); the authors attribute the high 8.0 μm/5.8 μm to strong PAH emission in the 8.0 μm filter. If the diffuse component in the F560W has the same flux density as the dust continuum in the diffuse component in the F770W image, then ∼80% of the diffuse emission in F770W image is PAH emission.
These new JWST observations of VV 114 allow for the first time measurements of the properties of the most obscured IR-luminous star-forming regions and quantification of the contributions of diffuse emission to mid-IR light in the extreme environment of a luminous galaxy merger.
6. Summary
New JWST MIRI observations of VV 114 are presented. The following conclusions are reached:
- (1)The imbedded eastern nucleus of VV 114 is resolved into an NE and SW core. The mid-IR colors of these cores are consistent with a starburst (NE) and an AGN (SW). The lower limits of their estimated ΣIR lie between the Orion core and the nuclei of Arp 220.
- (2)Approximately 40 star-forming regions (knots) bright at mid-IR wavelengths are identified, 28% of which have no optical counterpart. Half of the knots with no optical counterpart lie in the overlap region. The knots have LIR ∼ 0.02–5 × 10¹⁰ L⊙, which translates into star formation rates of 0.02–6 M⊙ yr−1. These values are above the median LIR of comparably sized radio-identified star-forming regions in nearby, normal star-forming galaxies, but overlap the median LIR of radio-identified GOALS LIRGs.
- (3)Diffuse emission accounts for a significant fraction of the light in each MIRI image. In particular, filamentary emission is detected at 7.7 μm that accounts for 60% of the light at this wavelength. Approximately 80% of this extended component is estimated to be PAH emission heated by the star-forming regions and underlying stellar population.
The authors thank the anonymous referee for comments that improved the overall quality of the manuscript. The authors also thank the members of the international MIRI Instrument Team for their work to bring the MIRI instrument to fruition. The research was supported by NASA grants JWST-ERS-01328, HST-GO-15472, and HST-GO-16914. Y.S. was funded in part by the NSF through the Grote Reber Fellowship Program administered by Associated Universities, Inc./National Radio Astronomy Observatory. V.U acknowledges funding support from NASA Astrophysics Data Analysis Program (ADAP) grant 80NSSC20K0450. K.I. acknowledges support by the Spanish MCIN under grant PID2019-105510GB-C33/AEI/10.13039/501100011033. S.A. gratefully acknowledges support from an ERC Advanced grant 789410, from the Swedish Research Council and from the Knut and Alice Wallenberg (KAW) Foundation. H.I. and T.B. acknowledge support from JSPS KAKENHI Grant Number JP21H01129 and the Ito Foundation for Promotion of Science. The National Radio Astronomy Observatory is a facility of the National Science Foundation operated under cooperative agreement by Associated Universities, Inc. The authors acknowledge the usage of the NASA/IPAC Infrared Science Archive, which is funded by the National Aeronautics and Space Administration and operated by the California Institute of Technology, and CARTA (Comrie et al. 2021).
Facilities: JWST - James Webb Space Telescope, HST - , Spitzer - , VLA - , ALMA - , MAST - , IRSA - , NASA/ADS - , IPAC/NED. -
Software: IDL Astronomy Library (Landsman 1993), Astropy (Price-Whelan et al. 2018), CARTA (Comrie et al. 2021), Cosmology Calculator (Wright 2006), skyview (https://www.ipac.caltech.edu/skyview/), synphot (STScI Development Team 2018).