


Abstract
The James Webb Space Telescope (JWST) Early Release Observations (EROs) is a set of public outreach products created to mark the end of commissioning and the beginning of science operations for JWST. Colloquially known as the "Webb First Images and Spectra," these products were intended to demonstrate to the worldwide public that JWST is ready for science, and is capable of producing spectacular results. The package was released on 2022 July 12 and included images and spectra of the galaxy cluster SMACS J0723.3-7327 and distant lensed galaxies, the interacting galaxy group Stephan's Quintet, NGC 3324 in the Carina star-forming complex, the Southern Ring planetary nebula NGC 3132, and the transiting hot Jupiter WASP-96b. This paper describes the ERO technical design, observations, and scientific processing of data underlying the colorful outreach products.
Export citation and abstract BibTeX RIS

Original content from this work may be used under the terms of the Creative Commons Attribution 4.0 licence. Any further distribution of this work must maintain attribution to the author(s) and the title of the work, journal citation and DOI.
1. Purpose and Design
The JWST Early Release Observations (EROs) were designed to demonstrate that the observatory is ready for science, and is capable of producing spectacular results. This follows the precedents set by the Chandra and Spitzer space telescopes, which produced similar EROs after their launch and successful commissioning, and by the Hubble Space Telescope subsequent to each servicing mission. The observations were to be used to produce a colorful set of images and spectra for a public press release. However, given the great leap in sensitivity and resolution of JWST compared to the previous generations of infrared telescopes, the ERO data are also available to be analyzed for scientific purposes.
A significant subset of the EROs was used to create content for the "Webb First Images and Spectra" press release, with one image ("Webb's First Deep Field," SMACS J0723.3-7327) presented by President Joseph Biden on 2022 July 11, and the remainder released at a NASA press briefing the next day, on 2022 July 12. The press release was one of the largest public science events ever, resulting in ∼26,000 news articles and ∼120 billion impressions over the course of a few days. The metrics were extracted using the Meltwater media monitoring service for the period spanning 2022 July 12–16. The number of impressions is based on total visitors to the websites on which the articles appeared.
The science data underlying the First Images and Spectra were publicly released on the Mikulski Archive for Space Telescopes (MAST) on 2022 July 13. The observations highlight key science areas where JWST is most likely to make transformational contributions to astrophysics: Early galaxies, interacting galaxies, stellar birth and death, and other worlds (i.e., exoplanets).
This paper presents the JWST First Images and Spectra data and describes their observational design, processing, and visualization steps carried out to support the press event. We do not present any scientific analysis of the data set, and leave this to the astronomical community. All the public outreach products resulting from this set of observations can be found on webbtelescope.org.
2. ERO Target Selection and Production Support
The formal responsibility for selecting the JWST ERO targets rested with the JWST Program Officer at NASA Headquarters, based on advice from an ERO Selection Committee, including representatives selected by each agency. 9 The ERO committee identified potential targets from a wide set of sources, including the JWST Science Working Group in 2017 May. Consideration was given to seeking direct public input, but it was unclear how such input could be prioritized in an unbiased manner. Instead, the committee polled the members of the American Astronomical Society, soliciting target selections in late 2017. 10
Based on the input received, the ERO Committee identified a superset of targets that might be suitable for JWST's first public science observations. Those targets were evaluated based on existing data, particularly Hubble and Spitzer Space Telescope color images, and on their likely infrared characteristics, technical feasibility, as well as their relevance to JWST's four science themes. The final prioritized list was delivered in early 2020 and included some 70 targets distributed across the full sky, providing contingency to cover a wide range of potential launch dates.
Working from that list, the ERO Implementation Core Team 11 identified the highest priority targets whose availability was consistent with the 2021 December 25 launch. The final targets span JWST's science themes and include representative observations from all major modes of JWST's four science instruments. In the summer of 2021, members of STScI's JWST instrument branches were recruited to assist in producing and verifying the Astronomer Proposal Tool observing files, and to provide crucial support for data reduction. Finally, in early 2022, representatives from STScI's Office of Public Outreach joined the ERO Production Team to contribute expertise in graphics design, science writing, and news production.
The JWST First Images and Spectra were created by Space Telescope Science Institute (STScI) staff between June 3 and 2022 July 10, from the first observation to the final delivery to NASA. In total, more than 30 people were involved in the production team, supported by the full commissioning and operations system for the JWST observatory. The data sets described here will ultimately be made available in MAST as high-level science products (HLSPs), once all necessary calibration files are available.
3. Observations
The JWST ERO observations were planned and executed as part of the JWST commissioning program. Programs included in the final release were PID 2731, 2732, 2733, 2734, and 2736 (PI: Pontoppidan). The data are available at the Mikulski Archive for Space Telescopes at doi:10.17909/kjms-sq75.
In general, planned observations were modeled using the JWST Exposure Time Calculator (Pontoppidan et al. 2016), using archival imaging from Spitzer IRAC (3.6–8.0 μm; Fazio et al. 2004) and (24 μm; Rieke et al. 2004) MIPS. 5–28 μm spectra from the Spitzer Infrared Spectrometer (Houck et al. 2004), where available, were used to inform filter choices, supplemented by ground-based 1–2 μm spectroscopy from various sources in the literature.
3.1. SMACS J0723.3-7327
SMACS J0723.3-7327 is a massive galaxy cluster (z = 0.388) known to act as a strong gravitational lens, magnifying the background field of distant, high-redshift galaxies. This cluster was first discovered as part of the southern extension of the Massive Cluster Survey (MACS; Ebeling et al. 2001), and its properties were described by Repp & Ebeling (2018). It was first observed by Hubble in programs #11103, #12166, and #12884 (PI: Ebeling), then later as part of the Reionization Lensing Cluster Survey (RELICS) survey (Coe et al. 2019). It was selected for this ERO program for its bright central elliptical galaxy, prominently lensed arcs, and high ecliptic latitude at −80 2 yielding a low Zodiacal background.
The ERO multimode observations of SMACS J0723.3-7327 include NIRCam and MIRI imaging of the cluster and surrounding field (Figure 1), supporting NIRSpec Multi-Object Spectroscopy, and NIRISS Wide-Field Slitless Spectroscopy. The aim of the observations was to demonstrate the ability of JWST to rapidly image high-redshift galaxies, at a depth rivaling the most sensitive Hubble deep fields. The gravitationally lensed arcs both increase the richness of the background field, as well as offer a science narrative related to the use of gravitational lensing to magnify and enhance distant galaxies. The multiobject spectroscopy was intended to demonstrate emission-line signatures of star-forming galaxies, and illustrate to the public how redshifts (look-back time) can be measured to high precision by JWST. The NIRCam imaging was also used to create a catalog from which the NIRSpec MSA configuration could be constructed, following a workflow similar to that which future science programs would use.

Figure 1. Field of view in SMACS J0723.3-7327 covered by NIRCam and MIRI. 12
Download figure:
Standard image High-resolution image3.1.1. NIRCam Imaging
The NIRCam image centers module B on the cluster, and module A on an adjacent off-field. While the ERO product featured only the cluster module, the off-field module represents an additional, serendipitous deep field. We obtained NIRCam images through six broadband NIRCam filters, spanning F090W through F444W (see Table 1). The exposure time was designed to achieve a point-source sensitivity of AB ∼ 29.8 mag, as estimated using the JWST Exposure Time Calculator (5σ), aimed at matching the depth of the Hubble Ultra Deep Field as observed with WFC3/IR (HUDF12/XDF; Ellis et al. 2013; Illingworth et al. 2013; Koekemoer et al. 2013), and surpassing by at least a factor of 10 the depth of Spitzer IRAC channel 1+2 imaging for similar fields. In practice, due to improved NIRCam sensitivity in these filters by up to 30%, as uncovered during commissioning (Rigby et al. 2022), combined with the lower Zodiacal background of this field compared with the HUDF, the ultimate depth of the SMACS J0723.3-7327 field may be somewhat deeper, perhaps reaching or surpassing AB ∼ 30 mag over much of the field.
Table 1. Observation Parameters for SMACS J0723.3-7327/PID 2736
| Instrument | Mode | Filter/Disperser | Exposure Time | Observing Date |
|---|---|---|---|---|
| Seconds per Filter/Disperser | ||||
| NIRCam | Imaging | F090W/F150W/F200W/F277W/F356W/F444W | 2022 Jun 7 | |
| MIRI | Imaging | F770W/F1000W/F1500W | 2022 Jun 14 | |
| MIRI | Imaging | F1800W | 2022 Jun 14 | |
| NIRISS | WFSS | GR150R+F115W/GR150R+F200W | 2022 Jun 17 | |
| NIRISS | WFSS | GR150C+F115W/GR150C+F200W | 2022 Jun 17 | |
| NIRSpec | MSA | G235M/G395M | 17682 | 2022 Jun 30 |
Download table as: ASCIITypeset image
We used the INTRAMODULEX dither with nine dither positions to optimize image quality and efficiently remove cosmic rays and bad pixels, and the MEDIUM8 readout pattern to minimize detector read noise. Given the moderately low galactic latitude of the field at −237 it does contain a number of bright Milky Way stars.
3.1.2. MIRI Imaging
We used MIRI to image the cluster in four filters (Table 1). We prioritize depth over coverage, and use a single MIRI tile centered on the cluster, reaching 5σ depths of AB ∼ 26.3 mag at F770W, ∼25.1 mag at F1000W, ∼24 mag at F1500W, and ∼23 mag at F1800W. We use relatively long ramps with FASTR1 of 100 groups to minimize read noise, except for F1800W, which uses a 50 group ramp given the higher background in this wave band. All images use a 10 point medium cycling dither.
3.1.3. NIRISS Wide-field Slitless Spectroscopy
We obtained slitless grism spectroscopy with NIRISS of a single tile centered on the cluster, using two different filters to increase the chances of identifying some galaxies that show interesting emission features at high redshift. The F115W and F200W filters are able to detect emission-line galaxies via Hα at z = 1.0–2.4 and Hβ along with the [O iii] 4959+5007 Å doublet at z ∼ 1.1–3.6. We used both orthogonal gratings to minimize the effects of contamination in the crowded cluster field. Using an eight-point medium dither pattern, and a total exposure time of 2.8 ks, we reach SNR ∼ 10–30 per channel on the continuum for an AB ∼ 23 mag galaxy, but are also able to detect much fainter emission-line galaxies.
3.1.4. NIRSpec
The NIRSpec Multi-Shutter Array (MSA) was used in its medium-resolving configuration to investigate selected galaxies in greater detail, and with wider spectral coverage, reaching 5 μm. The medium resolution grating balances sensitivity, velocity resolution, and the number of spectra that can be fitted on the NIRSpec detectors. The G235M and G395M gratings include Hα at z = 1.7–6.9, and the easily identifiable trio of the Hβ line and [O iii] 4959+5007 Å doublet out to z ∼ 9. We use a three-shutter slitlet with a matching three-dither pattern, using the NRSIRS2 readout pattern to limit 1/f noise.
The NIRCam six-band images, obtained as part of this program, were to derive a catalog and photometric redshifts using the Eazy package (Brammer et al. 2008). We used an astrometric solution referenced to Gaia, and supplemented by the RELICS HST/ACS imaging in the area outside the NIRCam footprint (Coe et al. 2019). We select galaxies in the field out to z ∼ 10 with AB <26 mag. For the handful of z > 6 galaxy candidates we included objects with AB ∼ 27 mag, anticipating that strong emission lines will still easily be detectable. Empty shutters were included in the configuration for subtracting the background.
Among a total set of 41 primary and four secondary targets, we included the four highest redshift objects at z ∼ 6–10, the giant gravitationally lensed arcs, galaxies at z ∼ 1–6, and cluster galaxies at z ∼ 0.4.
3.2. Stephan's Quintet
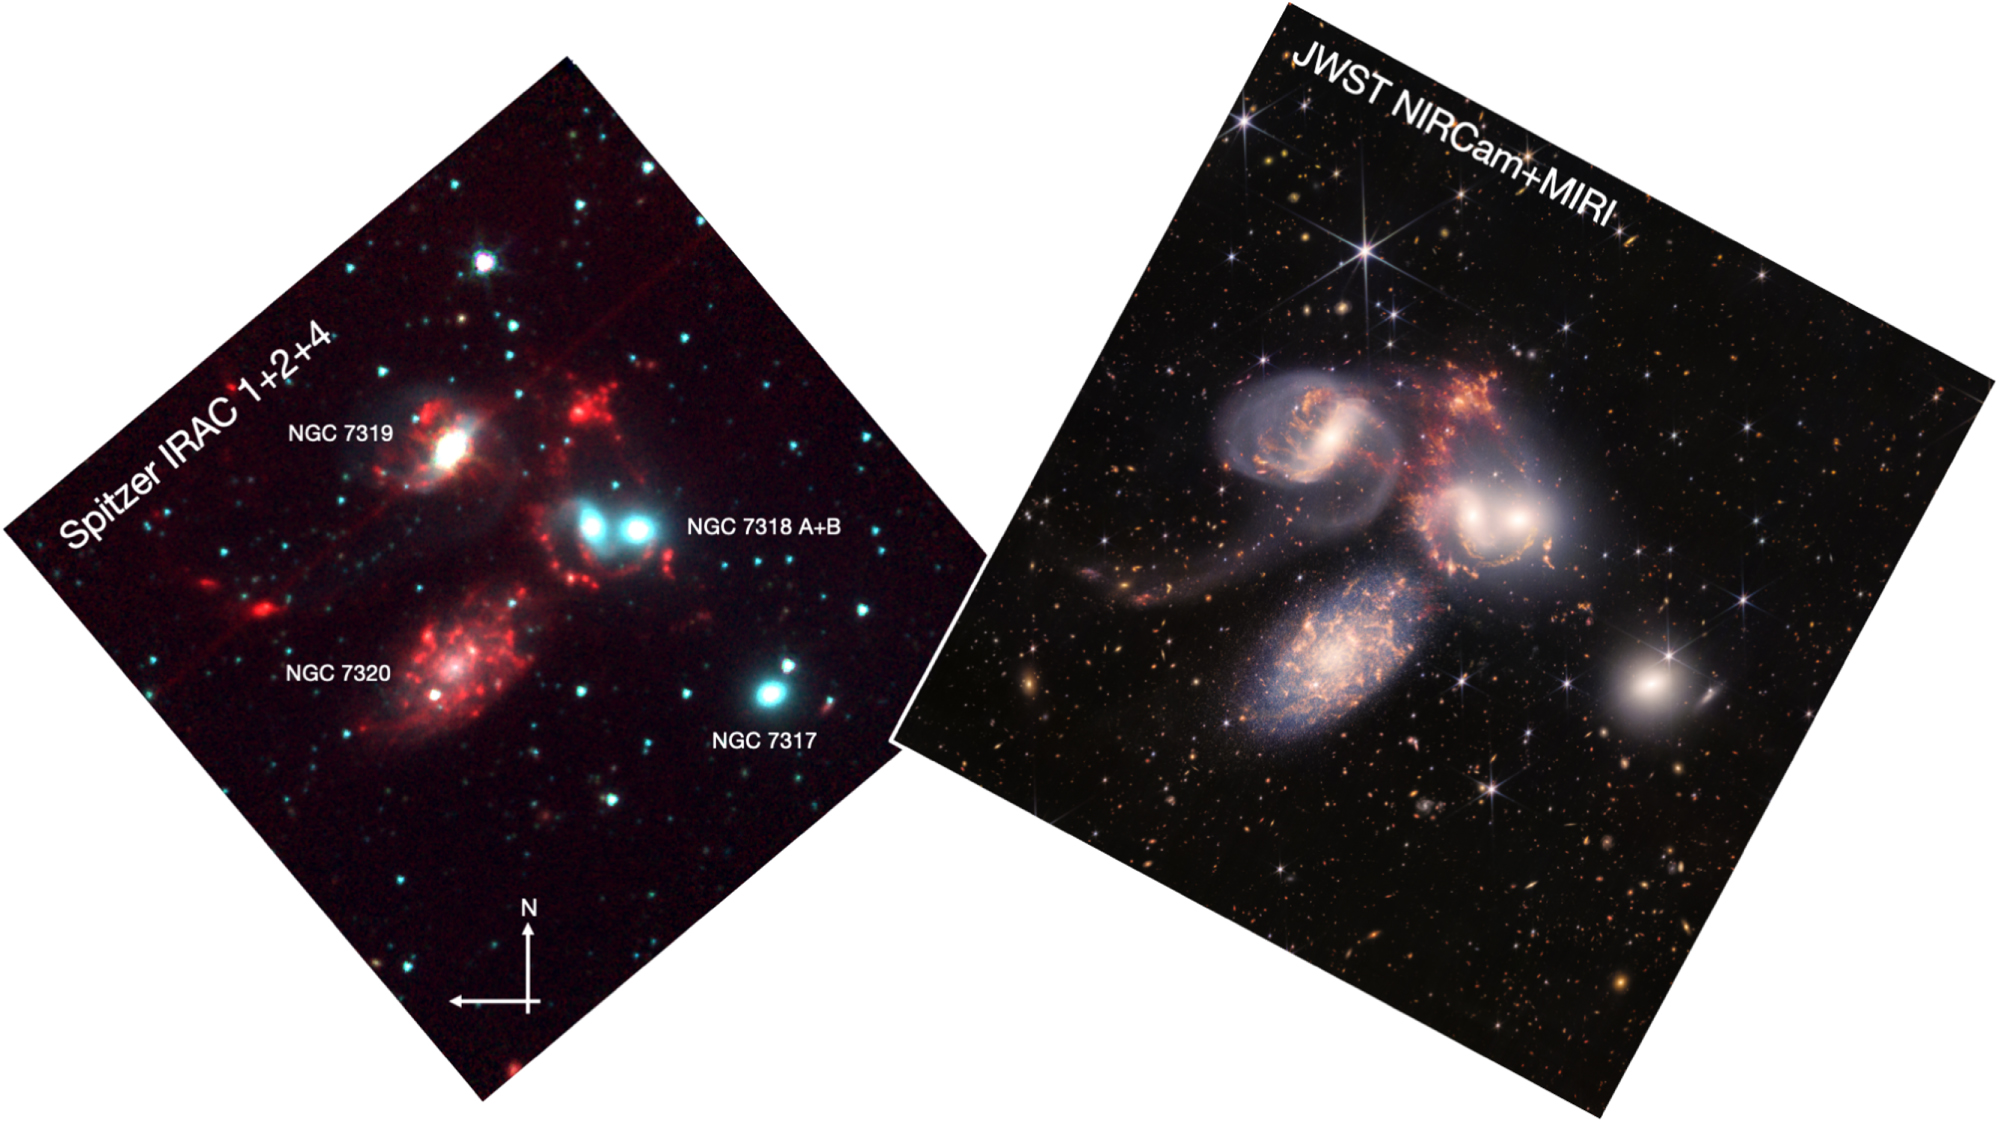
Stephan's Quintet is a well-known Hickson Compact Group (HCG), consisting of at least four individual large galaxies at an average distance of 88.6 Mpc (Duarte Puertas et al. 2019), which are likely actively merging. One of the merging galaxies, NGC 7319, harbors a bright Seyfert 2 active galactic nucleus (AGN) associated with a radio jet (Aoki et al. 1999). A fifth galaxy, NGC 7320, is not interacting with the group, as it is much closer (Burbidge & Burbidge 1961), and is an apparent chance alignment (Figure 2).

Figure 2. Field of view in Stephan's Quintet covered by NIRCam and MIRI. 13
Download figure:
Standard image High-resolution imageIn the mid-infrared, Stephan's Quintet is characterized by a large-scale shock at the interface between the NGC 7318 and NGC 7319 galaxies, with strong, extended emission from rotational H2 lines (Cluver et al. 2010), matching similarly strong X-ray emission (O'Sullivan et al. 2009). The objective of the ERO was to illustrate the energetic interactions in the compact group, and show the active growth of an AGN in NGC 7319, all within the context of a field of distant background galaxies.
3.2.1. NIRCam Imaging
The NIRCam image of Stephan's Quintet is the largest mosaic of the ERO release, consisting of three pairs of dithered tiles, arranged such that each pair has a 71.5% overlap in the direction along the two modules. In total, the final product includes 153.5 Mpixels. The double-tile strategy was designed to maximize the uniformity of the depth across the image to support the production of even-looking color images, and to maintain a minimum of five dithers on any given location to be able to produce images free of cosmic rays and bad pixels. Further, we used the FULLBOX dither pattern to image a rectangular field, while minimizing the need to crop irregular edges.
Since the redshift of the merger is large enough that narrowband filters will generally not contain their target lines, wide filters are used, spanning a wide range in wavelengths from 0.9 to 4.5 μm (see Table 2). The shortest band includes structure from dark dust lanes within each galaxy, while the longest band enhances the field of background galaxies, and includes emission from the 3.3 μm PAH feature and the strong rotational S(9) line from H2. The exposure parameters were chosen to maximize dynamic range (high sensitivity, but without saturating too many brighter sources), including the brightest areas around the NGC 7319 AGN core. The NIRCam images reach 5σ depths of AB ≳ 29 mag in the deepest areas of the field.
Table 2. Observation Parameters for Stephan's Quintet/PID 2732
| Instrument | Mode | Filter/Disperser | Exposure Time a | Observing Date |
|---|---|---|---|---|
| Seconds per Filter/Disperser | ||||
| NIRCam | Imaging | F090W/F150W/F200W/F277W/F356W/F444W | 2362 | 2022 Jun 11 |
| MIRI | Imaging | F770W/F1000W | 2022 Jun 12, Jul 1 | |
| MIRI | Imaging | F1500W | 2022 Jun 12, Jul 1 | |
| NIRSpec | IFU | Prism | 2022 Jun 15 | |
| MIRI | MRS | SHORT/MEDIUM/LONG | 899 | 2022 Jun 20 |
Note.
a Maximum depth in field.Download table as: ASCIITypeset image
3.2.2. MIRI Imaging
Since MIRI covers less than a quarter of the field of view of a single NIRCam tile, there was insufficient time to cover the full NIRCam area. Consequently, the MIRI image covers the central galaxies, NGC 7318, NGC 7319, and NGC 7320, using four tiles. The two tiles centered on NGC 7320 were observed significantly later than the tiles on NGC 7318 and NGC 7319, and consequently the relative aperture position angles differ by a few degrees. The MIRI image consists of three filters, F770W, F1000W, and F1500W, intended to trace PAH emission, as well as to reveal embedded star-forming clusters. The pointing including the NGC 7319 core was a critical inclusion, needed for context with NIRSpec IFU and MIRI MRS observations of the Seyfert 2 AGN. We used eight dither points of the large cycling pattern to maximize the spatial coverage of a single tile.
3.2.3. NIRSpec Integral Field Spectroscopy
We obtained a single NIRSpec IFU tile centered on the Seyfert 2 AGN in NGC 7319. We use the PRISM for maximal sensitivity and instantaneous spectral range (0.7–5.2 μm). It is noteworthy that the redshift of NGC 7319, albeit relatively small, allows the rest-frame optical Hα line to be included in the NIRSpec coverage. Sensitivity at shorter wavelengths was a particular consideration, given how red (and likely embedded) the AGN is. At the same time, the IFU exposure parameters avoid saturation at the longer wavelengths. eight dither points from the large cycling pattern maximize the spatial resolution. The single tile covers the central parts of the AGN outflow/jet structure.
3.2.4. MIRI Medium Resolution Spectroscopy
A single MIRI Medium Resolution Spectroscopy (MRS) tile was also observed, centered on the same region of the NGC 7319 core that was covered by the NIRSpec IFU. We observed all three sub-bands for full spectral coverage from 4.9 to 28 μm. The MIRI MRS observation was supported by a background observation, centered on a blank part of the sky off the galaxy group, to help remove the telescope background. Given the brightness of the AGN, the MIRI spectrum generally has a very high signal-to-noise (>100) across the covered spectral range.
3.3. NGC 3324 (Carina)
The ERO release prominently featured an image of the eastern edge of NGC 3324, an ionized bubble, formed by hot young stars in the northeastern part of the Carina star-forming complex. NGC 3324 is located at a distance of about 2.2 kpc (Göppl & Preibisch 2022). Named the "Cosmic Cliffs," the image captures a landscape view of the photodissociation region of the bubble and highlights the contrast between ionized and molecular gas (Figure 3).

Figure 3. Field of view in NGC 3324 covered by NIRCam and MIRI. The framing was selected using archival images from Spitzer, as shown. 13
Download figure:
Standard image High-resolution imageThe eastern edge was chosen as it was expected to show the sharpest ionization boundary, based on the Spitzer image, and offers the greatest brightness and color contrast. The eastern edge was also favorably aligned with the available aperture position angle of NIRCam at the time of observation. The pointing was slightly shifted east to feature more of the molecular nebulosity, which was expected to exhibit the most detailed structure in the infrared. The NGC 3324 field includes a prominent pillar in the south, and is known to exhibit significant star formation, as evidenced by the presence of multiple protostellar jets (Smith et al. 2010; Ohlendorf et al.2013).
3.3.1. NIRCam Imaging
A key objective of the Carina image was to demonstrate, not only how the infrared range can be used to reveal embedded young stars, but also how wavelengths beyond ∼2 μm trace bright molecular emission from particularly PAHs and H2, leading to spectacular, high-resolution vistas.
To this end, we observed four mosaic tiles with NIRCam, using a pairwise overlap of 71.5% in the horizontal direction in order to get as much uniformity in the depth as possible. This is the same strategy as that employed for Stephan's Quintet.
We used the FULLBOX five-point dither pattern (10 dither points with the overlapping tiles) to be able to construct a rectangular image. For use with color images of galactic star-forming regions, we designed the following six-filter set: F090W and F200W to image scattered light from dust and show extinction colors of the background stellar field, while optimizing spatial resolution and sensitivity at the shortest wavelengths. The F187N filter captures ionized gas via the bright Paα, F470N images H2 from embedded jets and outflows, F335M images emission from the 3.3 μm PAH band, and F444W provides a long-wave sensitive point to dust scattering from large grains. Exposure times are set to not saturate on extended nebular emission, although many point sources will inevitably saturate in the broad filters (see Table 3). In particular the F335M filter is critical in bringing out the highly textured structure from the surface of the molecular cloud; the PAH emission traces a combination of cloud density and the strength of the local ultraviolet field. Together, these aspects create a thin layer tracing a surface through the molecular cloud. Since the 3.3 μm feature is the shortest wavelength PAH feature, this filter provides the highest resolution view of the molecular boundary layer of the photodissociation region available to JWST.
Table 3. Observation Parameters for NGC 3324/PID 2731 (Carina)
| Instrument | Mode | Filter/Disperser | Exposure Time a | Observing Date |
|---|---|---|---|---|
| Seconds per Filter/Disperser | ||||
| NIRCam | Imaging | F090W/F200W/F335M/F444W/F356W | 1610 | 2022 Jun 3 |
| NIRCam | Imaging | F187N/F470N | 2899 | 2022 Jun 3 |
| MIRI | Imaging | F770W/F1130W | 1354 | 2022 Jun 11 |
| MIRI | Imaging | F1280W | 1399 | 2022 Jun 11 |
| MIRI | Imaging | F1800W | 1199 | 2022 Jun 11 |
Note.
a Maximum depth in field.Download table as: ASCIITypeset image
3.3.2. MIRI Imaging
As in the case of Stephan's Quintet, the field is too large to completely cover with MIRI imaging. However, the MIRI image mosaic does use five tiles to cover a significant fraction of the interface region of the Carina bubble, overlapping with the NIRCam field of view, and including several protostellar associations and associated outflows. An eight-point cycling large dither pattern was used to provide good depth coverage across the panorama. We used four filters relevant to star-forming regions: F770W and F1130W for PAH emission, F1280W to include emission from the 12.81 μm [Ne ii] line, and F1800W for a long-wavelength point tracing cooler dust and the presence of thick protoplanetary disks around the young stars in the field. Exposure times are set to not saturate the nebular emission, but some bright point sources inevitably saturate (see Table 3).
3.4. NGC 3132 (Southern Ring Nebula)
As a demonstration of JWST's ability to better understand the full lifecycle of stars, the young planetary nebula NGC 3132 (the "Southern Ring") was imaged by NIRCam and MIRI (see Table 4). Located at a distance of ∼760 pc (Chornay & Walton 2021), NGC 3132 contains a visual binary star, one being a bright main-sequence A star, the other a young white dwarf—the origin of the nebula and also the ionizing source (Ciardullo et al. 1999). In the near-infrared, the NGC 3132 nebula is characterized by hydrogen recombination lines, lines from highly ionized atomic species ([Ar iii], [S iv], [Ne ii], and [S iii]), and H2 rovibrational and rotational lines (Mata et al. 2016; Monreal-Ibero & Walsh 2020). The intrinsic morphology of the nebula is likely bipolar but viewed close to pole-on (Monteiro et al. 2000).
Table 4. Observation Parameters for NGC 3132/PID 2733 (Southern Ring Nebula)
| Instrument | Mode | Filter/Disperser | Exposure Time a | Observing Date |
|---|---|---|---|---|
| Seconds per Filter/Disperser | ||||
| NIRCam | Imaging | F187N/F212N/F405N/F470N | 2319 | 2022 Jun 3 |
| NIRCam | Imaging | F090W/F356W | 1460 | 2022 Jun 3 |
| MIRI | Imaging | F770W/F1130W/F1280/F1800W | 1354 | 2022 Jun 12 |
Note.
a Maximum depth in field.Download table as: ASCIITypeset image
3.4.1. NIRCam Imaging
We imaged the nebula with a combination of broadband and narrowband filters, targeting known spectral features: F090W for the background galactic field and scattered light on dust. F356W was used to detect any PAH emission and to add colors of background galaxies in combination with F090W. F187N and F405N trace the bright Paα and Brα hydrogen recombination lines, respectively. Finally, F212N and F470N image the strong rovibrational and rotational H2 emission lines in the nebula, tracing different excitation temperatures. The narrowband filter exposure times are set to reach high signal-to-noise while not saturating, to increase dynamic range, and to reveal turbulent, small-scale structures, particularly in the H2 emission from the outer parts of the nebula. The exposure time estimates were informed by the surface brightness as measured in archival Spitzer IRAC1+2 images (Figure 4). The nebula is fully contained within NIRCam module B, and we use the INTRAMODULEX dither pattern with eight pointings to get uniform coverage.

Figure 4. Field of view of NGC 3132 covered by NIRCam and MIRI. The framing was selected using archival images from Spitzer, as shown. 13
Download figure:
Standard image High-resolution image3.4.2. MIRI Imaging
We imaged with MIRI NGC 3132 using two tiles to cover roughly the same field of view as NIRCam Module B. The exposure times are set using archival Spitzer IRAC and MIPS images, along with Spitzer spectroscopy to model performance, as the mid-infrared nebula is entirely dominated by emission lines. We target the 11.3 micron PAH specifically, as it is seen in the Spitzer spectrum. We also target F1280W to measure the known bright [Ne ii] line, and the F1800W filter to image the 18.71 μm [S iii] line, as well as any cool dust emission. We use the eight-point cycling dither pattern, and two mosaic tiles to roughly cover the NIRCam module B field, albeit at a slightly different position angle.
3.5. WASP-96b
We obtained observations with the NIRISS Single-Object Slitless Spectroscopy (SOSS) mode of the star WASP-96 in order to monitor a transit event of the exoplanet WASP-96b (Hellier et al. 2014) on 2022 June 21. The objective of these observations was to obtain a transmission spectrum of the planet, targeting in particular the known water feature observed at 1.4 μm by HST (Yip et al. 2021; Nikolov et al. 2022). The observation, which started at 04:06 UT and ended at 10:30 UT, consisted of a 280 integration, 14 groups per integration, exposure. The number of groups in the integration was selected such that the maximum number of counts achieved on each integration was conservatively at about 50% of the saturation level of the NIRISS detector; these were optimized using PandExo (Batalha et al. 2017). To schedule the event, we used the period and time-of-transit center obtained by Patel & Espinoza (2022), as well as the ExoCTK tools to define the optimal position angles and phase constraints to capture it (Bourque et al. 2021).
4. Data Processing
4.1. NIRCam Imaging
All the NIRCam imaging observations were processed with the publicly available "jwst" pipeline, 13 using the most up-to-date development version available at the time of the ERO observations (version 1.5.2, corresponding to the Final Release Candidate for JWST Build 8.0 delivered to the operational pipeline, with calibration reference files specified by CRDS context 0850). A total of 1,890 NIRCam image files had to be calibrated for the four released ERO targets that were observed with NIRCam, each of which had been imaged in six filters using multiple exposures, with all 10 NIRCam detectors in most cases. The pipeline consists of three stages (JWST 2016), which were generally run with default parameters, starting from the raw uncalibrated files, through to fully calibrated exposures, and ending with full combined mosaics. A few of the pipeline steps were customized to improve the quality of the resulting products, as described here.
4.1.1. NIRCam 1/f Noise
One of the characteristics of the NIRCam detectors is the presence of low-level electronic noise that is highly correlated in time, across output amplifiers and reference pixels, referred to as "1/f noise" (Moseley et al. 2010). This is manifested as linear stripes, which change gradually in their amplitude across the detector. This electronic effect is at a relatively low level and did not significantly impact the NIRCam images of NGC 3324, NGC 3132, or the bright galaxies in Stephan's Quintet. However, it was noticeable in fainter regions of the images, and especially so for the deep imaging of SMACS J0723.3-7327. The version of the pipeline available at the time of the ERO observations did not include a correction for this, so a simple correction was applied to each exposure. Specifically, we measured the median value across each row, after masking bright sources, and then adjusted the values in each row accordingly. While some additional higher-order variations might still be present, this procedure provided a first-order correction to improve the low-level background quality and noise properties of the resulting mosaics.
4.1.2. NIRCam Residual Background Correction
Another aspect of the NIRCam detectors is the presence of an electronic bias level that is removed during calibration by applying a "superbias" reference file. While this process is generally sufficient to remove this electronic bias, small residual offsets in the background level may remain after calibration, and these may be different for each detector. The JWST pipeline includes a "skymatch" step to match and remove any such residual background, and there were no visible residuals remaining for the ERO observations of NGC 3324, NGC 3132, or Stephan's Quintet. However, for the deep image of SMACS J0723.3-7327, some low-level residual background differences remained, visible as sky-level offsets between different detectors. Consequently, an additional iteration of background subtraction was carried out by masking bright sources and extending those masks to also exclude fainter emission before remeasuring the background levels. This successfully corrected the remaining residual background differences in these images.
4.1.3. NIRCam Astrometric Alignment
The NIRCam instrument is composed of two independent modules (A and B), each of which has five separate detectors, four of which are in the Short Wavelength Channel in a 2 × 2 grid, with the remaining detector being in the Long Wavelength Channel. For all 10 of these detectors, measurements of their relative positions were available from ground-test data. While preliminary on-orbit measurements had been obtained to refine the detector astrometry, not all of these were available at the time of the ERO observations. Initial calibrations revealed inaccuracies up to ∼0 2 in the relative locations of some of the detectors, as well as about +/−05 in their relative orientations, compared to ground-test data. Therefore, for all the NIRCam images, these offsets had to be corrected by invoking a part of the pipeline that solves for offsets ("tweakreg") in a custom setting, essentially registering each of the 10 detectors independently to an external catalog of the field, solving for their shifts and rotations separately for each filter. For the NIRCam imaging of NGC 3324, NGC 3132, and Stephan's Quintet, the external catalog consisted of Gaia-DR3.
14
For the images of SMACS J0723.3-7327, too few Gaia stars were available to provide a robust direct alignment, so the observations had to be aligned to RELICS HST observations of the field, which also needed to be aligned to Gaia-DR3. This successfully corrected all the astrometric errors, achieving a relative precision of ∼5 mas and absolute astrometric accuracy of ∼10 mas, and enabled all the images to be precisely aligned and combined into final mosaics.
2 in the relative locations of some of the detectors, as well as about +/−05 in their relative orientations, compared to ground-test data. Therefore, for all the NIRCam images, these offsets had to be corrected by invoking a part of the pipeline that solves for offsets ("tweakreg") in a custom setting, essentially registering each of the 10 detectors independently to an external catalog of the field, solving for their shifts and rotations separately for each filter. For the NIRCam imaging of NGC 3324, NGC 3132, and Stephan's Quintet, the external catalog consisted of Gaia-DR3.
14
For the images of SMACS J0723.3-7327, too few Gaia stars were available to provide a robust direct alignment, so the observations had to be aligned to RELICS HST observations of the field, which also needed to be aligned to Gaia-DR3. This successfully corrected all the astrometric errors, achieving a relative precision of ∼5 mas and absolute astrometric accuracy of ∼10 mas, and enabled all the images to be precisely aligned and combined into final mosaics.
4.2. MIRI Imaging
The MIRI imaging observations were processed with the "jwst" pipeline using the development version (approximately 1.6.0) and with the most up-to-date flight reference files (equivalent to CRDS context 0927). One exception was for the F1800W images, which used a custom flat field created using PID 1052 data, resulting in cleaner mosaics. A small number of extra processing steps were generally applied to improve the quality of the final mosaics, including an additional tweak to improve the astrometry (see Section 4.2.1). Additionally, for Stephan's Quintet and SMACS J0723.3-7327, additional steps were applied to subtract the average instrumental background and to correct column/row pull up/down around very bright sources.
4.2.1. Refining Astrometry
The relative astrometry between dithered images taken using the same guide star is generally accurate to a few mas (Rigby et al. 2022)—more than sufficient for MIRI imaging with a pitch of 110 mas. However, the relative astrometry between mosaic tiles observed using different guide stars can have much larger offsets, driven by the precision of the guide star catalog. Generally, offsets between different guide stars of a few 01 are common, with occasional differences as high as 1''–2''. While this is enough to cause noticeable registration problems with MIRI imaging mosaics, offsets are usually straightforward to measure and correct using the "tweakreg" step in the calwebb_image3 pipeline step, provided that there are a sufficient number of point sources within each tile. This is not always the case for MIRI imaging, especially at longer MIRI wavelengths where stars become very faint.
We refined the MIRI imaging astrometry and registration by deriving offsets between dithers and tiles using "tweakreg" on the shortest wavelength band (e.g., F770W), and then applying the same offsets to every other longer-wavelength band. Further, the offsets in (V2,V3) reported by "tweakreg" for each F770W exposure were averaged over all the dithers within a mosaic tile for enhanced precision and robustness against a lack of point sources in each individual dither. This approach takes advantage of the excellent pointing stability and accuracy of the JWST platform. Finally, the "tweakreg" step registers the absolute astrometry to the Gaia frame of reference.
4.2.2. Instrumental Background Subtraction
For observations of faint, low-background targets, the residual instrumental structure becomes significant. This was corrected by subtracting an average background image constructed by sigma clipping the stack of all exposures in detector coordinates to remove sidereal sources. While this step significantly reduced the residual instrumental background structure, it did imprint weak, large spatial scale structures due to imperfectly removed astrophysical extended emission.
4.2.3. Column/Row Pull Up/Down Correction
For sources that are very bright compared to the background emission, detector artifacts causing bars to appear along detector columns and rows appear. We used a simple correction by constructing column or row median profiles, and subtracting them from the appropriate detector regions in each exposure. The sources and regions suffering from these effects were identified visually in the mosaics. The column/row profiles were constructed and applied independently above/below and left/right of bright sources.
4.3. NIRSpec Integral Field Spectroscopy
The JWST NIRSpec integral field unit (IFU) provides spatially resolved imaging spectroscopy over a 3'' × 3'' square region, and enables spectral imaging over small fields of view. The NIRSpec IFU observations of the AGN in NGC 7319 were processed with the publicly available "jwst" pipeline using the most up-to-date version available at the time of the ERO observations (version 1.5.2).
The observations consist of eight dither points from the large cycling pattern, which maximizes the spatial resolution. The PRISM/CLEAR combination was used, which produces spectra at a nominal resolving power of R ∼ 100 in the wavelength range 0.6–5.3 microns.
For the ERO release, we used preflight reference files, since in-flight files were not yet available. We started from the output of the first stage of the "jwst" pipeline (calwebb_detector1), which applies basic detector-level corrections. We ran the rate files through the second stage (calwebb_spec2), and the calibrated files through the third stage (calwebb_spec3). In particular, in the cube_build step of stage 3, we set the weighting mode to "drizzle," which is a 3D generalization of the classical 2D drizzle technique.
We removed several bad pixels with negative flux values in the final data cube, which we were able to remove by setting the DQ file extension to "do not use." Further, the final combined cube had several bad pixels with positive flux values, as well as an edge effect. These two issues were corrected by turning on the outlier_detection step and setting the scaling factor to "scale." A future science-ready data set will require in-flight reference files for spectrophotometric calibration.
4.4. MIRI Medium Resolution Spectroscopy
MIRI MRS observations were processed through version 1.6.2 of the jwst pipeline using standard MRS pipeline notebooks similar to those available online 15 augmented by custom processing scripts. This version of the "jwst" pipeline implements multiple bug fixes compared to previous versions, including a fix to the construction of the spectral background model and the residual fringe correction. These notebooks followed the standard pipeline workflow, processing both science and dedicated background observations through the Detector1 and Spec2 pipelines individually before combining the data in the Spec3 pipeline.
First, we made a few additional corrections to the default pipeline workflows in order to improve the quality of the final data products. First, we used manually measured locations of Gaia-DR3 catalog stars in the MIRI simultaneous imaging field to refine the spacecraft pointing information for the associated MRS exposures (which can be uncertain due to a combination of guide star catalog errors and roll uncertainty). This resulted in a correction of about 025 to the astrometric solution of the MRS data.
Second, since contemporaneous background and science exposures share many of the same detector artifacts, we used the 2D rate files from the dedicated background field to improve the data products from the pipeline Detector1 stage before passing these products into the Spec2 pipeline. This step included ad hoc column median corrections for vertical striping (due to residuals in the MIRI DARK and RESET steps), a median combination of the rate images from individual integrations, instead of the usual pipeline mean combination (to mitigate the effects of large cosmic ray showers), and refinement to the bad pixel flagging by identifying hot pixels in the empty background field.
After passing the rate images through the Spec2 pipeline, we ran the 2D residual fringe correction step 16 on the resulting outputs. This step can dramatically decrease the amount of fringing seen in compact point sources coming out of the default pipeline, especially at wavelengths around 11 μm. Although the necessary code for this correction is part of the JWST pipeline, it is not yet fully integrated into the pipeline workflow and thus must be run by hand. The resulting images were reprocessed to create per-exposure data cubes and 1D spectra.
Finally, the residual fringe corrected files were passed into the standard Spec3 pipeline, which combined all of the 1D spectra of the background region to create a model spectrum to subtract from the science data. The final data cubes were constructed using a 3D variant (D. Law et al. 2022, in preparation) of the drizzle algorithm. We opted to configure the final cube building step to produce a single 5–28 micron data cube to ease visual inspection of the results, although we note that such a cube will contain artifacts at long wavelengths due to the sampling characteristics of the cube being optimized for the shortest wavelength data. Example 1D spectra (e.g., Figure 5) were extracted from this data cube using simplified circular apertures; while such apertures do not account for wavelength-dependent flux losses due to the growing point-spread function, such correction factors are ill defined for the spatially extended sources with complex morphology in the NGC 7319 field.

Figure 5. MIRI MRS spectrum of the central 0.65'' radius region surrounding the central Seyfert nucleus of NGC 7319. A selection of key atomic and molecular emission features have been labeled.
Download figure:
Standard image High-resolution image4.5. NIRSpec Multiobject Spectroscopy
The NIRSpec MOS observations were processed through version 1.5.2 of the JWST Pipeline. While some in-flight reference files were used, many critical calibrations were not yet available. 17 As a result, the data were not spectrophotometrically calibrated for use in the press release of the EROs.
The data were reprocessed through the Spec2 pipeline using a preliminary in-flight S-flat (Ferruit 2022, private communication). Since our emphasis was on the compact sources, we were able to use in-slitlet nodding to subtract the background. In detail, for each nod in the three-shutter slitlet, the JWST pipeline averages the two "off" nods and subtracts this 2D spectrum from that of the "on" nod. Finally, the Spec3 pipeline was run, combining the six exposures (three nods × two observations) for each of the two gratings.
After examining the pipeline outputs, we concluded that the default 1D extractions were insufficient, with apertures clearly including the "negative flux" from the nod-subtracted spectra. Therefore, we applied a by-hand aperture extraction to the s2d spectra for the selected objects that were under consideration for the ERO release. Finally, additional masking was carried out, thereby removing artifacts that were not flagged by the pipeline.
Future reprocessing will be required for these data to be science ready. Specifically, in-flight reference files will be needed to obtain a proper calibration, and further investigation of the pipeline's 1D extraction and data quality flagging will also be necessary. Finally, the construction and application of a master background spectrum from the background shutters remain to be tested. Nonetheless, the apparent quality of these spectra is outstanding. Figure 6 shows the emission from Hβ and the [O iii] λλ4960, 5008 doublet, redshifted to z = 8.49. The signal-to-noise ratio in these lines ranges from 13 to 44, suggesting exciting potential for these and other NIRSpec MOS observations of galaxies in the early universe.

Figure 6. The NIRSpec MOS spectrum of a galaxy at z = 8.49 shows robust detections of Hβ and the [O iii] λλ4960, 5008 doublet. The SNR on the lines ranges from 13 to 44.
Download figure:
Standard image High-resolution image
4.6. NIRISS Wide-field Slitless Spectroscopy
The NIRISS WFSS images were processed using version 1.5.2 of the JWST pipeline. The direct images for the WFSS observations were processed through the standard imaging pipeline workflow, including the Detector1, Image2, and Image3 pipeline steps. The tweakreg step of the default Image3 configuration was modified to precisely register individual dithers. The outputs from the imaging pipeline for each filter include a fully calibrated image that combines all the dithers, a source catalog, and a segmentation image from the source identification. The dispersed grism images were processed through the Detector1 step of the pipeline and through some of the initial steps of Spec2 pipeline, which include WCS assign, background subtraction, and flat-fielding. The dispersed images were then shifted and stacked using custom scripts to improve the signal-to-noise before spectral extraction. The spectral extractions were done using the preflight calibration files to locate the spectral traces for the sources of interest (including lensed arcs in the SMACS J0723 field) and custom codes were used to refine the trace positions and extract the spectrum. The wavelength calibration and spectrophotometry were also done using preflight calibrations. The NIRISS WFSS data will have to be reprocessed using the new reference files from commissioning to provide accurate wavelength and flux calibrations for future analyses.
These first data from NIRISS WFSS already reveal a large number of emission-line sources, and the combination of Hβ and [Oiii] 4959+5007 Å doublet are easily identified at different redshifts across the detector field of view, clearly demonstrating the power of this mode for emission-line galaxy surveys. In many cases the emission lines are spatially resolved in the grism images, which highlights the potential of using dispersed spectra to probe variation of nebular properties within distant galaxies.
4.7. NIRISS Single-object Slitless Spectroscopy
4.7.1. Detector-level Analysis
The NIRISS/SOSS images were processed using version 1.5.2 of the JWST pipeline. We worked with the Stage 1 products to produce the transmission spectrum, i.e., with the rates per integration. From there, the 2D spectra were analyzed and extracted using custom routines specialized to deal with NIRISS/SOSS data. 18
First, we traced the Order 1 and Order 2 spectra using a custom routine that performs a cross-correlation of each column in the image with a sum of two Gaussians separated by 15 pixels. Once the position of the center of those traces was obtained, we fitted those with splines in order to smooth their shapes. Next, we performed 1/f noise corrections by subtracting the median of all integrations from each individual integration. This left us with a frame for each integration containing detector-level effects. With these frames, we obtained the level of 1/f noise by computing the median number of counts within 20 to 35 pixels from the trace. These counts were then subtracted to each pixel within a 15 pixel radius from each trace of the original integrations.
The final step of our detector-level data reduction removed the zodiacal background from each integration. Under the assumption that the zodiacal background stays constant throughout the exposure (an assumption we tested with our data), we scaled the background model provided in the JWST Documentation (JWST 2016) using the median of all the integrations in the exposure. In particular, we used columns 500 through 800 and rows 210 through 250 of both the data and the model, taking the ratio of both to find the scaling factor. We used the second quartile of this ratio to estimate the scaling factor between the data and the model, which gave a ratio of about 0.47. This value was then used to remove the zodiacal background signal from each individual integration. The spectra were extracted using simple box extraction with an aperture radius of 15 pixels.
4.7.2. Lightcurve Fitting
The 280 spectra implied 280 fluxes measured in each wavelength bin (2044 for Order 1 and 551 for Order 2), which formed our set of 2591 transit lightcurves to analyze. Each lightcurve was divided by the out-of-transit median flux and then fitted using juliet (Espinoza et al. 2019). These were fitted using a batman model (Kreidberg 2015) with the best-fit orbital parameters obtained from an analysis made on the white-light lightcurves fixed in the wavelength-dependent analysis. The limb-darkening coefficients were fitted at each wavelength using the sampling scheme of Kipping (2013) and a square-root law, but using limb-darkening coefficients obtained through the limb-darkening software combined with the SPAM algorithm as priors (Espinoza & Jordán 2015). The priors were set on the transformed coefficients (q1, q2), with truncated normal distributions centered on these theoretical predictions, having standard deviations of 0.1 and constrained to be between 0 and 1. In addition to the transit model, a Gaussian Process was used to model any trends and/or instrumental systematics. In particular, a Matèrn 3/2 kernel in time was used, which defined two extra parameters for the fit: the amplitude of the Gaussian Process and the timescale of the process. Additional free parameters were a mean out-of-transit flux, a photometric "jitter" term added in quadrature to the error bars for each wavelength, and the planet-to-star radius ratio. We used the dynamic nested sampling algorithm implemented in the dynesty package as described in Speagle (2020) to sample from the posterior distribution of the parameters. While the posterior distribution for all parameters was obtained for our analysis, the only observable presented in the ERO package was the square of the planet-to-star radius ratio—i.e., the transit depth as a function of wavelength. While the transit depths were calculated at the resolution level of the instrument, we presented a spectrum binned to R = 100.
5. Image Visualization
The process of producing color images from the JWST data is similar to that of other observatories, such as the Hubble Space Telescope. A key objective was to develop a striking translation of infrared colors to the visible color space, using physical and chemical tracers not available in the Hubble range. While previous infrared telescopes, such as Spitzer, made great strides in this direction, JWST offers many more filters, resulting in a much greater number of potential color combinations. The final color images represent one option out of many possible, for a wide range of different types of objects, from the deep universe, where more distant or dusty galaxies naturally appear red using a range of broadband filters, to a planetary nebula entirely dominated by nonthermal line emission from molecular, atomic, and ionized gas. We found that, for JWST, excellent sources of color contrast and visual impact include (1) the broad emission bands of PAHs, with the 3.3 μm PAH feature offering the highest spatial resolution and structure, while the 7.7 and 11.3 μm bands providing stunning views of the interstellar medium in nearby galaxies, (2) emission lines from rotational and rovibrational transitions from H2, with the S(9) line at 4.7 μm providing a good balance between spatial resolution and brightness for shocks and outflows, and (3) ionized gas traced by the 1.87 μm Paα hydrogen recombination line and the 18.7 μm [S iii] line as contained within the F1800W MIRI filter.
5.1. Scaling
The dynamic range of the image data was first compressed using FITS Liberator 19 and PixInsight. 20 Typically, an ArcSinH stretch coupled with a high-scaled peak value works best to reveal the most low-level signal while preserving the brightest features. The stretch must be applied carefully, however, so as not to exacerbate background noise.
5.2. Noise Suppression and Artifact Removal
Once scaled, each filter must be treated individually for artifacts and noise intrinsic to the detector. The most common noise features and artifacts found in the JWST data include saturated star cores, banding from residual 1/f noise, gradients/background variations, and "persistence"—typically where a bright star leaves a remnant image in succeeding exposures.
To recover the saturated cores of the stars, an algorithm, PixelClip.js, adapted by J. DePasquale from G. Barrere (2019, private communication), is applied, which replaces the values below a certain threshold with the mean of its nearest neighbor. The original algorithm replaced saturated values above a certain threshold, but this was modified to deal with JWST data where the saturated regions are filled with null values.
Any residual horizontal and vertical banding from 1/f noise is removed by applying a photoshop action found within the "Astronomy Tools" package, which reduces noise by scanning across the image a couple of pixels at a time while attempting to match the sky background. This action can only work if the banding is parallel to detector rows and columns, so the image must be aligned accordingly before running this step. The procedure is also not as effective on larger mosaics such as Stephan's Quintet and Carina, but whatever banding remained was addressed by creating an artificial background which was used to subtract out the 1/f noise, while preserving the signal. This method was also applicable to dealing with background gradients and other variations along with manual "curves" adjustments.
Persistence is handled in the same way as residual cosmic rays, where the background sky nearest to the artifact is sampled and replaced with that selection.
5.3. Chromatic Ordering and Aesthetics
In order to achieve the most scientifically illustrative and aesthetically pleasing visual impact, chromatic ordering is applied almost exclusively. There are a very small number of exceptions where the scientific value gained outweighs a minor break from this convention. For instance, in the Carina NIRCam image, we assigned a yellow, rather than red, color to the long F470N filter tracing H2 emission. However, in this case, this was justified as there are many available H2 lines throughout the infrared range, and the 4.7 μm S(9) line is only one option of many. This means that color is applied based on the wavelengths of the filters, where shorter wavelengths get prescribed a bluer color, while longer wavelengths get prescribed redder color. The exact colors that get assigned depend on the data, and on what combination provides the most detailed and interesting image. We generally consider a range of color balance options, before settling on a final version that offers the best trade-off between science and aesthetics.
Once a color has been assigned and the filters have been combined, some technical and aesthetic adjustments remain. White balancing is critical in getting a natural-looking image. One method is to use the star cores as a white reference, which often yields a desirable result or at least a good starting point. A more accurate method is to use background spiral galaxies, which represent the entire range of the spectrum, as a white reference. It is also important to make sure the background sky is truly neutral in order to achieve a balanced image.
The image visualization is naturally a subjective process, but the goal is always to enhance the astrophysical features and processes in each filter through contrast adjustments, color separation, and other techniques while preserving the intrinsic integrity of the data.
This work is based on observations made with the NASA/ESA/CSA James Webb Space Telescope. The data were obtained from the Mikulski Archive for Space Telescopes at the Space Telescope Science Institute, which is operated by the Association of Universities for Research in Astronomy, Inc., under NASA contract NAS 5-03127 for JWST. These observations are associated with programs #2731, #2732, #2733, #2734, and #2736. This work is based in part on observations made with the Spitzer Space Telescope, which was operated by the Jet Propulsion Laboratory, California Institute of Technology, under a contract with NASA. We acknowledge the foundational efforts and support from the JWST instruments, STScI planning and scheduling, Data Management teams, and the Office of Public Outreach.
Footnotes
- 9
Constituted in 2016, the ERO Selection Committee members included Michael Balogh (University of Waterloo, for CSA), Jonathan Gardner (NASA, GSFC), Hashima Hasan (NASA HQ), and Antonella Nota (ESA), with support from STScI staff as Executive Secretary (initially Elena Sabbi, latterly Amaya Moro-Martin) and a Coordination Scientist (initially Kathryn Flanagan, followed by Bonnie Meinke, and then Neill Reid). The JWST Program Officer at HQ is Eric Smith.
- 10
- 11
ERO Implementation Core Team members–Klaus Pontoppidan, Alex Lockwood, Amaya Moro-Martin, Hannah Braun, Neill Reid.
- 12
Full-resolution JWST images are available on webbtelescope.org.
- 13
- 14
- 15
- 16
- 17
The CRDS context describing the NIRSpec MOS reference files was jwst_0913.pmap.
- 18
- 19
- 20