


Abstract
Short-lived radionuclides (SLRs) provide important information about the chronology of the early solar system. Among them, 41Ca, due to its decay to 41K with a half-life of only 0.1 Ma, is particularly valuable in constraining the timescales and origins of both SLRs and the formation of the oldest solar system materials, the Ca–Al-rich inclusions (CAIs). The initial abundance of 41Ca in the solar system, expressed as the (41Ca/40Ca)I ratio, is the key to unveiling the origin of this nuclide. Here, we report a new solar system (41Ca/40Ca)I ratio of 2.0 × 10⁻⁸ derived from the K isotope compositions of two CAIs. This new ratio is about four times higher than the previous value inferred from a mineral isochron. Such a high (41Ca/40Ca)I ratio in the CAIs exceeds that expected for the protosolar molecular cloud by ∼1000×, implying very late injection of the 41Ca (and possibly other SLRs) into the protosolar molecular cloud. The correlated enrichments of 41Ca and 26Al in the bulk CAI samples hint at a common stellar origin of both SLRs. The injection time estimated from our new data depends on the stellar source—it ranges from 0.6 Ma for a Wolf–Rayet wind to 1.0 Ma for a TP-AGB star ejecta.
Export citation and abstract BibTeX RIS

Original content from this work may be used under the terms of the Creative Commons Attribution 4.0 licence. Any further distribution of this work must maintain attribution to the author(s) and the title of the work, journal citation and DOI.
1. Introduction
Short-lived radionuclides (SLRs; half-lives of ∼0.1–100 Ma), present in the early solar system, are now extinct because they decayed below the detection level (Dauphas & Chaussidon 2011). They provide important constraints on the chronology of the earliest solar system events including the formation of CAIs, chondrules, and accretion of early planetesimals as well as their chemical differentiation and thermal evolution. Extinct nuclides also trace their nucleosynthetic sources and place constraints on the birth environment of the solar system. Many SLRs are believed to be products of the long-term chemical galactic evolution, while those with half-lives <1 Ma require late addition to the protosolar molecular cloud. Such an addition could be caused by either an injection from young stellar sources or in situ production by irradiation of local materials in the protosolar molecular cloud or the solar nebula itself. For example, an explosion of a nearby star, which triggered the collapse of the protosolar molecular cloud and the formation of the solar system, might have injected SLRs into it. Another possible source is the wind from a Wolf–Rayet star (Dwarkadas et al. 2017). Thus, constraining the origin of SLRs may elucidate how the forming solar system was influenced by the ambient astrophysical environment (Adams 2010). Among the SLRs, 41Ca, with an extremely short half-life of 0.0994 Ma (Jörg et al. 2012), is perhaps the most important nuclide to constrain the timescale of molecular cloud collapse and the eventual formation of a young stellar object like our Sun.
Previously, the abundance of 41Ca was inferred from the detection of radiogenic 41K excesses (δ41K*) in the oldest solar system materials, Ca–Al-rich inclusions (CAIs) in carbonaceous chondrites (Goswami 1998; Srinivasan et al. 1994, 1996). CAIs are the first solids formed in the solar nebula. The absolute U-Pb age of CAIs defines the age of our solar system (Amelin et al. 2010). Because of their early formation, CAIs provide insights into the sources of the SLRs in the solar system. Given their high Ca and very low K concentrations, CAIs are also perfect for studying the origin of 41Ca. The abundance of 41Ca expressed as the (41Ca/40Ca)I isotope ratio of 1.41 × 10⁻⁸ (Srinivasan et al. 1996) has historically been inferred from 41Ca–41K isochrons by in situ measurements using secondary ion mass spectrometry (SIMS or ion microprobe). Recently, Liu (2017) reported a much lower (41Ca/40Ca)I ratio of 4.6 × 10⁻⁹ than that of previous studies (Goswami 1998; Srinivasan et al. 1994, 1996), resulting in a reevaluation of the significance of 41Ca in the earliest solar system models, as well as the origins of 41Ca.
Here, we report a new (41Ca/40Ca)I ratio for the solar system inferred from a bulk CAI isochron established by multicollector inductively coupled plasma mass spectrometry (MC-ICP-MS). The key advantage of MC-ICP-MS is its ability to eliminate the severe matrix interferences characteristic of the ion microprobe technique. As a result, MC-ICP-MS allows, for the first time, a precise 41Ca–41K chronometry of bulk CAIs with uncertainties of the 41K/39K isotope ratios as small as 0.030‰.
2. Results
We studied four CAI samples (three chips of SJ101 and the whole CH007 inclusion), one matrix sample (Mx), and one chondrule sample (CH001) from the Allende CV3 chondrite, described in detail in the Appendix. The major and trace elements Appendix were measured in small aliquots by a quadrupole ICP-MS; the remainders were passed through ion-exchange columns for K separation, and isotope analyses were performed using the Nu Sapphire (#SP001) MC-ICP-MS equipped with a collision cell. Potassium isotope compositions are expressed relative to our laboratory standard, Merck Suprapur: δ41K (‰) =[(41K/39K)sample/(41K/39K)standard –1] ×103. Uncertainties are reported at the two-sigma level, and an overall sample reproducibility of 0.030‰ is applied to all samples; additional uncertainties were applied to the samples with high Ca/K ratios as discussed in Appendix A.2.3.
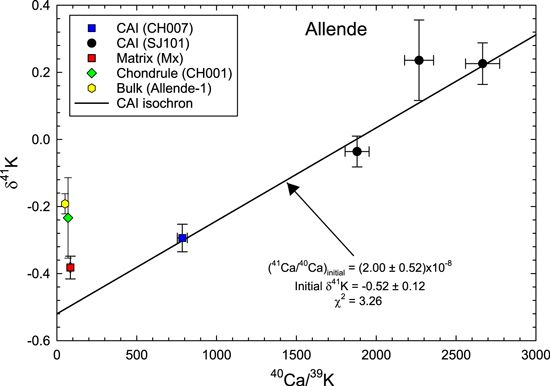
Figure 1. 41Ca–41K fossil isochron diagram. Four CAI fragments form a linear array that is interpreted as a fossil isochron (solid line). The solar (41Ca/40Ca)I ratio and δ41K values with 2σ level (2SEM) uncertainties of this CAI isochron are calculated using the weighted least-squares method (Williamson 1968). The isochron provides the new estimate of the solar system (41Ca/40Ca)I ratio that is about a factor of 5 higher than the previous value (Liu 2017). The matrix, chondrule, and whole-rock samples plot substantially above the initial δ41K of the CAI isochron, demonstrating the internal K isotope heterogeneity of the Allende meteorite. The goodness of fit is indicated by the χ2 value (see Table 2).
Download figure:
Standard image High-resolution imageThree SJ101 pieces (A, B, and C) show enrichment in 41K compared to the CH007 CAI (δ41K = −0.294‰). SJ101-A has a δ41K value of −0.036‰, while SJ101-B and -C yield more positive values of +0.226‰ and +0.236‰, respectively (Table 1). The K isotopic compositions of CAIs, plotted versus 40Ca/39K ratios in Figure 1, yield a 41Ca–41K isochron with the (41Ca/40Ca)I ratio of (2.00 ± 0.52) × 10−8. By analogy with the initial (26Al/27Al)I ratio of the bulk CAI isochron, we interpret this value as the initial ratio for the solar system (more discussion of isochron fitting in Appendix A.3–A.4). We also note that the goodness of the fits for the isochron, as indicated by the χ2 values in Figure 1, is not perfect. This is further discussed in Appendix A.4 and Table 2. The uncertainties shown in Figure 1 are maximum uncertainties as they are expanded using the square root of the χ2 values. The matrix (Mx), chondrule (CH001), and bulk sample (Allende-1) all plot significantly above the CAI isochron, implying K isotope heterogeneity in the Allende meteorite. Such heterogeneity in Allende has been recorded by Jiang et al. (2021).
Table 1. K Isotope Composition for Allende Whole-rock, Matrix, Chondrule, and Four CAI Samples
| Sample Name | Material | Weight (mg) b | K ppm c | Ca ppm c | 40Ca/39K d | 2σm −40Ca/39K | δ41K(‰) | 2σm−δ41K e | N | n |
|---|---|---|---|---|---|---|---|---|---|---|
| Allende-1 | Bulk | 172.0 | 337 | 17070 | 51.3 | 2.1 | −0.192 | 0.030 | 19 | 116 |
| Mx | Matrix | 39.0 | 166 | 13771 | 84.3 | 3.4 | −0.382 | 0.034 | 8 | 46 |
| CH001 | Chondrule | 4.4 | 949 | 65445 | 69.9 | 2.8 | −0.234 | 0.125 | 4 | 20 |
| CH007 | CAI | 17.3 | 252 | 195201 | 785 | 31 | −0.294 | 0.041 | 7 | 27 |
| SJ101-A | CAI | 27.1 | 64 | 118419 | 1880 | 75 | −0.036 | 0.046 | 5 | 29 |
| SJ101-B | CAI | 29.7 | 49 | 129746 | 2666 | 107 | 0.226 | 0.062 | 6 | 24 |
| SJ101-C | CAI | 30.1 | 60 | 133475 | 2268 | 91 | 0.236 | 0.120 | 5 | 27 |
Notes. N: analytical runs on different days; n: total sample-standard bracket measurements from N days. The δ41K values of seawater and NIST SRM−314 standards measured relative to Suprapur are +0.215 ± 0.024‰ and +0.047 ± 0.003‰, respectively (Ku & Jacobsen 2020).
a The bulk Allende-1 is based on analyses of two separate aliquots (Allende-1a and Allende-1b) of the Allende whole-rock powder (Ku & Jacobsen 2020). b Weight of the dissolved sample powder. c Concentrations of Ca and K were measured by quadrupole ICP-MS. d The atomic 40Ca/39K ratio was calculated using IUPAC values (Meija et al. 2016a, 2016b) for atomic weights (Ca = 40.078; K = 39.0983) and isotopic compositions (39K/totalK = 0.932581 and 40Ca/total Ca = 0.96941). e The total estimated uncertainty includes the CaH+ correction effect on Ca-rich samples (Appendix A.2.3).Download table as: ASCIITypeset image
Table 2. Weighted Least-squares Fits for Figures 1 and 3 in the Main Text
| Isochron | Error Multiplier (χ) | Initial 41Ca/40Ca | Initial 41Ca/40Ca Error (2σ) | Expanded 41Ca/40Ca Error (2σ) | Initial δ41K | Initial δ41K Error (2σ) | Expanded δ41K Error (2σ) |
|---|---|---|---|---|---|---|---|
| NWA 3118 | 3.8 | 4.70 × 10⁻⁹ | 1.90 × 10⁻⁹ | 7.16 × 10⁻⁹ | −5.7 | 1.5 | 5.65 |
| 4 CAIs | 1.81 | 2.00 × 10⁻⁸ | 2.88 × 10⁻⁹ | 5.20 × 10⁻⁹ | −0.520 | 0.048 | 0.120 |
Download table as: ASCIITypeset image
The previously reported δ41K values of three CAIs (Jiang et al. 2021), also measured by MC-ICP-MS, are indistinguishable from the bulk Allende value. Given the lack of petrographic description of these CAIs and unreasonably high concentrations of FeO, Na2O, and K2O in them, suggestive of contamination, we prefer not to add these data to our isochron.
3. Validity of the Bulk CAI 41Ca–41K Isochron
A two-component mixing model between the matrix and CAIs can, in principle, produce the observed linear δ41K–40Ca/39K correlation (Figure 1), as well as the correlations for the refractory elements like Al and Ti (Figures 2(a)–(b)). Such a mixing model should also produce a linear array among all CAI samples and the matrix in a δ41K versus 1/K diagram, but that is clearly not the case (Figure 2(c)). Mixing between two components also fails to reproduce the variations in the diagrams involving volatile elements (Mn, Tl, and Pb) (Figures 2(d)–(f)). Thus, the linear CAI array in the isochron diagram cannot be a result of a simple two-component mixing of CAIs and matrix. Moreover, a detailed and thorough investigation of SJ101 (Petaev & Jacobsen 2009) shows only minuscule patches of matrix attached to its exterior and the lack of such material inside. This effectively rules out matrix contamination of the SJ101 interior fragments used in this study. The images of CH007 (Appendix) do show some matrix loosely attached to the inclusion. It is unclear how much matrix is left after fragmentation and sonication of this sample, but its contribution to the sample can be accessed from the concentrations of highly volatile elements (e.g., Pb and Tl), which are enriched in matrix by factors of ∼28 and ∼27, respectively. Assuming all Pb and Tl in CH007 are from matrix (Table 3), the maximum contribution from matrix is only 3.7 wt%. Because the matrix-free samples, SJ101, also contain Pb and Tl at ∼0.5 × CH007 levels, the matrix contribution to CH007 must be <2 wt%. The effect of such a small addition of matrix on either the K isotopic composition or K/Ca ratio of CH007 CAI is less than the analytical uncertainty of the δ41K measurements. We conclude (1) that the linear CAI array in Figure 1 is a fossil isochron, not a mixing line, and (2) that a very small matrix component, if left on the CAIs, should have no effect on the measured δ41K values or the interpretation of the data.
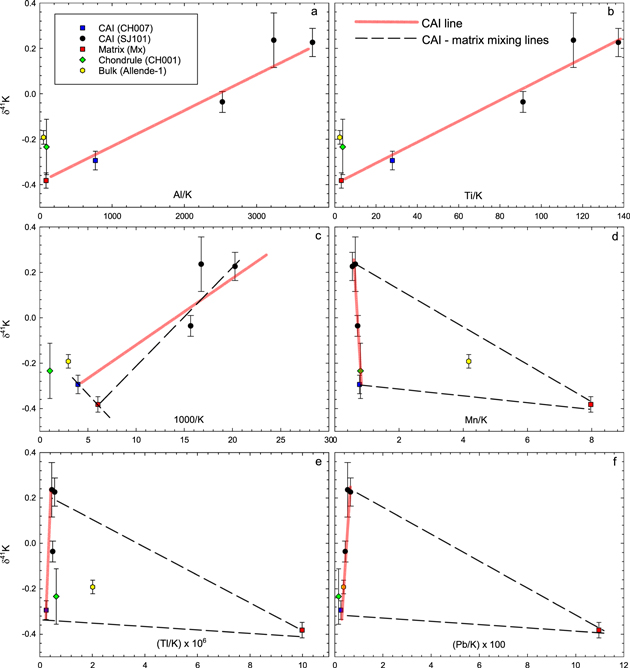
Figure 2. Matrix–CAI mixing relationships. Two-component mixing yields straight lines in these diagrams. Aluminum (Al) and Ti are refractory elements, Mn is a moderately volatile element, and Tl and Pb are highly volatile elements. The plots of δ41K vs. ratios of refractory elements to K show similar patterns to that of the δ41K–Ca/K isochron (Figure 1), meaning that all refractory elements (Ca, Al, and Ti) behave coherently. Such a mixing model should also produce a linear array between all CAIs and matrix in a δ41K vs. 1/K diagram (pink line in Figure 2(c)). The significant deviation of the CAI linear array (black dashed line in Figure 2(c)) from the matrix–CAI mixing array demonstrates that the former is not a mixing line. Furthermore, very different slopes of mixing arrays in the diagrams (d)–(f) plotting δ41K vs. ratios of volatile elements in order of increasing volatility (Mn, Tl, and Pb) to K imply that the linear relationship between matrix and CAIs in the isochron diagram cannot be the result of a simple two-component mixing of matrix and CAIs. Therefore, the linear correlation between δ41K and 40Ca/39K suggests that the excesses in 41K in the samples studied are due to 41Ca decay, so the observed correlation is an isochron. Concentrations of trace elements are listed in Tables 3 and 4.
Download figure:
Standard image High-resolution image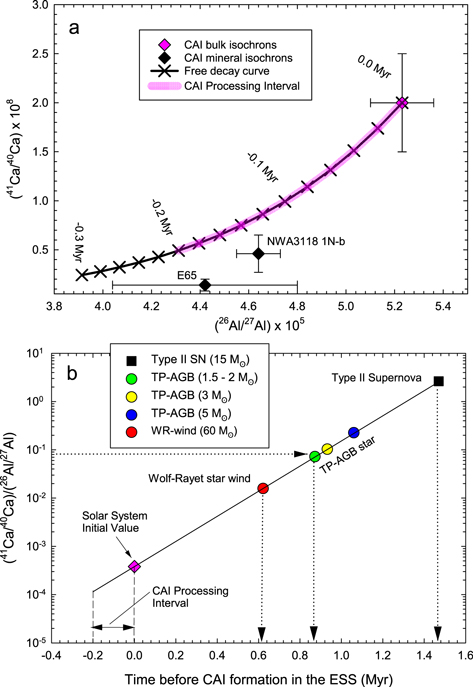
Figure 3. 41Ca and 26Al constraints on early solar system chronology. (a) Comparison of 41Ca/40Ca and 26Al/27Al bulk CAI (this study), and the mineral isochrons. The mineral isochrons are from E65 (Efremovka) (Liu et al. 2012; Srinivasan & Chaussidon 2013) and NWA 3118 #1Nb (Liu 2017; MacPherson et al. 2013). Our new estimate of (41Ca/40Ca)I is consistent with the (26Al/27Al)I results (Jacobsen et al. 2008a), both showing higher initial values of bulk CAI isochrons than those of mineral isochrons. The age difference between the bulk CAI and mineral isochrons is likely caused by CAI processing after their formation. Combining two extinct isochrons yields a ∼0.26 Ma interval as the best estimate of CAI processing time for these three samples. This interval is consistent with a total 0.2 Ma time span inferred from the 26Al–26Mg mineral isochrons of 25 CAI samples. Note that time runs backward, i.e., younger events are negative while the older events, predating CAI formation, are positive relative to t0 , the time of CAI formation represented by the bulk CAI isochrons. (b) Evolution of the (41Ca/40Ca)/(26Al/27Al) ratio with time before CAI formation. The slope of the line is defined by the mean lives of 41Ca (0.1434 Ma) and 26Al (1.035 Ma), while its position is tied to the initial solar system values reported here and in the literature (Jacobsen et al. 2008a). The dashed arrowed lines show the times of injection into the protosolar molecular cloud. The numbers before the M⊙ symbols are the stellar masses relative to the Sun's mass. The estimated injection times range from 0.62 Ma for 60 M⊙ Wolf–Rayet stars, 0.87–1.06 Ma for 1.5−5 M⊙ TP-AGB stars, to 1.47 Ma for a 15 M⊙ Type II supernova. Data and references are listed in Tables 5 and 6.
Download figure:
Standard image High-resolution imageTable 3. Concentrations (ppm) of Selected Major and Trace Elements (Source Data for Figure 2)
| Sample Name | Na | Mg | Al | Ti | Cr | Mn | Fe | Cs | Tl | Pb |
|---|---|---|---|---|---|---|---|---|---|---|
| Allende-1 (bulk) | 3705 | 146014 | 17511 | 827 | 3243 | 1406 | 224066 | 0.101 | 0.0680 | 1.24 |
| Mx | 2498 | 119531 | 14421 | 532 | 2781 | 1320 | 248573 | 0.083 | 0.1650 | 18.1 |
| CH001 | 17083 | 153167 | 88853 | 3659 | 4020 | 755 | 141363 | 0.066 | 0.0597 | 1.52 |
| CH007 | 6568 | 40631 | 194124 | 7028 | 410 | 195 | 23891 | 0.027 | 0.0062 | 0.64 |
| SJ101-A | 1191 | 126016 | 161300 | 5820 | 691 | 46 | 10209 | 0.018 | 0.0032 | 0.28 |
| SJ101-B | 800 | 141642 | 186227 | 6780 | 788 | 27 | 7933 | 0.024 | 0.0028 | 0.32 |
| SJ101-C | 962 | 147030 | 193195 | 6898 | 973 | 38 | 10009 | 0.023 | 0.0027 | 0.32 |
Download table as: ASCIITypeset image
Table 4. Concentrations (ppm) of Rare Earth Elements (REEs) (Source Data for REEs in Figure 2)
| Sample Name | La | Ce | Pr | Nd | Sm | Eu | Gd | Tb | Dy | Ho | Er | Tm | Yb | Lu |
|---|---|---|---|---|---|---|---|---|---|---|---|---|---|---|
| Allende-1 (bulk) | 0.588 | 1.447 | 0.225 | 1.160 | 0.352 | 0.119 | 0.431 | 0.081 | 0.521 | 0.105 | 0.310 | 0.062 | 0.363 | 0.048 |
| Mx | 0.598 | 1.473 | 0.208 | 1.002 | 0.311 | 0.098 | 0.396 | 0.064 | 0.413 | 0.084 | 0.244 | 0.397 | 0.276 | 0.126 |
| CH001 | 2.929 | 7.690 | 1.161 | 6.279 | 2.118 | 0.624 | 3.072 | 0.537 | 3.611 | 0.800 | 2.451 | 0.418 | 1.306 | 0.344 |
| CH007 | 4.145 | 13.795 | 2.031 | 9.435 | 3.788 | 1.337 | 0.614 | 0.126 | 0.748 | 0.058 | 0.128 | 1.182 | 3.749 | 0.013 |
| SJ101-A | 5.721 | 15.717 | 2.270 | 11.898 | 3.680 | 0.813 | 2.851 | 0.457 | 2.329 | 0.202 | 0.505 | 0.738 | 2.222 | 0.057 |
| SJ101-B | 6.082 | 16.985 | 2.421 | 13.009 | 4.072 | 0.838 | 2.986 | 0.477 | 2.474 | 0.213 | 0.602 | 0.810 | 2.476 | 0.065 |
| SJ101-C | 6.036 | 16.919 | 2.430 | 12.657 | 3.985 | 0.866 | 2.979 | 0.472 | 2.458 | 0.211 | 0.548 | 0.790 | 2.456 | 0.064 |
Download table as: ASCIITypeset image
Both the commonly observed aqueous alteration in CV chondritic meteorites and natural K isotope fractionation could have affected or disturbed the isotope systematics of the 41Ca−41K system by changing somewhat both the δ41K and K/Ca ratios of the samples studied. Both processes would lead to nonlinear effects and are not likely to produce the observed isochron.
The recent study of secondary aqueous alteration of Allende CAIs (e.g., Krot et al. 2021) shows that during the alteration Si, Na, Cl, K, Fe, S, and Ni could be added to, while Ca, Mg, and some Al could be removed from the host inclusions to a various degree. Such an alteration typically affects only melilite and anorthite; it is highly localized and never extends to a whole inclusion. Our detailed study of SJ101 (Petaev & Jacobsen 2009) detected only a few grains of melilite partially replaced by grossular, monticellite, and rare wollastonite. Minute euhedral grains of andradite were observed in voids. The lack of Na-rich phases among alteration products implies that no Na and, most likely, no K were added. Additionally, Sr, a very mobile element during aqueous alteration, shows coherent concentrations with other refractory elements across all SJ101 chips, implying that aqueous alteration could only have a minor effect, if any, in these samples (Appendix A.1). However, both CH001 and CH007 (Appendix A.1) provide clear mineralogical evidence of metasomatic reactions of their peripheral portions with an aqueous fluid containing Na, Cl, K, Si, Fe, Mg, Mn, Ca. Among them, K, Ca, Na, and Cl are of particular interest because the first two elements directly affect the δ41K–40Ca/39K correlation while Na and Cl are excellent tracers of the extent of alteration. Si, Na, and Cl have been added to and Ca removed from both CH001 and CH007, resulting in substitution of anorthite (CH001) and melilite (CH007) by sodalite and nepheline. The fate of K is different—its concentration is markedly increased in the altered areas of CH001 where some nepheline grains contain up to ∼1.5 wt% K2O, but the K distribution in the KKα X-ray map of CH007 is homogenous throughout the whole sample, regardless of the Na and Cl distributions. Also, the EDS point analyses of alteration phases in CH007 do not detect K. The bulk Na/K ratio in CH007 (∼26) is markedly higher than that of other samples (ranges from 15 to 18), suggesting that the aqueous alteration did not add much K to CH007 and therefore did not disturb the 41Ca−41K systematics of CH007.
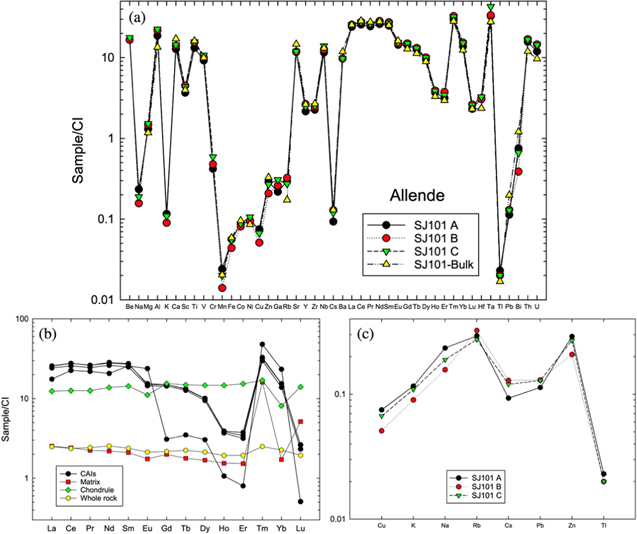
Figure 4. Major and trace element concentrations in samples studied. (a) The extremely coherent elemental patterns of the three SJ101 chips are essentially identical to that of a bulk SJ101 sample analyzed by Petaev & Jacobsen (2009). Especially, Sr as a refractory but mobile element shows consistent concentrations, eliminating significant effect from aqueous alteration in these samples. (b) All CAIs have a Group II rare Earth element (REE) pattern—depleted in the most refractory REEs (heavy REEs except for Tm and Yb). The Allende bulk, matrix, and chondrule samples show relatively flat REE patterns. The CI meteorite data are from McDonough & Sun (1995). Concentrations of the REEs are listed in Table 4. (c) The coherent behavior of selected volatile elements in three SJ101 chips suggests that there is no major effect of fractionation from evaporation related to K loss.
Download figure:
Standard image High-resolution image
Figure 5. Combined elemental map of the CH001 thin section in Mg (red), Ca (green), and Al (blue) Kα X-rays. Mineral colors: red—forsterite, pink—spinel, yellow—Al-diopside, cyan—anorthite, blue—secondary sodalite and/or nepheline partially or completely replacing primary anorthite, light green—secondary salitic clinopyroxene, black—Ni-rich pyrrhotite.
Download figure:
Standard image High-resolution image
Figure 6. The BSE images (a), (c) and combined elemental maps (b), (d) of CH007 in Mg (red), Ca (green), and Al (blue) Kα X-rays. The whole CAI fragment (a) has an irregular fracture surface with the depressions being completely or partially filled with fine-grained matrix. The black box outlines the area shown in panels (c) and (d). Mineral colors (b), (d): red—matrix olivine, pink—spinel, cyan/light green—melilite, "dirty" green—Al, Ti-rich clinopyroxene, blue—secondary sodalite and nepheline replacing melilite adjacent to the Wark–Lovering rim, black—deep depressions or very steep slopes. The dotty appearance and blurry grain outlines in panel (b) are due to the roughness of the CH007 surface; these effects are much less pronounced on a more even surface at the CAI edge (c), (d). The green to cyan transition in melilite color is caused largely by the increase of Al contents outward due to evaporative loss of Si and Mg during CAI crystallization. Thin blue bands along grain boundaries or cleavage planes of melilite in panel (d) show secondary alteration by Al-rich minerals depleted in Ca and Mg such as nepheline and sodalite.
Download figure:
Standard image High-resolution image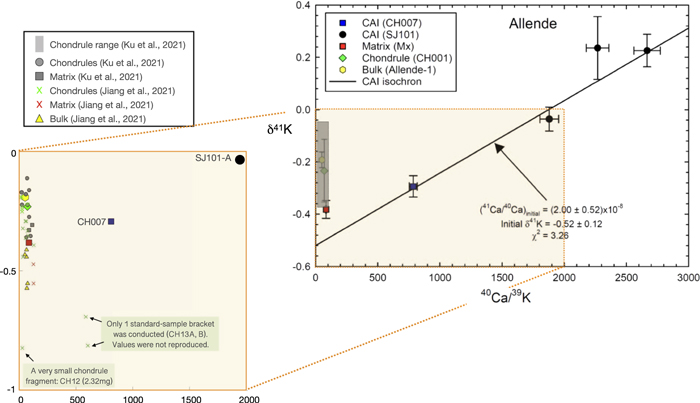
Figure 7. Comparison of our δ41K data with the literature. The δ41K values of 26 chondrules (18 from Jiang et al. 2021; from Ku et al. 2021) range from −0.4‰ to −0.1‰. Three outliers (Jiang et al. 2021) are most likely due to small sample sizes (∼2 mg), which lack reproducibility (n = 1). None of the chondrules lie on the 41Ca−41K bulk isochron. The difference in the bulk Allende values between Jiang et al. and Ku and Jacobsen are likely due to the large difference in sample size. Ku and Jacobsen used an aliquot of a large (34 grams) powdered representative sample of the bulk Allende, while the five bulk Allende samples analyzed by Jiang et al. are separate chips weighing ≤0.090 g each.
Download figure:
Standard image High-resolution image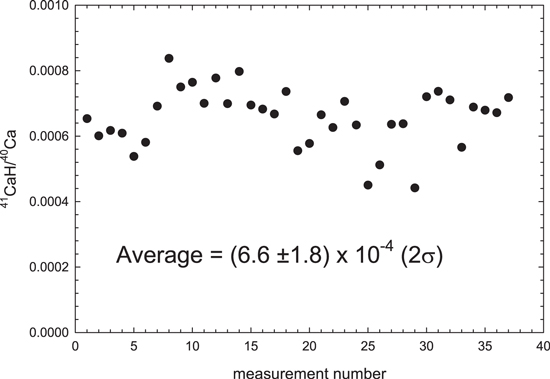
Figure 8. Measurements of the CaH/Ca ratio used for interference corrections of the K isotope compositions for the period of the measurements. The 2σ uncertainty is 27% of the average CaH/Ca ratio.
Download figure:
Standard image High-resolution image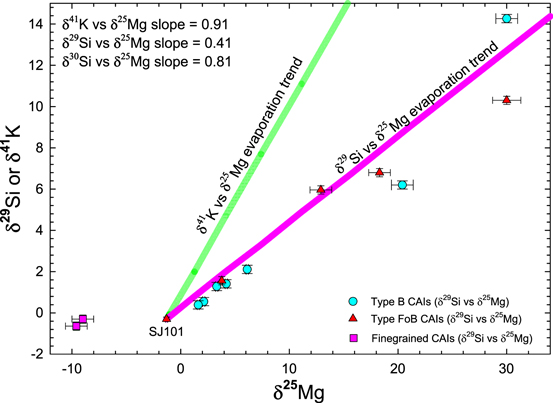
Figure 9. Literature survey of δ29Si and δ25Mg data of different types of CAIs, summarized by Petaev & Jacobsen (2009). The calculated δ29Si vs. δ25Mg evaporation trend based on the experimental results of Mendybaev et al. (2013) is shown for comparison. The δ41K vs. δ25Mg evaporation trend is calculated based on simple square root fractionation factors because of the lack of appropriate experimental data (see Appendix A.5).
Download figure:
Standard image High-resolution image
It has been argued that the correlated Mg and Si compositions of CAIs were caused by partial loss of these elements during thermal processing accompanied by kinetic isotope fractionation. At the high temperatures of the solar nebula, the near-equilibrium isotopic fractionation of K, if it has occurred, is very small and likely negligible (more discussion in Appendix A.5). The lack of Si and Mg isotope fractionation in SJ101 (Jacobsen et al. 2008b; Petaev & Jacobsen 2009) provides clear evidence that neither SJ101 as a whole nor its precursors have experienced nonequilibrium processing involving kinetic isotope fractionation of these elements. The melilite mantles in Type B1 CAIs like CH007 are typically interpreted as evidence of evaporative loss of Si and Mg during the earlier stages of CAI crystallization before the mantles seal off the interiors. Such a loss is expected to induce kinetic isotope fractionation, which has not been found in two CAIs studied in detail by Bullock et al. (2013). Even if such a kinetic fractionation would have occurred, it should make the K isotope composition of CH007 heavier than that of SJ101. However, CH007 is lighter than SJ101 so this effectively rules out the derivation of the K isotopic composition of CH007 from that of SJ101. Theoretically, the heavier K isotopic composition of SJ101 can be explained by a nonequilibrium evaporative loss of K from CH007, but the depletion of SJ101 in refractory Ca, Al, and Ti along with the enrichment in moderately volatile Mg and Si, relative to CH007, rules out such a formation scenario. Therefore, the overall positive correlation between δ41K and 40Ca/39K ratios is unlikely to be a result of a mass-dependent K isotope fractionation.
Because neither two-component mixing nor chemical or thermal processing of the CAIs studied can account for the observed linear relationship between the δ41K and 40Ca/39K ratios, we interpret this linear correlation as an extinct isochron caused by 41Ca decay. The small-scale scatter of data points along the isochron could result from an initial 41Ca/40Ca heterogeneity (perhaps not surprising for a nuclide (41Ca) with such a short half-life) or minor effects of chemical or thermal processing.
Our (41Ca/40Ca)I ratio for the solar system of 2.00 × 10⁻⁸ is about four times higher than the previous value of 4.6 × 10⁻⁹ inferred from SIMS measurements (Liu 2017). The latter study was able to analyze samples with an extremely wide range of Ca/K ratios (103 to 106) on a microscale. However, because the precision of the SIMS measurements was low (uncertainties exceeding 70‰), isobaric interferences with other species could result in a false correlation in a fossil isochron diagram (such an example for the 60Fe–60Ni system is discussed by Trappitsch et al. 2018). In addition, the resultant 41K/39K–40Ca/39K correlation and its slope heavily rely on very few points with extremely low K. Such analytical challenges are likely the main cause of the large variations in (41Ca/40Ca)I ratios (from 1.4 × 10⁻⁸ to 4.2 × 10⁻⁹) among published mineral isochrons (Srinivasan et al. 1996; Sahijpal et al. 2000; Ito et al. 2006; Liu et al. 2012; Liu 2017). Moreover, the mineral isochrons themselves could also reflect resetting by the multiple events in many CAIs. In contrast, the MC-ICP-MS technique removes such isobaric interferences by analyzing chemically separated high-purity K solutions, with high precision.
4. CAI Processing Interval
Previously, the (41Ca/40Ca)I ratio for the solar system was established by SIMS analyses of a few CAIs (Table 5). The discrepancy in (41Ca/40Ca)I ratios between the SIMS and our MC-ICP-MS studies likely results from the differences between the bulk and mineral isochrons, which date the initial closure of the 41Ca−41K system of a whole CAI and subsequent disturbances, respectively. The mineral isochrons for the Type B1 E65 and Type A NWA 3118 1Nb CAIs are different, with both having lower 41Ca/40Ca ratios (Liu 2017; Liu et al. 2012) than our bulk Type B CAI isochron. The existence of two distinct 41Ca reservoirs for Type A and Type B CAIs is inconsistent with the δ26Mg isotope data (MacPherson et al. 2017) that reveal no temporal evolutionary sequence among CAIs of different types. This means that the younger ages with lower (41Ca/40Ca)I ratios inferred from mineral isochrons, which date the last mineral reequilibration events, probably reflect nebular processing of CAIs. Specifically, the mineral 41Ca–41K isochrons of Liu et al. (2012) and Liu (2017) are ∼0.4 Ma younger than our bulk CAI isochron; this time difference likely corresponds to an interval of CAI processing after the 41Ca–41K closure age determined by the bulk CAI isochron.
Table 5. Summary of Initial (41Ca/40Ca)I and (26Al/27Al)I Ratios from Various CAIs (Source Data for Figure 3(a))
| Meteorite | Sample Name | Isochron Type | (41Ca/40Ca)I | (26Al/27Al)I | Data Source 41Ca/40Ca | Data Source26Al/27Al |
|---|---|---|---|---|---|---|
| Allende | Allende | Bulk CAI | (2.00 ± 0.52)×10−8 | (5.23 ± 0.13)×10−5 | This study | 1 |
| Allende | SJ101 | Bulk/mineral | (2.00 ± 0.52)×10−8 | (5.20 ± 0.53)×10−5 | This study | 2 |
| Allende | Alvin | Mineral | N/A | (4.17 ± 0.43)×10−5 | N/A | 2 |
| Efremovka | E65 | Mineral | (1.4 ± 0.6)×10−9 | (4.42 ± 0.38)×10−5 | 3 | 4 |
| NWA 3188 | #1Nb (NWA) | Mineral | (4.6 ± 1.9)×10−9 | (4.64 ± 0.09)×10−5 | 5 | 6 |
References. (1) Jacobsen et al. (2008a), (2) MacPherson et al. (2017), (3) Liu et al. (2012), (4) Srinivasan & Chaussidon (2013), (5) Liu (2017), (6) MacPherson et al. (2013).
Download table as: ASCIITypeset image
A similar CAI processing interval of 0.2 Ma was used by MacPherson et al. (2017) to explain the variations of (26Al/27Al)I ratios among 25 CAI mineral isochrons relative to the bulk CAI isochron. A combination of 41Ca–41K and 26Al–26Mg extinct systems extends the CAI processing interval (Figure 3) to ∼0.26 Ma when considering the large uncertainty of the E65 (26Al/27Al)I ratio.
5. Origin and Nucleosynthetic Injection of 41Ca
The SJ101 mineral 26Al–26Mg isochron (MacPherson et al. 2017) yields an age and an (26Al/27Al)I ratio indistinguishable from the bulk 26Al–26Mg Allende CAI isochron (Jacobsen et al. 2008a), implying that SJ101 experienced very little or no mineral disturbances after its initial formation. This suggests that the inferred (41Ca/40Ca)I and (26Al/27Al)I ratios of SJ101 currently provide the best estimate of the initial abundances of 41Ca and 26Al in the solar system.
The 41Ca in the solar system could have been produced by in situ irradiation in the early solar nebula or, alternatively, by stellar nucleosynthetic injections from outside the solar nebula. Irradiation by energetic protons and alpha particles could result in local 41Ca heterogeneity in the solar nebula (Lee et al. 1998), as is the case for 10Be. Irradiation calculations depend on various parameters, including the magnitude of X-ray emission from young stars, quantified as fluence, and the initial compositions of the target nuclides (i.e., 40Ca(p,pn)41Ca). The fluence, as a function of flux and time, could be estimated from the astrophysical observations of T Tauri stars, pre-main-sequence stars that may be similar to our young Sun. The resultant (41Ca/40Ca)I value is highly sensitive to the magnitude of fluence; for instance, increasing fluence by a factor of 10 would increase the (41Ca/40Ca)I ratio by an order of magnitude (Leya et al. 2003). The target chemical composition is typically assumed to be either the solar composition or the nominal CAI composition. The (41Ca/40Ca)I ratio produced by irradiation is tied to the (10Be/9Be)I ratio from the same sample, but because the latter is not available for SJ101, we could only rely on theoretical calculations. Leya et al. (2003) used the average (10Be/9Be)I for CAIs to calculate (41Ca/40Ca)I of 2.6 × 10⁻⁸ for the solar composition and (41Ca/40Ca)I of 3.3 × 10⁻⁷ for the present-day CAI compositions. While the irradiation conditions inferred for 10Be can potentially account for the observed 41Ca, 26Al will be underproduced by a factor of ∼2–5 (Dauphas & Chaussidon 2011). The irradiated 26Al is produced by the reaction 27Al(p,pn)26Al, so the solar 27Al abundance will result in an (26Al/27Al)I ratio of ∼10−6, much less than the measured value (Jacobsen et al. 2008a). In addition, the similar δ26Mg values for Earth, CAIs, and chondrules hint at a homogeneous distribution of 26Al, which is inconsistent with the expected local heterogeneity developing during local irradiation. Also, 26Al and 10Be abundances show no correlation in hibonite-bearing inclusions and CAIs (Liu et al. 2009), making the production of 26Al by irradiation less plausible (Dauphas & Chaussidon 2011). The higher (41Ca/40Ca)I and (26Al/27Al)I ratios inferred from the bulk 41Ca–41K and 26Al–26Mg isochrons likely point to a similar stellar origin of 41Ca and 26Al.
Pollution of the protosolar molecular cloud by freshly produced nuclides injected by supernova shock waves from supernova explosions, AGB, or Wolf–Rayet star winds is the main working hypothesis for explaining the higher abundances of the shortest-lived extinct nuclides in the solar system relative to the galactic background (Table 6). For example, the (26Al/27Al)I ratio of (5.23 ± 0.13) × 10−5 for the solar system is more than three orders of magnitude higher than that of the protosolar molecular cloud (1.1 × 10⁻⁸; Table 7). The new solar system (41Ca/40Ca)I of (2.00 ± 0.52) × 10−8 is also about three orders of magnitude higher than that of the molecular cloud (4 × 10⁻¹¹; Table 7). Clearly, the inferred concentrations of both 41Ca and 26Al in CAIs require late injection(s) from outside the protosolar molecular cloud.
Table 6. Nucleosynthetic Production Ratios of 26Al/27Al and 41Ca/40Ca for Type II Supernova, AGB Stars, Wolf–Rayet Winds, and the Solar Initial (Defined by the Bulk CAI Isochrons) (Source Data for Figure 3(b))
| Nucleosynthetic Source | Data Source | M⊙ | 26Al/27Al | 41Ca/40Ca | (41Ca/40Ca)/ (26Al /27Al) | t (Myr) before CAI Formation |
|---|---|---|---|---|---|---|
| SN II | 1 | 15 | 5.7 × 10⁻³ | 1.5 × 10⁻² | 2.63 | 1.47 |
| TP-AGB | 1 | 1.5 | 5.8 × 10⁻³ | 4.2 × 10⁻⁴ | 0.0724 | 0.873 |
| TP-AGB | 1 | 2 | 3.6 × 10⁻³ | 2.6 × 10⁻⁴ | 0.0722 | 0.872 |
| TP-AGB | 1 | 3 | 2.9 × 10⁻³ | 3.0 × 10⁻⁴ | 0.103 | 0.932 |
| TP-AGB | 1 | 5 | 5.3 × 10⁻⁴ | 1.2 × 10⁻⁴ | 0.226 | 1.06 |
| WR-wind a | 2–4 | 60 | 4.3 × 10⁻² | 6.9 × 10⁻⁴ | 0.016 | 0.62 |
| CAI-Bulk | this study and 5 | 5.23 × 10⁻⁵ | 2.00 × 10⁻⁸ | 3.82 × 10⁻⁴ | 0.00 | |
| CAI processing | 6 | 4.31 × 10⁻⁵ | 4.96 × 10⁻⁹ | 1.15 × 10⁻⁴ | –0.200 |
Note.
a WR-wind mass production of 26Al and 41Ca is from Table 2 of Young (2014) for a 60 solar-mass (M⊙) rotating Wolf–Rayet star. It lists 26Al = 7 × 10⁻⁵ M⊙ from Gounelle & Meynet (2012) and 41Ca = 8 × 10⁻⁷ M⊙ from Arnould et al. (2006). When combined with the 27Al/40Ca = 1.43 for the solar system from Anders & Grevesse (1989), this gives (41Ca/40Ca)/(26Al /27Al) = 0.016 for the protosolar molecular cloud right after the last WR-wind injection. The (41Ca/40Ca) = 6.9 × 10⁻⁴ is from Figure 6 of Arnould et al. (2006) by using their dilution factor of 2160 and correcting to their Δ* (free decay) = 0. This gives (26Al /27Al) = 4.3 ×10⁻², consistent with the values listed in Table 2 of Young (2014).References. (1) Wasserburg et al. (2006), (2) Arnould et al. (2006), (3) Gounelle & Meynet (2012), (4) Young (2014), (5) Jacobsen et al. (2008a), (6) MacPherson et al. (2017).
Download table as: ASCIITypeset image
Table 7. Calculated Abundances of 41Ca/40Ca and 26Al/27Al in the Protosolar Molecular Cloud; Details Can be Found in Jacobsen (2005)
| 41Ca/40Ca | 26Al/27Al | |
|---|---|---|
| (NR/NS)/(PR/PS) for Interstellar Medium (ISM) | 4 × 10⁻⁵ | 2 × 10⁻⁴ |
| (NR/NS)/(PR/PS) for Molecular Cloud (MC) | 4 × 10⁻⁸ | 2 × 10⁻⁶ |
| PR/PS | 1 × 10⁻³ | 5.4 × 10⁻³ |
| (NR/NS) for ISM | 4 × 10⁻⁸ | 1.1 × 10⁻⁶ |
| (NR/NS) for MC | 4 × 10⁻¹¹ | 1.1 × 10⁻⁸ |
Note. R: radioactive isotope; S: stable isotope; NR/NS: initial solar ratios of radioactive to stable isotopes; PR/PS: nucleosynthetic production ratios.
Download table as: ASCIITypeset image
The constraints on the timing of such injections are dependent on the initial solar system abundances and nucleosynthetic sources of injections. As discussed above, the initial (41Ca/40Ca)I and (26Al/27Al)I ratios of the solar system are defined by the bulk CAI (not mineral) isochrons. Then, by tracing the closed-system evolution of both isotope systems back in time and comparing the calculated values with those modeled for TP-AGB stars, Type II supernovae (Wasserburg et al. 2006), and Wolf–Rayet stars (Young 2014), one can estimate the time of injection for each nucleosynthetic source (Figure 3(b)). This time ranges from 0.62 Ma for a 60 solar-mass (M⊙) Wolf–Rayet star to 0.87–1.06 Ma for a low-mass (1.5 M⊙–2 M⊙) AGB star or ∼1.47 Ma for a 15 M⊙ Type II supernova.
Theoretical predictions and astrophysical observations demonstrate the plausibility of the triggered formation of the solar system, known as the rapid collapse of the protosolar molecular cloud (Hartmann et al. 2012; Dale 2015). If the majority of both 41Ca and 26Al is due to a late injection, then the well-determined initial abundance of both nuclides places an upper limit on the time span between the collapse of the protosolar molecular cloud and the formation of the solar system. Among the three possible sources mentioned above, a supernova injection is currently inconsistent with the low abundance of 60Fe in solar system materials (Trappitsch et al. 2018). Thus, the event that might have triggered the collapse of the parental molecular cloud would have taken place between 0.6 and 1.1 Ma before CAI formation, implying a very short timescale of formation for our Sun.
We are very thankful to the late Dr. Ursula B. Marvin for donating the CH007 CAI and the CH001 chondrule as well as two Allende specimens used for the preparation of the Allende whole-rock powder and matrix samples. We are also grateful to Dr. Natasha V. Krestina for preparing the Allende matrix sample and Dr. C. A. Parendo for help in the laboratory. We thank Dr. E. Young, Dr. M.-C. Liu, Dr. L. Zeng, and Dr. J. Mitrovica for help with some aspects of this paper. Y. K. thanks the Harvard Origins of Life Initiative, NASA (grant number 80NSSC20K0346 to S.B.J.), and the DOE-NNSA (grant number DE-NA0003904 to S.B.J.) for supporting her graduate research. This work was primarily supported by the NASA Emerging Worlds Program grant number 80NSSC20K0346 to S.B.J.
Appendix
A.1. Sample Descriptions
We analyzed six samples—one matrix (Mx), one chondrule (CH001), and four CAIs (three chips of SJ101 and whole CH007). Mineralogy and mineral chemistry of CH001 and CH007 were studied by EPMA/SEM techniques using the JXA-8230 electron microprobe at Harvard University. Detailed petrologic and chemical studies of the SJ101 CAI were also done earlier by Petaev & Jacobsen (2009). The SJ101 CAI is a very large (∼2.5 × 1.5 cm in size, 6.34 g) forsterite-bearing Type B (FoB) CAI that consists of several igneous lithologies representing multiple spinel–melilite–anorthite–clinopyroxene-bearing CAIs of previous generations "glued" together by forsterite–clinopyroxene bands of variable thicknesses. The latter was formed by the melting of forsterite-rich rims and adjacent portions of primary CAIs while the CAIs' cores have remained solid. The type II REE pattern of SJ101 (Table 4; Figure 4) points to a condensation origin of its precursors while the lack of Si and Mg isotope fractionations rules out an evaporative loss of these elements during the last melting episode. Secondary alteration involving the exchange of Ca, Si, Fe, Na, and Cl between matrix, chondrules, and CAIs, typical for many Allende samples, is very minor and affects only limited areas in the melilite. The three dissolved samples (A, B, and C) are fresh chips from the interior of the inclusion.
The CH001 chondrule, a nearly ideal spherule of ∼3 mm across weighing ∼15 mg, was mounted in epoxy and sliced off-center; the smaller chip was used for the preparation of a polished thin section. The larger chip (8.8 mg) after extraction from epoxy and thorough cleaning was powdered and used for K isotope analysis. The epoxy was analyzed and found to contain insignificant K. The chondrule consists mainly of ground mass of intergrown anorthite (<1 wt% Na2O, no detectable K2O) and Al-diopside laths and minor forsterite that encloses clusters of large forsterite (<1 wt% FeO) or spinel (<1 wt% FeO and Cr2O3) or Fe,Ni sulfide grains (Figure 5). The chondrule exhibits an alteration rind of variable thickness where the anorthite is nearly completely replaced by sodalite or nepheline, or both, and olivine and spinel grains show a significant outward increase in FeO contents. The alteration rind is enriched in Na and K by ∼2× compared to the central unaltered part of the chondrule.
The rounded polyhedral sample CH007 (19.1 mg) was imaged intact (Figure 6) in order to save material and classified as a fragment of a Type B1 CAI with a pronounced melilite mantle and clear Wark–Lovering rim. The CAI is partially covered by adhered fine-grained Mg-rich material mainly filling the depressions on the sample surface (Figure 6(a)). The core consists of gehlenitic melilite and Al, Ti-rich clinopyroxene both enclosing euhedral spinel grains (Figures 6(b) and (d)). The melilite of the rim is enriched in Al and depleted in Mg and Si compared to the core melilite. The Wark–Lovering rim is partially replaced by secondary sodalite and nepheline as suggested by the presence of Na and Cl. An area at the CAI edge not covered by matrix (Figures 6(c) and (d)) shows only minor secondary alteration of melilite along grain boundaries and/or cleavage cracks (Figure 6(d)). This clean area (Figure 6(d)) has much lower Na and K concentrations compared to the bulk. This could suggest that the higher Na and K concentrations in the bulk CAI are due to the addition of the matrix to the CAI material; however, the plots in Figure 2 suggest that such an effect must be rather minimal.
The Allende whole-rock sample was prepared by powdering a 34 g chunk of the meteorite. The Allende sample matrix was separated by sequential sieving of a crushed 43 g sample fragmented by the SELFRAG company. All samples were carefully handpicked under a binocular microscope and sonicated in ethanol to further ensure their purity. The finest fraction (<23 μm) weighing 107 mg contains no visible chondrule fragments. K isotopic data for other chondritic components, such as chondrule and matrix, are shown in Figure 7.
A.2. K Isotope Analytical Methods and Data
A.2.1. Acid Dissolution and Chemical Purification of Potassium (K)
Aliquots (10–40 mg) of the matrix, as well as chondrule and CAI powders, were dissolved in multiple steps using mixtures of concentrated HF, HCl, and HNO3. The first step requires adding a mixture of 0.5 mL HF, 2 mL HNO3, and 1 mL HCl acids, which was then heated to 160°C on a hotplate for a day. For the second dissolution step, the resulting solutions were dried down, and a mixture of 2 mL HNO3, 6 mL HCl, and 1 mL purified MQ H2O was added to Teflon EasyPrep vessels for high-temperature and high-pressure dissolution applications. The samples were then repeatedly heated to 210°C in a CEM MARS 6 microwave digestion system. After complete digestion, the aliquots were redissolved in a dilute 0.5N HNO3 solution for K ion-exchange column chemistry.
To separate K, the bulk solutions were loaded into 13 mL fused silica chromatography columns filled with Bio-Rad AG50W-X8 cation-exchange resin (100–200 mesh) using our established procedure (Ku & Jacobsen 2020). Here, all samples were passed through the columns three times in order to purify the K cuts (>99% yield). The K solutions were then dried down and redissolved in dilute HNO3 (∼2%) for MC-ICP-MS analysis.
A.2.2. Acquisition of K Isotope Ratios by Mass Spectrometry
Potassium (K) isotopes were measured at Harvard University using a multicollector ICP-MS Nu Sapphire (serial #SP001) that is equipped with a hexapole collision cell to eliminate mass interference from Ar-bearing ions such as ArH+, Ar+, and ArO+. The samples and standard were matched for 39K intensity to within 1%. The measured K isotope values are expressed relative to our lab standard, a batch of Merck KgaA high-purity KNO3 Merk Suprapur:
For each analytical run, we monitored the matrix effect arising from concentration mismatch among solutions by analyzing an extra standard solution with up to 15% concentration mismatch. The data reported here are obtained from analytical runs where the δ41K values from the "mismatched" standard are less than 0.05 (Ku & Jacobsen 2020).
As K solutions could be contaminated with very small amounts of Ca, we corrected for any possible Ca-related interference on mass 41 (41K), such as Ca-hydride 41(40CaH+), of both sample and standard solutions. This formation of 41(40CaH+) is also described in the literature (Moynier et al. 2021). The correction is based on monitoring the mass 40 intensity for every analytical run and is calculated using the difference in intensity (I) ratios of mass 41 and mass 39 (41I/39I) between the Ca-spiked and unspiked standard solutions:
To determine an accurate value of this correction, the Ca concentration in the spiked solution was always selected to be substantially larger than that of the sample solutions. This correction factor is then used to calculate the interference-corrected δ41K values using the following equation:
In most of our routine K isotope measurements, this correction is not significant as the measured 40Ca/39K is typically <0.001 leading to CaH corrections of <10 ppm. When the correction is significant, it may also contribute to the increase of the uncertainty of the δ41K value, as discussed in the next section.
A.2.3. Analytical Uncertainties and Precisions
We used the analytical uncertainty of 0.03‰ of the K isotope data of each sample, which was established following the experimental, chemical, and instrumental procedures used in Ku and Jacobsen (Ku & Jacobsen 2020). The within-run uncertainty of 0.03‰ is the calculated standard error (2σm) of a K standard solution that was repeatedly measured within an analytical run, and the external reproducibility of 0.027‰ is the calculated variation obtained by measuring a rock sample, BHVO-2, repeatedly on different days. The consistency between the two values implies that no additional variability of the dissolution or column chemistry was present in the data, so we used the former value as the best estimate of the analytical uncertainty for each sample.
The formation of the 41(40CaH+) species was monitored in every run and the effect on the δ41K values from the 40CaH+ interference has been corrected. The results of the measurements used for these corrections (39K/41K, 40Ca/39K, and 41CaH/40Ca) are given in Table 8. Columns (2) and (3) report the uncorrected values with uncertainty, and columns (10) and (11) list the interference-corrected δ41K values with their uncertainties expanded based on the uncertainty in the CaH corrections.
Table 8. Source Data for the CaH Corrections and Corrected δ41K Uncertainties
| (1) | (2) | (3) | (4) | (5) | (6) | (7) | (8) | (9) | (10) | (11) |
|---|---|---|---|---|---|---|---|---|---|---|
| Sample | δ41Kmeas-std | 2σm δ41K (analytical) | 39K/41K | 40Ca/39K | 41CaH/40Ca | 41CaH/41K | CaH corr. (‰) | 2σ-CaH -corr. | δ41Kcorr-std | 2σm δ41K (final) |
| Mx | −0.368 | 0.030 | 12.639 | 0.00130 | 0.000838 | 0.000014 | 0.014 | 0.004 | −0.382 | 0.034 |
| CH001 | 0.106 | 0.033 | 12.638 | 0.03526 | 0.000762 | 0.000340 | 0.340 | 0.092 | −0.234 | 0.125 |
| CH007 | −0.255 | 0.030 | 12.639 | 0.00370 | 0.000838 | 0.000039 | 0.039 | 0.011 | −0.294 | 0.041 |
| SBJ-101-A | 0.022 | 0.030 | 12.632 | 0.00755 | 0.000612 | 0.000058 | 0.058 | 0.016 | −0.036 | 0.046 |
| SBJ-101-B | 0.343 | 0.030 | 12.635 | 0.01218 | 0.000762 | 0.000117 | 0.117 | 0.032 | 0.226 | 0.062 |
| SBJ-101-C | 0.569 | 0.030 | 12.632 | 0.03459 | 0.000762 | 0.000333 | 0.333 | 0.090 | 0.236 | 0.120 |
Download table as: ASCIITypeset image
The uncertainty in such correction is generally insignificant, except for the two measurements, which have larger-than-usual measured 40Ca/39K of 0.035, yielding the total CaH corrections in δ41K values to be 0.333‰ to 0.340‰. The correction factor
is obtained by multiplying columns (4), (5), and (6) and 1000 and is given in permil in column (8). During the measurements reported here we obtained an average CaH/Ca ratio of 6.6 × 10⁻⁴ with an uncertainty of 1.8 × 10⁻⁴ (Figure 8). This gives a multiplier of 0.27 (=1.8/6.6) with column (8) to obtain the 2σ uncertainty of the CaH correction in column (9). Under normal circumstances, this CaH uncertainty would only yield a 3 ppm additional uncertainty to the δ41K values. However, in the case of large CaH corrections, it resulted in the final 2σ uncertainty of 0.120‰ (SBJ-101-C) and 0.125‰ (CH001). The final δ-values (column 10) are calculated by subtracting column (8) from column (2). The interference-corrected uncertainty is calculated by adding column (9) to column (3). Table 1 reports only these final, interference-corrected values. This is the best estimate that could be done for these samples as all of the material was consumed due to the difficulties of the K isotope measurements.
A.3. Calculation of the Initial 41Ca/40Ca from the 41Ca−41K Isochron in Figure 1
The equation for a 41Ca−41K fossil isochron is
This equation can be converted to use δ41K values by using
Thus, in this notation the fossil isochron is
The value of 41K/39K = 0.0721677 for the standard (Naumenko et al. 2013). Thus, the slope of the isochron determined in the δ41K versus 40Ca/39K diagram (slope) can be converted to give the initial (41Ca/40Ca)I ratio:
A.4. Isochron Fitting and the Mean Squared Weighted Deviation
We compare the weighted least-squares fits of our data with the NWA 3118 #1Nb (Liu 2017) using the method of Williamson (1968). The goodness of fit of the isochron (straight line) can be tested by calculating the mean squared weighted deviation (MSWD) or a mean value for chi (χ = (MSWD)1/2) (Wendt & Carl 1991). This parameter should be about 1 when the deviations of the measurements for the isochron are within the analytical error of the best-fit line. The χ factor can be used to expand the errors of the slope and intercept of the isochron. The multipliers for the Liu (2017) NWA 3118 isochron and our isochrons are ∼4 and ∼2, respectively (Table 2). Thus, our isochron based on the four CAI data points (Figure 1) gives (41Ca/40Ca)I =(2.00 ± 0.29(0.52)) × 10−8 and an intercept δ41K =−0.52 ±0.05(0.12) (2σm) with larger errors expanded by χ multiplier in parentheses. If the χ is applied, then the (41Ca/40Ca)I of Liu (2017) is no longer resolved from zero, while our results are still well resolved. We have chosen to use larger error bars (expanded with the χ multiplier) in Figures 1 and 3 as this is the most conservative approach.
A.5. Possible K Isotope Fractionation Due to Evaporation
In the main text, we argued that because the Mg and Si isotopic compositions of the CAI SJ101 show no signs of isotopic fractionation due to evaporation, this might also be the case for K isotopes. Here, we discuss this argument by considering the uncertainties of the δ25Mg, δ29Si, and δ30Si values for SJ101. The Mg and Si isotope measurements for SJ101 yielded δ25Mg = −1.30 ± 0.05, δ29Si = −0.30 ± 0.05, and δ30Si = −0.60 ± 0.08. This is the first report of these values with error bars in a text format; previously, they were shown only in diagrams (Jacobsen et al. 2007; Petaev & Jacobsen 2009). Figure 9 compares the CAI data for δ25Mg, δ29Si, and δ30Si (summarized by Petaev & Jacobsen (2009) with trends calculated based on experimental data (Mendybaev et al. 2013). The magenta line shows the calculated line based on the experimental isotope fractionation factors and relative volatilities of Mg and Si during evaporation (Mendybaev et al. 2013), using the Rayleigh fractionation equation. The trend uses SJ101 as the starting composition. The CAI data shown for comparison fit well the calculated magenta trend, except for two samples with a substantially negative δ26Mg and only slightly negative δ29Si. The samples are B29, described as a Rb-rich aggregate, and Egg5, described as nepheline- and sodalite-bearing CAI (Niederer & Papanastassiou 1984). Both of them are not well described in the literature, but they have most likely experienced substantial aqueous alteration as their brief descriptions suggest. Furthermore, it has long been known that the correlated fractionation effects in Mg and Si isotopes do not extend to Ca and Ti isotopes (Niederer & Papanastassiou 1984; Niederer et al. 1985). Clayton et al. (1988) further discussed this issue and concluded that the perfect correlations of isotopic fractionation between individual elements are not to be expected in CAIs. Because Mendybaev et al. (2013) did not include K isotopes in their experimental study, there is no self-consistent set of data to model simultaneous K, Mg, and Si isotope fractionations during CAI evaporation. A simplified approach assuming the square roots of the masses for the isotopic fractionation factors under consideration [(24/25)0.5 for 25Mg/24Mg and (39/41)0.5 for 41K/39K] yields the green line in Figure 9 (the slope for δ41K versus δ25Mg is 0.91). Using δ25Mg as the fractionation proxy for δ41K, one may estimate 0.046‰ as the maximum δ41K fractionation uncertainty, assuming SJ101 is the true unfractionated initial composition of CAIs. While these simple considerations may suggest that the effect of evaporation on δ41K is less than 0.05‰ and would not significantly affect the 41Ca–41K isochron, this should be viewed with caution, as there is too little understanding of correlated fractionation effects between different elements in CAIs. Finally, as discussed in the main text, if CH007 has suffered substantial evaporation, it should have a higher δ41K value than SJ101, not lower as observed. Evaporation described by the Rayleigh fractionation equation would also result in a nonlinear trend in the isochron diagram. Thus, there is no clear evidence that evaporation significantly affected the K isotopic composition of these CAI samples, implying that the linear CAI array in Figure 1 is most likely an isochron.