


Abstract
The soft gamma-ray repeater Swift J1555.2−5402 was discovered by means of a short burst detected with Swift BAT on 2021 June 3. Then, 1.6 hr after the burst, the Neutron star Interior Composition Explorer (NICER) started daily monitoring of this target for a month. The absorbed 2–10 keV flux stayed nearly constant at around 4 × 10⁻¹¹ erg s−1 cm−2 during the monitoring, showing only a slight gradual decline. An absorbed blackbody with a temperature of 1.1 keV approximates the soft X-ray spectrum. A 3.86 s periodicity is detected, and the period derivative is measured to be 3.05(7) × 10−11 s s−1. The soft X-ray pulse shows a single sinusoidal shape with an rms pulsed fraction that increases as a function of energy from 15% at 1.5 keV to 39% at 7 keV. The equatorial surface magnetic field, characteristic age, and spin-down luminosity are derived under the dipole field approximation to be 3.5 × 10¹⁴ G, 2.0 kyr, and 2.1 × 1034 erg s−1, respectively. We detect 5 and 45 bursts with Swift/BAT and NICER, respectively. Based on these properties, this new source is classified as a magnetar. A hard X-ray power-law component that extends up to at least 40 keV is detected with the Nuclear Spectroscopic Telescope Array (NuSTAR). The 10–60 keV flux is ∼9 × 10⁻¹² erg s−1 cm−2 with a photon index of ∼1.2. The pulsed fraction has a sharp cutoff at around 10 keV with an upper limit (≲10%) in the hard-tail band. No radio pulsations are detected during the DSN or VERA observations. The 7σ upper limits of the flux density are 0.043 and 0.026 mJy at the S and X bands, respectively.
Export citation and abstract BibTeX RIS
1. Introduction
Magnetars are highly magnetized neutron stars that are usually bright in X-rays as a result of the release of an enormous amount of magnetic energy stored in the stellar interior and the magnetosphere (Mereghetti 2008; Kaspi & Beloborodov 2017). Among them, sources emitting repetitive soft gamma-ray bursts are historically called soft gamma-ray repeaters (SGRs; e.g., Kouveliotou et al. 1998). In the last decade, systematic monitoring of magnetars in X-rays, mainly with the X-Ray Telescope (XRT) on board the Neil Gehrels Swift Observatory, revealed that many transient magnetars spend most of their time in a quiescent state with low activity. However, they occasionally exhibit a sudden X-ray brightening, where the X-ray flux reaches an initial plateau of 10−11–10−10 erg s−1 cm−2 lasting a few weeks, followed by a gradual decay over a variety of timescales (Enoto et al. 2017; Coti Zelati et al. 2018). These magnetar outbursts are characterized by enhanced persistent X-ray emission, sporadic short bursts, pulsar timing anomalies, and, rarely, giant flares. Their origin has been attributed to various mechanisms, such as the relaxation process of twisted magnetic fields, starquakes, magnetothermal evolution, and magnetic field dissipation (Thompson & Duncan 1995, 1996; Perna & Pons 2011; Beloborodov & Li 2016). Multiwavelength observations of these outbursts are essential to address a wide range of astronomical topics, as demonstrated, for example, with the discovery of fast radio bursts (FRBs) associated with a short hard X-ray burst from the Galactic magnetar SGR J1935+2154 in 2020 (Bochenek et al. 2020; CHIME/FRB Collaboration et al. 2020; Mereghetti et al. 2020; Li et al. 2021; Ridnaia et al. 2021; Tavani et al. 2021). Such a connection between magnetars and FRBs is also supported by the indication that extragalactic FRBs have the statistical signatures of magnetar short bursts (e.g., Wadiasingh & Timokhin 2019).
On 2021 June 3, a new SGR, Swift J1555.2−5402, was discovered through a short burst detection with the Burst Alert Telescope (BAT) on board Swift (Palmer et al. 2021). Immediately after the notification of the burst from this source, several X-ray satellites started follow-up observations of this magnetar candidate. These observations were promptly used to measure the spin frequency and frequency derivative (Israel et al. 2021; Ng et al. 2021; Coti Zelati et al. 2021b) and detected several short bursts (Palmer 2021). Based on the measured timing parameters and distinctive magnetar characteristics, this new source was classified as a magnetar. In addition, several radio telescopes searched for radio emission and pulsations (Bansal et al. 2021; Burgay et al. 2021; Singh & Roy 2021). In this Letter, we report on the X-ray temporal and spectral characteristics of this new magnetar observed with Swift, the Neutron star Interior Composition Explorer (NICER), and the Nuclear Spectroscopic Telescope Array (NuSTAR) during the initial 29 days of its X-ray outburst; our observations were also coordinated with radio monitoring.
The celestial position of Swift J1555.2−5402 is close to another magnetar, 1E 1547.0−5408, with an angular separation of about 0 7. The distance to 1E 1547.0−5408 is estimated to be 4–4.5 kpc from a dust-scattering halo (Tiengo et al. 2010) and a possible association with SNR G327.24−0.13 (Gelfand & Gaensler 2007). By contrast, no definitive information is available about the distance to Swift J1555.2−5402 (Section 3.5). Taking into account the fact that the column density of Swift J1555.2−5402 (NH = 8.7 × 1022 cm−2) is larger than that of 1E 1547.0−5408 (NH = 3.2 × 1022 cm−2; Enoto et al. 2010b), we assume a fiducial distance d of 10 kpc and the normalization factor d10 = d/(10 kpc) throughout this Letter. This distance corresponds to a location on the Scutum–Centaurus Arm.
2. Observation and Data Reduction
2.1. Swift
The Swift BAT (Gehrels et al. 2004) detected a burst from an unknown source at 09:45:46 UT on 2021 June 3 (trigger number 1053220) and immediately pointed to the source direction (Palmer et al. 2021). The Swift XRT (Burrows et al. 2005) obtained X-ray data in the WT mode for 62 s from 97 s after the BAT trigger and then in the PC mode for ∼1.7 ks from 1.1 hr after the burst. The XRT observations determined the source position (J2000.0) to be R.A. =15h 55m 08 66 and decl. = −54° 03' 41
 1 with an uncertainty radius of 22 at a 90% confidence level (Evans 2021). We adopt this source position for all analyses in this Letter. The BAT detected another four short bursts from the same direction, as summarized in Appendix Table B1. We analyzed the BAT data using the standard HEASoft BAT pipelines (version 6.28), following the same procedure described in Lien et al. (2016); these results are presented in Section 3.3.
We analyzed the XRT data obtained on June 3, 4, 5, and 7. The observation IDs (ObsIDs) used in this Letter are listed in Appendix Table A1. The observations on June 4, 5, and 7 were carried out in the WT mode for a total of 8.9 ks. We processed the data through the standard procedure of FTOOLS xrtpipeline with the default filtering criteria. For PC mode data, we extracted source photons from a circular region with a 20 pixel radius (1 pixel = 236) centered at the target, whereas we collected background spectra from a source-free region with a similar (20 pixel) radius located far (>2') from the source. For the one-dimensional WT mode data, we extracted the source spectra from a rectangular strip of length 40 pixels (∼94''). The background was estimated using a source-free region of a similar size located ∼2' from the source position. We used the latest available RMF file in CALDB version 20210504 and generated the ARF files with the xrtmkarf tool.
2.2. NICER
NICER (Gendreau et al. 2016), on board the International Space Station, began X-ray observations of the source at 11:21:31 UT on 2021 June 3, 1.6 hr after the first short burst detected with Swift BAT. This initial NICER observation was 2.4 ks long in exposure (ObsID 4202190101), and it was followed by high-cadence monitoring (see Appendix Table A2) carried out almost daily for 29 days under an approved Cycle 3 proposal. Each ObsID had roughly 2 ks exposure and was divided into several continuous good time intervals (GTIs) with exposures of a few hundred seconds for each.
The NICER's X-ray Timing Instrument (XTI) has 52 on-orbit active modules, each of which consists of coaligned X-ray concentrators and silicon drift detectors. The XTI has a time resolution of <100 ns, and the total effective area is about 1,800 cm2 at around 1.5 keV. We performed the standard analysis procedures using NICERDAS (version 2020-04-23_V007a) in HEASoft 6.27.2 and the NICER calibration database (version 20200722). We generated level 2 cleaned events with the nicerl2 command. For the barycentric correction, we used barycorr with Jet Propulsion Laboratory solar system development ephemeris DE405 for the source coordinates stated above (Standish 1998). For timing analyses and burst searches, we utilized all 52 active modules. For spectral studies, we further excluded module numbers 14 and 34 to avoid potential contamination by instrumental noise in the soft energy band. The background spectral model is generated using the 3C50 background model with the nibackgen3c50 command (Remillard et al. 2021). 33
2.3. NuSTAR
NuSTAR (Harrison et al. 2013) observed Swift J1555.2−5402 on June 5–6 for a 38.4 ks exposure and two additional contemporaneous observations with NICER on June 9 (25 ks) and 21 (29 ks). We processed and filtered the NuSTAR data following the standard procedures with HEASoft version 6.28 and CALDB version 20210524 using the nupipline and nuproducts commands. We extracted on-source and background spectra from circular regions of 80'' radius centered at the source position and in a source-free region, respectively. The background-subtracted source count rate of FPMA was about 1 count s−1 in the 3–79 keV band. For the spectral fitting, we grouped source spectra using the grppha tool of HEASoft, such that each spectral bin would have a minimum of 50 counts.
2.4. Deep Space Network
We carried out radio observations of Swift J1555.2−5402 for a total exposure of roughly 10.8 hr at five epochs during 2021 June 4–12 using different Deep Space Network (DSN) radio telescopes (see Table A4). Simultaneous dual-frequency bands, with center frequencies at 2.2 (S band) and 8.4 (X band) GHz, were used for all observations. We used a single circular polarization mode for DSS-34 and DSS-36, whereas a dual circular polarization mode was used at each frequency band for DSS-43.
We recorded the data in filter-bank mode with a time resolution of 512 μs and frequency resolution of 1 MHz using the pulsar machine in Canberra. The data processing procedure follows similar steps to those presented in earlier studies of pulsars and magnetars with the DSN (e.g., Majid et al. 2017; Pearlman et al. 2018, 2019). After first flattening the bandpass response in each data set, we removed the low-frequency variations in the temporal baseline of each frequency channel by subtracting the moving average from each data point with a time constant of 10 s. The sample times were then corrected to the solar system barycenter.
2.5. VERA (K Band)
The 20 m diameter Ishigaki-jima station of the VLBI Exploration of Radio Astrometry (VERA) conducted a target-of-opportunity observation of this source at an observation frequency of 22 GHz (1.3 cm, K band) with a bandwidth of 512 MHz. The acquired data for 1 hr at 14:40–15:40 UT on 2021 June 6 were processed and folded to explore radio pulsations both with and without assuming the rotation period. Because the data quality was limited due to a low elevation of the object and bad weather conditions, we could only set an upper limit of the peak flux density of 1.02 Jy (1σ).
3. Analysis and Results
3.1. X-Ray Timing Analyses
Figure 1 shows the time series of the physical parameters of Swift J1555.2−5402 during NICER monitoring for the 29 days from shortly after the onset of the outburst until July 1. In constructing the time series, we first derived the pulsar spin ephemeris, for which we used a Gaussian pulse template and constructed pulse times of arrival (TOAs) with an integration time of 300 s and a minimum exposure of 200 s contained in each bin, using the script photon_toa.py from NICERsoft.
34
The timing analysis was carried out over 2–8 keV, where the energy range was determined from a Zn
2 search with n = 2 to optimize the pulse significance (Buccheri et al. 1983). We used the Python-based package for high-precision timing analysis "PINT" (Luo et al. 2021; version 0.8.2) to compute the best timing model through a weighted least-squares fit to the TOAs. The TOAs were found to be well described by a fifth-order polynomial model, as summarized in Table 1, for the spin evolution of Swift J1555.2−5402. The best-fit frequency and its derivatives are ν = 0.258997103(8) Hz,  Hz s−1,
  Hz s−2, ν(3) = − 1.10(10) × 10−23 Hz s−3, ν(4) = 3.59(15) × 10−29 Hz s−4, and ν(5) = 1.59(14) × 10−34 Hz s−5 at barycentric epoch T0 = MJD 59,382.7549. NICER's sensitivity enables our measurement up to fifth order in frequency with TOAs of only 300 s.
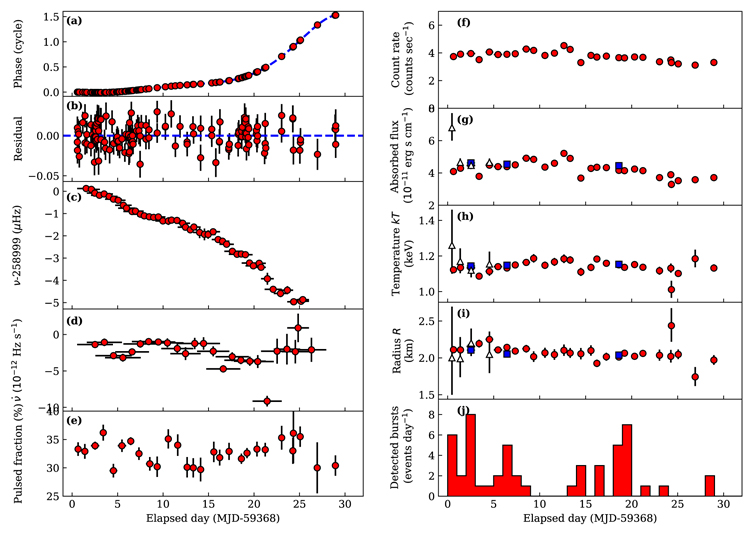
Figure 1. NICER monitoring of the timing (left panels) and spectral evolution (right panels) of the 2021 outburst of Swift J1555.2−5402 over 29 days (2021 June 3–July 1; MJD 59,368–59,396). The time origin MJD 59,368 is the day when the first burst was detected with Swift/BAT. (a) Intrinsic pulse-phase evolution with respect to a folding frequency of νfold = 0.258997274 Hz and a folding frequency derivative of  Hz s−1; the dashed line is the best-fit model with a fifth-order polynomial. (b) Phase residuals (cycles) after correcting for the spin derivatives (up to fifth order). (c) Spin frequency with 2 day windows in steps of 0.5 day. (d) Spin frequency derivative with 4 day windows in steps of 1 day. (e) The rms PF in the 3–8 keV band. (f) Background-subtracted 2–10 keV NICER count rate. (g) The 2–10 keV absorbed X-ray flux obtained with Swift (open triangles), NICER only (red circles), and NICER simultaneously fitted with NuSTAR (blue squares). The symbols are the same in panels (h) and (i). (h) Blackbody temperature (keV). (i) Emission radius of the blackbody component assuming a fiducial distance of 10 kpc. (j) Number of short bursts per day detected with NICER and Swift/BAT. Error bars are at a 68% confidence limit in these plots.
Download figure:
Standard image High-resolution imageTable 1. Summary of the Timing and Spectral Properties of Swift J1555.2−5402
| Parameter | Values | |||
|---|---|---|---|---|
| Timing Properties (NICER Monitoring) | ||||
| MJD range | 59,368.58–59,396.98 | |||
| Epoch T0 (MJD) | 59,382.7549 | |||
| Spin frequency ν (Hz) | 0.258997103(8) | |||
Frequency derivative  (10−12 Hz s−1) (10−12 Hz s−1) | −2.04(5) | |||
Second frequency derivative  (10−18 Hz s−2) (10−18 Hz s−2) | −4.50(13) | |||
| Third frequency derivative ν(3) (10−23 Hz s−3) | −1.10(10) | |||
| Fourth frequency derivative ν(4) (10−29 Hz s−4) | 3.59(15) | |||
| Fifth frequency derivative ν(5) (10−34 Hz s−5) | 1.59(14) | |||
| rms residual (phase) | 0.014 | |||
| χ2/dof | 117.863/126 | |||
| Period P (s) | 3.86104705(12) | |||
Period derivative  (10−11 s s−1) (10−11 s s−1) | 3.05(7) | |||
Second period derivative  (10−17 s s−2) (10−17 s s−2) | 6.7(2) | |||
| Third period derivative P(3) (10−22 s s−3) | 1.63(15) | |||
| Fourth period derivative P(4) (10−28 s s−4) | −5.3(2) | |||
| Fifth period derivative P(5) (10−33 s s−5) | −2.4(2) | |||
| Characteristic age τc (kyr) | 2.01(5) | |||
| Surface magnetic field Bsurf (1014 G) | 3.47(4) | |||
| Spin-down luminosity Lsd (1034 erg s−1) | 2.09(5) | |||
| Spectral Properties (NICER+NuSTAR Joint Fit) | ||||
| Joint observation numbers | 1 | 2 | 3 | Average |
| Observation date (MJD) | 59,370 | 59,374 | 59,386 | ⋯ |
| Column density NH (1022 cm−2) | 8.72(8) | 8.69(7) | ||
| Temperature kT (keV) | 1.144(4) | 1.148(4) | 1.153(4) | 1.149(3) |
| Radius R (km) | 2.10(2) | 2.05(2) | 2.04(2) | 2.06(3) |
| Photon index Γ | 1.27(12) | 1.68(17) | 1.15(0.16) | 1.35(9) |
| Absorbed 2–10 keV flux (10−12 erg s−1 cm−2) |

|

|

|

|
| Unabsorbed 2–10 keV flux (10−12 erg s−1 cm−2) | 70.60(32) | 69.39(35) | 67.80(36) | 69.5(4) |
| 10–60 keV flux (10−12 erg s−1 cm−2) | 9.32 ± 0.34 | 7.73 ± 0.35 | 8.72 ± 0.85 | 9.02 ± 0.24 |
| 2–10 keV luminosity Lx (1035 erg s−1) | 8.45 | 8.30 | 8.11 | 8.32 |
| 10–60 keV luminosity Lx (1035 erg s−1) | 1.11 | 0.93 | 1.04 | 1.08 |
| Quiescent (Swift) | ||||
| Absorbed 2–10 keV flux (10−12 erg s−1 cm−2) | <0.26 (3σ) | |||
| Unabsorbed 2–10 keV flux (10−12 erg s−1 cm−2) | <1.2 (3σ) | |||
| 2–10 keV luminosity Lx (1035 erg s−1) | <0.15 (3σ) | |||
Note. The column density of the three joint NICER and NuSTAR spectral fittings is fixed to the same value. The X-ray luminosity and radius are calculated on an assumption of a fiducial distance of 10 kpc. Quoted errors indicate the 68% confidence limit. The quiescent X-ray upper limits are derived with an assumed temperature of 0.45 keV (see the text).
Download table as: ASCIITypeset image
In Figures 2(a)–(d), we present the energy-resolved and background-subtracted pulse profiles of Swift J1555.2−5402 in the 2–3 and 3–8 keV bands with NICER and 3–8, 8–12, and 12–20 keV with NuSTAR, where estimates of the background rates were made with the nibackgen3C50 tool for the NICER data and based on the measured rate in the background region for the NuSTAR data. The soft X-ray profile (2–12 keV) shows a single-peaked, nearly sinusoidal shape, while the pulsation in the hard X-ray band (≳12 keV) was not detected. We further divided the data into finer energy bands and calculated, in Figure 2(f), the time-averaged rms pulsed fraction (PF) as defined in Bildsten et al. (1997) and Woods et al. (2004). Both the NICER and NuSTAR observations suggest that the rms PF increases from ∼30% in the softer band (3–4 keV) to a maximum of ∼40% at around 7 keV and then decreases with energy to ≲10%. We also found that the PF in the 3–8 keV range remained almost constant during the observed period (Figure 1(e)).
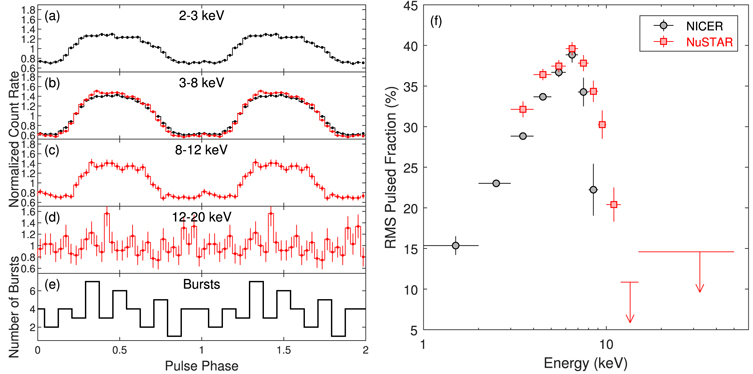
Figure 2. Panels (a)–(d) are background-subtracted X-ray pulse profiles of Swift J1555.2−5402 in the 2–3, 3–8, 8–12, and 12–20 keV bands, respectively, taken with (black) NICER and (red) NuSTAR. The amplitudes are normalized relative to the mean count rate. Two cycles are shown in this figure for clarity. Error bars indicate 1σ uncertainties. Panel (e) shows the phase distribution of short bursts. Panel (f): rms PF as a function of energy. The pulsation above 10 keV cannot be significantly seen. We estimate 2σ upper limits for the last two energy bins.
Download figure:
Standard image High-resolution image3.2. X-Ray Spectral Analyses
The right panels of Figure 1 show the long-term spectral properties of Swift J1555.2−5402 obtained with Swift, NICER, and NuSTAR data. Here we applied a single-temperature blackbody multiplied by the Tuebingen–Boulder interstellar absorption model (tbabs∗bbodyrad in Xspec terminology) to derive the physical parameters at each epoch (Wilms et al. 2000). The first data point in each of the right panels corresponds to the initial 1.7 ks Swift PC spectrum obtained ∼1.1 hr after the BAT trigger, which is well fitted with the model above (χ2 of 113 for 128 degrees of freedom, dof). We derived a best-fit hydrogen column density of  cm−2 and blackbody temperature of
  keV. The absorbed 2–10 keV flux is
  erg s−1 cm−2. This flux is significantly higher than those in the following observations with the Swift/XRT in the WT mode and NICER monitoring.
The subsequent daily NICER spectra (1.7–10 keV) were systematically fitted with the same model with the hydrogen column density tied to be the same value among all NICER spectra at NH = (8.88 ± 0.12) × 1022 cm−2. Each observation has ∼4 counts s−1 (Figure 1(f)). The reduced χ2 values were ∼0.9–1.2 for ∼100–400 dof. No spectral variation during the initial monitoring was found. The absorbed and unabsorbed 2–10 keV fluxes were ∼4.3 × 10⁻¹¹ (Figure 1(g)) and ∼7.5 × 10⁻¹¹ erg s−1 cm−2, respectively. The derived temperature and emission radius were constant at ∼1.1 keV (Figure 1(h)) and ∼2 d10 km (Figure 1(i)), respectively (Section 3.5). These NICER parameters are consistent with those obtained with the WT mode data of Swift/XRT.
We performed joint spectral fits of three observations of NICER and NuSTAR on June 5–6, 9, and 21. Since the NICER spectra showed no significant time variation, we extracted the NICER spectra for the period on the same day as NuSTAR and regarded them as simultaneous, even if their observation periods were not fully simultaneous. The column densities among the three epochs are tied to the same value. The best-fit spectral model is shown in Figure 3. In addition to the soft X-ray blackbody component, a hard X-ray component above 10 keV was detected with 3σ significance extending up to at least 40 keV. The hard X-ray flux, when fitted by the power-law model, was (7–9) × 10−12 erg s−1 cm−2 in the 10–60 keV band with a power-law photon index of 1.2–1.7. We also performed a combined fit of all three epochs, given that no significant spectral change was observed between them. The resultant average ν Fν is shown in the right panel of Figure 3 and Table 1. The ν Fν plot shows that the hard X-ray component above 10 keV exceeds the high-energy tail of the soft blackbody component.
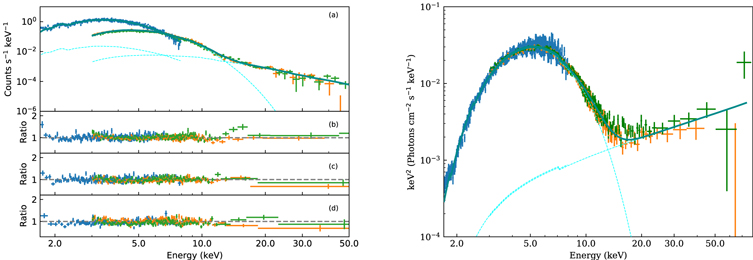
Figure 3. Left: spectral fitting of the joint NICER and NuSTAR data of Swift J1555.2−5402. Panel (a) shows the background-subtracted response-inclusive spectra obtained on June 5 and the best-fit model (dark cyan solid line) with its blackbody and power-law components (cyan dashed lines). Photoelectric absorption is not corrected. Panels (b)–(d) show spectra obtained on June 5, 9, and 21, divided by the best-fit model to the first epoch shown in panel (a). Right: best-fit ν Fν spectra of NICER and NuSTAR FPMA and FPMB for the three epochs combined. In both panels, NICER and NuSTAR FPMA and FPMB data are shown in blue, orange, and green, respectively.
Download figure:
Standard image High-resolution image3.3. Short Burst Analyses
Swift BAT detected five short bursts, as summarized in Appendix Table B1. For the first detected burst on June 3 (an onboard trigger), we used the data from T − 240 to T + 100 s, where T is the burst detection time, whereas we used the ∼3 s interval events collected through subthreshold triggers 35 in our analyses of the other bursts. The BAT event data have a time resolution of ∼100 μs (Barthelmy et al. 2005). The BAT temporal analysis utilizes light curves binned in 1, 2, and 4 ms. Our BAT spectral analysis was performed using spectra created with the T90 duration of each burst, which is the duration that covers 90% of the burst emission. All of the spectra were successfully fitted with a single blackbody model (bbodyrad model in Xspec), except for the one on June 7, the statistics of which were too poor to give meaningful constraints.
We also searched the 2–8 keV NICER event data for short bursts using the Bayesian block technique 36 (Scargle et al. 2013) and the data filtering criteria in Appendix B. The blocks with high backgrounds and durations longer than ∼1 s are further filtered out on the basis of comparison between the housekeeping data (mkf files), multiple blocks in one burst, and blocks close to the GTI boundaries. We used the Poisson probability to determine the significance of detecting a number of photons in a block, where the nonburst count rate was calculated from 1 s intervals close in time to the bursts. We identified 45 short bursts exceeding a 5σ detection significance, as summarized in Appendix Table B2. The average duration of the bursts was 23 ± 17 ms, and 13 photons were detected in a burst, on average. Note that burst 27–1 on the list occurred during the tail of burst 27, and we included it in burst 27 in the calculation.
We stacked the detected bursts to obtain an average spectrum and found it to be equally well fitted with both a single blackbody (tbabs ∗ bbodyrad) and a power-law (tbabs ∗ pegpwrlw) with Cash statistics of C-stat = 261.1 and 264.0, respectively, with 310 dof. When fixing the absorption column density at NH = 8.72 × 1022 cm−2 (Table 1), the former model gave a blackbody temperature of  keV, whereas the latter gave a photon index of 0.0 ± 0.2. Using the blackbody model, we find an average unabsorbed flux of (1.3 ± 0.1) × 10−8 erg s−1 cm−2 in the 2–8 keV range. Assuming a distance of 10 kpc, the blackbody radius is estimated to be 7.4 ± 1.6 km. The fluences of detected bursts are calculated to be in the range of (1–13) × 10−10 erg cm−2 with an assumed blackbody spectrum of kT = 2.8 keV using the WebPIMMs Appendix (Appendix Table B2). One of the NICER bursts was simultaneously detected with Swift BAT (Appendix Figure B2).
3.4. DSN Radio Analyses
We dedispersed the data of each epoch with trial Dispersion Measures (DMs) between zero and 5000 pc cm−3 and subsequently searched each resulting time series for both periodic and single-pulse emission. We found no statistically significant periods with a signal-to-noise ratio (S/N) above 7.0 after folding individual dedispersed time series modulo period candidates from PRESTO's accelsearch package (Ransom et al. 2002). In addition, we folded the dedispersed time series at each DM trial using the timing model from NICER in Table 1 but found no evidence of radio pulsations at the S or X band during any of our observations. For each epoch, we place 7σ upper limits on the magnetar's flux density, assuming a duty cycle of 10% (see Table A4). Based on our longest observation with DSS-43, the 70 m radio telescope in Tidbinbilla, Australia, we obtain 7σ upper limits on the magnetar's flux of <0.043 mJy at the S band and <0.026 mJy at the X band.
We also searched the dedispersed time series at each frequency band for radio bursts using a matched filtering algorithm, where the time series was convolved with boxcar functions with logarithmically spaced widths between 512 μs and 150 ms. Candidates with a detection S/N above 7.0 were saved and classified using the FETCH software package (Agarwal et al. 2020). The dynamic spectra of the candidates were also visually inspected for verification. We detected no radio bursts during the radio observations and placed 7σ upper limits on the fluence of individual bursts during each epoch at both the S and X bands (see Table A4). On 2021 June 5 and 6, we detected two X-ray bursts, with widths of w = 15.91 (see Table B2; burst 8) and 0.27 ms (see Table B2; burst 10), during overlapping radio and X-ray observations. However, no prompt radio emission (within ±10 s of the X-ray burst time) was detected above a 7σ fluence detection threshold of  and
and  Jy ms at the S and X bands, respectively.
3.5. Search for a Counterpart
We searched the Swift archival data for a serendipitous detection of Swift J1555.2−5402 in its quiescent state. Two observations in 2012 (ObsIDs 00042728001 and 00042729001) covered the location of this source as part of the Swift XRT Galactic plane survey program (Reynolds et al. 2013). The total exposure is 1055 s. We find no X-ray source at this position within a 30'' radius. The 3σ upper limit of the count rate is estimated to be 5.0 × 10⁻³ counts s−1 within this radius. Then, the 3σ upper limits of the 2–10 keV absorbed and absorption-corrected fluxes are calculated to be 5.0 × 10⁻¹³ and 9.0 × 10⁻¹³ erg s−1 cm−2, respectively, on the assumption of an absorbed blackbody spectrum with NH = 8.72 × 1022 cm−2 and kT = 1.1 keV. Yet the magnetar surface temperature in quiescence is considerably smaller than that during outburst epochs, with an average of about 0.45 keV among the population (Olausen & Kaspi 2014). Hence, we estimate 2–10 keV absorbed and absorption-corrected fluxes of about 2.6 × 10⁻¹³ and 1.2 × 10⁻¹² erg s−1 cm−2, respectively. This corresponds to an upper limit of the 2–10 keV quiescent X-ray luminosity of 1.5 × 1034 erg s−1 (bolometric thermal luminosity of 4.8 × 1034 erg s−1) at 10 kpc.
The characteristic age of Swift J1555.2−5402 is inferred to be 2.01 kyr (see Table 1). If we assume that its true age is comparable to its characteristic age, we expect to find a young supernova remnant (SNR) surrounding the neutron star. Detection of an associated SNR, combined with a possible proper-motion measurement, would be helpful and can be important for constraining the magnetar's true age given that the characteristic age may be unreliable due to underlying assumptions about the neutron star rotation period at the birth and braking index. Our search of archival radio, infrared, and X-ray data (e.g., Green 2019) for an SNR or a pulsar-wind nebula coinciding at the position of Swift J1555.2−5402, (l, b) = (327.872, −0.335) in the galactic coordinates using SkyView 37 fails to yield any convincing candidates.
4. Discussion and Conclusion
4.1. Timing and Spectral Characteristics of the New Magnetar
High-cadence monitoring with NICER over 1 month allows us to measure the spin ephemeris of the new source Swift J1555.2−5402 (Table 1). Refined from the initial reports in GCNs and ATels (Coti Zelati et al. 2021b; Ng et al. 2021), the period and its time derivative are measured to be 3.86104705(12) s and 3.05(7) × 10−11 s s−1, respectively. The combination of the two values falls within the distribution of known magnetars on the P– diagram (Figure 4(a)). Assuming the standard rotating magnetic dipole model and a braking index of n = 3, these timing parameters correspond to a characteristic age of τ = 2.01(5) kyr, surface magnetic field strength of Bsurf = 3.47(4) × 1014 G, and spin-down luminosity of Lsd = 2.09(5) × 1034 erg s−1. This source was classified as a magnetar based on the measured strong magnetic field. The derived characteristic age suggests that it is one of the youngest magnetars among the known ones. The suggestion is supported by the observed strong timing noise, which requires a model with high-order polynomials (Section 3.1), similar to that of the young magnetar Swift J1818.0−1607 (Hu et al. 2020). We caution that the derived pulsar parameters during the outburst may deviate from those in the quiescent state (e.g., Younes et al. 2017a; Archibald et al. 2020). Frequency derivatives are known to fluctuate during magnetar outbursts, with variations of a factor of 1–50 (see, e.g., Dib et al. 2012; Dib & Kaspi 2014; Levin et al. 2019). Thus, the accuracy of the inferred parameters
  ,
,  , and
, and  relative to the quiescent values still has uncertainties due to this
  variation.
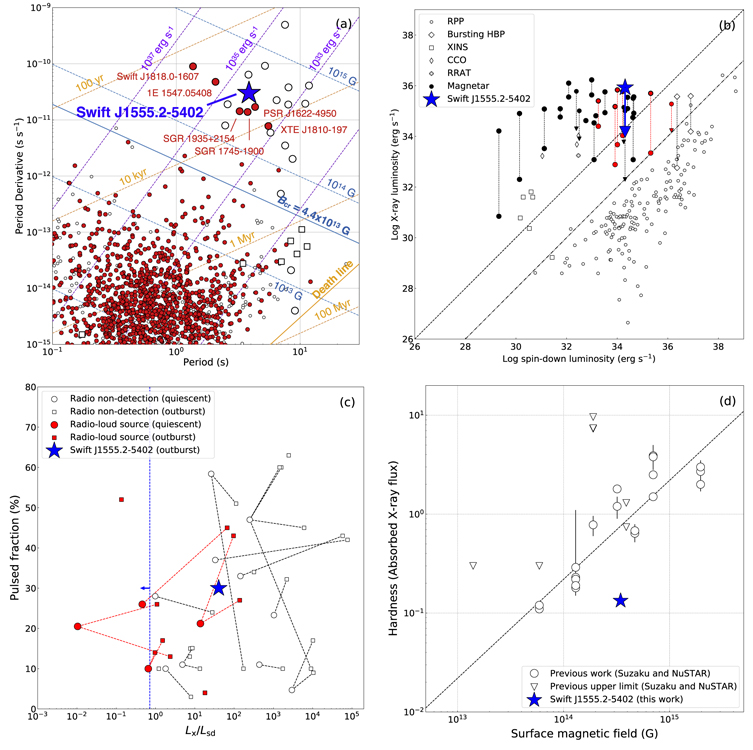
Figure 4. (a) Position of the new magnetar Swift J1555.2−5402 (star) on the P– diagram. Large and small circles indicate magnetars (from the McGill catalog; Olausen & Kaspi 2014) and canonical rotation-powered pulsars (from the ATNF catalog; Manchester et al. 2005), respectively. Filled red symbols indicate radio-emitting pulsars. The lines show constant surface magnetic field strengths, characteristic ages, and spin-down luminosities. Squares in panels (a) and (b) are X-ray-dim isolated neutron stars. (b) Observed X-ray luminosity in the soft X-ray band (including the unpulsed component) compared with the spin-down power for various types of pulsars. The peak X-ray luminosity and quiescent values of magnetars are connected via dashed lines. Red symbols indicate radio-loud magnetars. The two diagonal lines indicate where the X-ray luminosity becomes equal to 100% and 1% of the spin-down power. The values and references used in panels (b)–(d) are summarized in Appendix Tables C1 and C2 for magnetars and Enoto et al. (2019) for other pulsars. (c) The PFs as a function of the X-ray luminosity normalized by the spin-down power. Filled red symbols indicate radio-emitting magnetars. Circles and squares represent data in quiescence and during X-ray outbursts, respectively. A dashed line connects observations for the same source. The vertical dashed line with the arrow indicates the region of the quiescent state of Swift J1555.2−5402. (d) Broadband hardness ratio of absorbed X-ray fluxes between 1–10 and 15–60 keV with the best-fit correlation (Enoto et al. 2017).
Download figure:
Standard image High-resolution imageWe detect a hard X-ray tail above 10 keV with NuSTAR, extending up to at least 40 keV with 3σ significance. The spectral energy distribution shows that the hard X-ray component is distinguished from the blackbody component, which should originate from the stellar surface (Figure 3). The existence of the distinctive hard tail is further supported by the steep drop in the energy-dependent PF above 10 keV (Figure 2(f)). Two-component spectra of this kind are reported from other persistently bright and transient magnetars (Kuiper et al. 2006; Enoto et al. 2010a; Younes et al. 2017b). The lack of pulsations (PF < 10%) in the hard X-rays may suggest that the hard tail originates in magnetospheric emission that does not have much anisotropy and higher emission altitude than emission from the stellar surface. This may imply a low magnetic impact parameter (e.g., Wadiasingh et al. 2018) for the observer across the pulse for resonant Compton scattering. The 15–60 keV flux of Swift J1555.2−5402, F15−60 = 6.21 ± 0.23 × 10⁻¹² erg s−1 cm−2, is lower than the absorbed 1–10 keV flux  erg s−1 cm−2. Accordingly, the broadband hardness ratio of the magnetospheric to surface thermal emissions is η = F15−60/F1−10 = 0.13. The hardness ratio η of known magnetars (η = 0.1–4) is suggested to be correlated with the surface magnetic field. Figure 4(d) plots the η values of known sources and Swift J1555.2−5402. It shows that the η of Swift J1555.2−5402 is not largely off, though apparently smaller than, the proposed correlation (see Equation (3) of Enoto et al. 2017). We note that the measured η has some systematic uncertainty. If the yet-unknown long-term frequency derivative of Swift J1555.2−5402 is lower than the value measured during the current outburst, the magnetic field strength in the quiescent state is weaker than our estimate, which places the η of Swift J1555.2−5402 closer to the known correlation.
4.2. X-Ray Luminosity
Figure 4(b) compares pulsar X-ray luminosity Lx with spin-down luminosity Lsd. Immediately after the outburst, the surface emission (2–10 keV) and total (2–60 keV) luminosity of Swift J1555.2−5402 were  and
and  erg s−1, respectively. At the assumed distance of 10 kpc, these are, respectively, 40 and 46 times larger than its spin-down luminosity Lsd = 2.1 × 1034 erg s−1. The observed X-ray luminosity is similar to those of past reported outbursts of transient magnetars. The upper limit on the quiescent X-ray luminosity of Swift J1555.2−5402 is
  , corresponding to
  , which is still up to 2−3 orders of magnitude higher than those of the rotation-powered pulsars (see Figure 4(b) and Figure 12 of Enoto et al. 2019). The upper limit on the quiescent bolometric thermal luminosity
  erg s−1 also makes Swift J1555.2−5402 one of the coolest young magnetars (see, e.g., Potekhin et al. 2015) and is compatible with the L ∼ 2 × 1033 erg s−1 of PSR J1119−6127 (Gonzalez et al. 2005; Ng et al. 2012; Blumer et al. 2021). The upper limit on the quiescent bolometric thermal luminosity
  erg s−1 erg s−1 is compatible with L ∼ 2 × 1033 erg s−1 of PSR J1119−6127 (Gonzalez et al. 2005; Ng et al. 2012; Blumer et al. 2021) and could mean that Swift J1555.2−5402 is one of the cooler young magnetars (see, e.g., Potekhin et al.2015).
4.3. Peculiarities of the Slow Decline Outburst
The persistent X-ray flux of most transient magnetars remains in a bright plateau state for a few weeks immediately after the onset of outbursts and then starts to fade over the next several months (Coti Zelati et al. 2018). Typically, the plateau duration and decaying slope are τ0 = 11–43 days and p ∼ 0.7–2 (Enoto et al. 2017), respectively, when the X-ray flux Fx is fitted with an empirical formula  , where t and F0 are the elapsed time and plateau flux, respectively. A peculiarity of Swift J1555.2−5402 is its long-lasting outburst. The absorbed X-ray flux stayed nearly stable at around 4 × 10⁻¹¹ erg s−1 cm−2 with only a slow decline over a month. There was no apparent rollover of the flux trend as of July 1. Such long-lasting outbursts are rare for magnetars, with only a few exceptions ever recorded, e.g., the radio-loud magnetar 1E 1547.0−5408.
Another peculiarity of the Swift J1555.2−5402 outburst is the higher temperature (kT ∼ 1.1 keV) of the blackbody component than the typical value of known magnetars, kT ∼ 0.3–0.7 keV (Enoto et al. 2017), despite the surface emission radius R ∼ 2d10 km of Swift J1555.2−5402 being well within the typical range for a neutron star. During the 1 month observation, the slow flux decline originated from the decreasing emission radius rather than the temperature decline. This fact suggests a situation where the hot spot on the neutron star surface responsible for the X-ray emission was shrinking, which is consistent with the twisted magnetosphere model (Kaspi & Beloborodov 2017).
We detected 45 and 5 short bursts with NICER and Swift/BAT, respectively, during the initial 2 weeks since discovery of Swift J1555.2−5402 (Figure 1(j)). The burst-active periods of persistently bright magnetars (e.g., SGR 1806−20) are known to be longer (≳100 days) than those (≲10 days) of low-burst rate transient ones (e.g., SGR 0501+4516; Göǧüş 2014). The burst-active period of Swift J1555.2−5402 is close to the latter case. We conjecture that repeated bursts as observed in Swift J1555.2−5402 would provide impulsive heating of the surface to sustain the long-lasting decay. To investigate the potential relationship between the bursts and persistent emission on the pulse profile, we plot in Figure 2(e) the phase distribution of the observed bursts. An Anderson–Darling (AD) test suggests that the burst phase distribution differs from a uniform distribution with an AD statistic of 0.42 and corresponding p-value of 0.82. Thus, there is neither a statistical difference between the phase distribution of the bursts and uniform distribution nor a statistically significant correlation between the burst occurrence and the pulse profile so far.
4.4. Comparison with Radio-emitting Magnetars
We did not detect any radio emission from this source. It has been long established theoretically that as far as ordinary pulsars are concerned, the occurrence of rotation-powered polar-cap radio emission requires a sufficiently large potential drop ΔΦ to generate electron-positron pairs near polar caps (Goldreich & Julian 1969; Sturrock 1971; Ruderman & Sutherland 1975; Arons & Scharlemann 1979); note that the conventional definition of  implies that radio emission is equivalently related to Lsd (Ho 2013). The observed radio luminosity of rotation-powered pulsars indeed follows the relation (e.g., Arzoumanian et al. 2002). In the absence of magnetically induced nonpotential fields, magnetars that satisfy this condition at their polar caps before crossing the death line should, in principle, be capable of producing coherent radio emission. However, as shown in Figures 4(a)–(c) and summarized in Appendix Table C1, pulsed radio emission has only been reported from six radio-loud magnetars and a high-B pulsar that exhibited a magnetar-like outburst. It is an open question under what conditions a magnetar becomes radio-loud. The new magnetar Swift J1555.2−5402 is located in the P–
 parameter space close to radio-loud magnetars (Figure 4(a)). The DSN upper limits on the radio luminosity (
 erg s−1 for the S band and
  erg s−1 for the X band) would be much lower than those of the known radio-loud magnetars, ν
Lν
∼ (0.08–1) × 1030 and ∼(0.01–3) × 1031 erg s−1 at the S and X bands, respectively (Camilo et al. 2007a, 2007b, 2008; Levin et al. 2010, 2012; Shannon & Johnston 2013; Pennucci et al. 2015; Huang et al. 2021). Therefore, the lack of radio emission suggests the existence of some other physical factors than simply P and
erg s−1 for the X band) would be much lower than those of the known radio-loud magnetars, ν
Lν
∼ (0.08–1) × 1030 and ∼(0.01–3) × 1031 erg s−1 at the S and X bands, respectively (Camilo et al. 2007a, 2007b, 2008; Levin et al. 2010, 2012; Shannon & Johnston 2013; Pennucci et al. 2015; Huang et al. 2021). Therefore, the lack of radio emission suggests the existence of some other physical factors than simply P and  that govern radio emission.
One crucial factor is the geometry among the pulsar rotation axis, magnetic axis, line of sight to the observer, and width of any putative radio beam. For example, an anisotropic radio beam aligned to the magnetic axis must cross the line of sight to be detected, and longer-period rotation-powered pulsars tend to have narrower beams (e.g., Lyne & Manchester 1988; Rankin 1993). The radio nondetection of Swift J1555.2−5402 might suggest that this magnetar may not have a favorable geometry for detection (e.g., Lazarus et al. 2012). Some radio-loud magnetars have observational signatures that suggest aligned rotators (i.e., the angle between the magnetic axis and rotation axis is ≲30°; Camilo et al. 2008; Levin et al. 2012; Lower et al. 2020). As shown in Figure 4(c), the PF both in quiescence and during X-ray outbursts of radio-loud magnetars is lower than that of the other magnetars. A low PF could be due to radio-loud magnetars being observed as near-aligned rotators. The same interpretation can be inferred from the systematic Fourier-decomposition study of X-ray profiles of magnetars in quiescence conducted by Hu et al. (2019); radio-loud magnetars have a more sinusoidal pulse profile with a pronounced first Fourier component accompanied by a weaker second component. Another factor for the radio emission is the effects of higher-order (and possibly not curl-free) magnetic field components other than the dipolar field inferred from P– , which has already been taken into account. Quantum electrodynamic effects affect the conditions for pair cascades and radio emission when a magnetic field is sufficiently strong, above 1013 G. For example, if photon splitting occurs in a region above the critical magnetic field, the way the electron/positron cascade occurs is modified and perhaps quenched, and radio pulsation may be suppressed (e.g., Baring & Harding 2001). Finally, magnetar magnetospheres are considered to be dynamic, and the radio flux, pulse profile, and polarization swing pattern can change significantly within a few days (e.g., Lower et al. 2021). Future monitoring of this new magnetar, Swift J1555.2−5402, will be important for understanding the conditions for the magnetar radio emission.
The authors are grateful to the NICER, NuSTAR, Swift, and DSN scheduling and operation teams. We thank Francesco Coti Zelati, Alice Borghese, Nanda Rea, Gian Luca Israel, and Paolo Esposito for helpful discussion about the initial observation and for preparing the GCN reports. We also acknowledge Alice Borghese for her request of the Swift observation at the earliest phase of the outburst. We thank Mareki Honma, Takaaki Jike, Aya Yamauchi, Toshio Terasawa, and Tomoya Hirota for useful comments on the VERA observation and all the staff of Mizusawa VLBI Observatory of NAOJ for operating the VERA array. T.E. and S.K. are supported by JSPS/MEXT KAKENHI grant Nos. 17K18776, 18H04584, 18H01246, 19K14712, and 21H01078. A.B.P. is a McGill Space Institute (MSI) Fellow and a Fonds de Recherche du Quebec—Nature et Technologies (FRQNT) postdoctoral fellow. W.C.G.H. acknowledges support through grant 80NSSC20K0278 from NASA. NICER research at NRL is supported by NASA. W.A.M. is grateful to the DSN scheduling team and the Canberra Deep Space Communication Complex (CDSCC) staff for scheduling and carrying out the radio observations with the DSN. A portion of this research was performed at the Jet Propulsion Laboratory, California Institute of Technology, under a Research and Technology Development Grant through a contract with the National Aeronautics and Space Administration. U.S. government sponsorship is acknowledged.
Facilities: NICER - , NuSTAR - , Swift - , DSN - , VERA. -
Software: HEAsoft (v6.27.2; NASA High Energy Astrophysics Science Archive Research Center (HEASARC), 2014), astropy (Astropy Collaboration et al. 2013; Price-Whelan et al. 2018), PRESTO (Ransom et al. 2002), FETCH (Agarwal et al. 2020), PINT (v0.8.2; Luo et al. 2021), XSPEC (Arnaud 1996), NICERDAS (v2020-04-23_V007a).
Appendix A: List of Observations
Tables A1–A4 summarize the observations of Swift, NICER, NuSTAR, and DSN, respectively, conducted for this campaign as of July 1.
Table A1. A List of Swift ObsIDs of Swift J1555.2−5402
| No. | ObsID | Mode | Start Time | End Time | MJD | Elapsed | Exposure | Rate |
|---|---|---|---|---|---|---|---|---|
| (UTC) | (UTC) | Days | (s) | (cps) | ||||
| 1 | 01053220000 | PC | 2021-06-03T09:46:24 | 2021-06-03T11:21:33 | 59,368.463 | 0.06 | 1706 | 0.69 ± 0.06 |
| 2 | 00014352001 | WT | 2021-06-04T7:50:02 | 2021-06-04T9:37:00 | 59,369.364 | 1.0 | 1965 | 0.52 ± 0.02 |
| 3 | 00014352002 | WT | 2021-06-05T10:40:43 | 2021-06-05T15:46:23 | 59,370.551 | 2.1 | 4895 | 0.51 ± 0.02 |
| 4 | 00014352003 | WT | 2021-06-07T12:06:00 | 2021-06-07T13:49:00 | 59,372.540 | 4.1 | 1940 | 0.53 ± 0.02 |
Note. MJD: middle of the start and end time of an observation. Elapsed days: elapsed days from the first short burst at MJD 59,368.40678 detected with Swift/BAT. Rate: background-subtracted 2–10 keV count rate of Swift.
Download table as: ASCIITypeset image
Table A2. A List of NICER ObsIDs of Swift J1555.2−5402
| No. | ObsID | Start Time | End Time | MJD | Elapsed | Exposure | Rate |
|---|---|---|---|---|---|---|---|
| (UTC) | (UTC) | Days | (s) | (cps) | |||
| 1 | 4202190101 | 2021-06-03T11:21:31 | 2021-06-03T18:52:20 | 59,368.630 | 0.2 | 2367 | 3.74 |
| 2 | 4560010101 | 2021-06-04T04:00:20 | 2021-06-04T14:54:24 | 59,369.394 | 1.0 | 2201 | 3.91 |
| 3 | 4560010102 | 2021-06-05T01:25:40 | 2021-06-05T23:32:00 | 59,370.520 | 2.1 | 7235 | 3.96 |
| 4 | 4560010103 | 2021-06-06T02:31:20 | 2021-06-06T17:31:40 | 59,371.418 | 3.0 | 2068 | 3.52 |
| 5 | 4560010104 | 2021-06-07T02:42:51 | 2021-06-07T23:00:40 | 59,372.536 | 4.1 | 2199 | 4.07 |
| 6 | 4560010105 | 2021-06-08T00:24:27 | 2021-06-08T22:16:20 | 59,373.472 | 5.1 | 2931 | 3.88 |
| 7 | 4560010201 | 2021-06-09T04:16:47 | 2021-06-09T16:53:20 | 59,374.441 | 6.0 | 6070 | 3.9 |
| 8 | 4560010202 | 2021-06-10T01:56:20 | 2021-06-10T14:36:20 | 59,375.345 | 6.9 | 2582 | 3.94 |
| 9 | 4560010301 | 2021-06-11T02:43:40 | 2021-06-11T23:10:00 | 59,376.539 | 8.1 | 1852 | 4.28 |
| 10 | 4560010601 | 2021-06-12T08:11:19 | 2021-06-12T08:27:40 | 59,377.347 | 8.9 | 910 | 4.18 |
| 11 | 4560010401 | 2021-06-13T05:52:25 | 2021-06-13T21:38:20 | 59,378.573 | 10.2 | 988 | 3.82 |
| 12 | 4560010402 | 2021-06-14T08:12:26 | 2021-06-14T20:52:40 | 59,379.606 | 11.2 | 915 | 3.99 |
| 13 | 4560010501 | 2021-06-15T15:11:28 | 2021-06-15T15:28:00 | 59,380.639 | 12.2 | 909 | 4.53 |
| 14 | 4560010502 | 2021-06-16T06:41:09 | 2021-06-16T08:24:28 | 59,381.314 | 12.9 | 1085 | 4.25 |
| 15 | 4560010602 | 2021-06-17T02:49:31 | 2021-06-17T20:08:40 | 59,382.479 | 14.1 | 911 | 3.3 |
| 16 | 4560010603 | 2021-06-18T08:15:34 | 2021-06-18T19:22:40 | 59,383.576 | 15.2 | 998 | 3.82 |
| 17 | 4560010701 | 2021-06-19T04:24:22 | 2021-06-19T06:09:08 | 59,384.220 | 15.8 | 1575 | 3.7 |
| 18 | 4560010702 | 2021-06-20T05:10:51 | 2021-06-20T06:54:08 | 59,385.252 | 16.8 | 1472 | 3.77 |
| 19 | 4560010801 | 2021-06-21T05:58:08 | 2021-06-21T23:17:20 | 59,386.610 | 18.2 | 3756 | 3.66 |
| 20 | 4560010802 | 2021-06-22T00:33:27 | 2021-06-22T10:08:00 | 59,387.223 | 18.8 | 4545 | 3.64 |
| 21 | 4560010901 | 2021-06-23T05:59:25 | 2021-06-23T09:17:56 | 59,388.319 | 19.9 | 1979 | 3.71 |
| 22 | 4560010902 | 2021-06-24T03:41:05 | 2021-06-24T07:01:43 | 59,389.223 | 20.8 | 2307 | 3.68 |
| 23 | 4560011001 | 2021-06-26T00:34:00 | 2021-06-26T00:53:20 | 59,391.030 | 22.6 | 902 | 3.36 |
| 24 | 4560011002 | 2021-06-27T06:05:15 | 2021-06-27T06:19:40 | 59,392.259 | 23.9 | 663 | 3.49 |
| 25 | 4560011101 | 2021-06-27T07:38:15 | 2021-06-27T07:44:28 | 59,392.320 | 23.9 | 176 | 3.3 |
| 26 | 4560011102 | 2021-06-28T00:41:00 | 2021-06-28T02:28:20 | 59,393.066 | 24.7 | 1271 | 3.21 |
| 27 | 4560011201 | 2021-06-29T20:04:42 | 2021-06-29T23:20:24 | 59,394.905 | 26.5 | 367 | 3.12 |
| 28 | 4560011301 | 2021-07-01T21:35:48 | 2021-07-01T23:25:19 | 59,396.938 | 28.5 | 1237 | 3.31 |
Note. MJD: middle of the start and end time of an observation. Elapsed days: elapsed days from the first short burst at MJD 59,368.40678 detected with Swift/BAT. Rate: background-subtracted 2–10 keV count rate of NICER.
Download table as: ASCIITypeset image
Table A3. A List of NuSTAR ObsIDs of Swift J1555.2−5402
| No. | ObsID | Start Time | End Time | MJD Start | Exposure | Rate A | Rate B |
|---|---|---|---|---|---|---|---|
| (UTC) | (UTC) | (ks) | (cps) | (cps) | |||
| 1 | 90701319002 | 2021-06-05T10:20:48 | 2021-06-06T06:33:07 | 59,370.43111111 | 38.4 | 1.12 | 1.03 |
| 2 | 80702313002 | 2021-06-09T05:39:00 | 2021-06-09T18:00:00 | 59,374.23541667 | 25.0 | 1.09 | 1.025 |
| 3 | 80702313004 | 2021-06-21T14:05:11 | 2021-06-22T04:15:00 | 59,386.58693287 | 28.9 | 0.99 | 0.94 |
Note. Rates A and B are the 3–79 keV count rate of NuSTAR FPMA and FPMB, respectively.
Download table as: ASCIITypeset image
Table A4. A List of Radio Observations of Swift J1555.2−5402 with the DSN
| No. | Instrument | Observation | Observation | Duration | Observing | Mean Flux Density b | Radio Burst Fluence c |
|---|---|---|---|---|---|---|---|
| Start Time | Start Time | Frequency Band a | ( / / ) ) | ( / / ) ) | |||
| (UTC) | (MJD) | (hr) | (mJy/mJy) | (Jy ms/Jy ms) | |||
| 1 | DSN (DSS-36) | 2021 Jun 4 06:59:02 | 59,369.29099 | 1.3 | S band/X band | <0.27/<0.10 | <1.7/<0.7 |
| 2 | DSN (DSS-36) | 2021 Jun 5 11:46:10 | 59,370.49039 | 2.4 | S band/X band | <0.18/<0.07 | <1.6/<0.61 |
| 3 | DSN (DSS-43) | 2021 Jun 6 04:49:06 | 59,371.20076 | 2.2 | S band/X band | <0.042/<0.025 | <0.35/<0.21 |
| 4 | DSN (DSS-34) | 2021 Jun 10 11:31:12 | 59,375.48000 | 2.4 | S band/X band | <0.20/<0.11 | <1.7/<0.9 |
| 5 | DSN (DSS-43) | 2021 Jun 12 04:08:52 | 59,377.17282 | 2.5 | S band/X band | <0.043/<0.026 | <0.39/<0.24 |
Notes. The first two observations (2021 June 4 and 5) and the fourth observation (2021 June 10) were carried out using DSS-36 and DSS-34, two 34 m diameter radio telescopes in Canberra, Australia, whereas the remaining observations (2021 June 6, and 12) were carried out using DSS-43, the 70 m diameter dish in Canberra.
a The center frequencies at the S/X bands are 2.2/8.4 GHz, respectively. b The 7σ upper limits on the mean flux density in each radio frequency band, assuming a 10% duty cycle. The uncertainties on the mean flux density upper limits are estimated at 15%, primarily due to the uncertainty in the system temperature. c The 7σ upper limits on the radio burst fluence in each radio frequency band, assuming a burst width of 1 ms. The uncertainties on the fluence detection thresholds are estimated at 15%, primarily due to the uncertainty in the system temperature.Download table as: ASCIITypeset image
Appendix B: Burst Analyses
Tables B1 and B2 summarize the detected magnetar short bursts by Swift/BAT and NICER, respectively. For the burst search, we recalibrate the event files using nicerl2 with criteria of elv=30 br_earth=30 underonly_range=0--300 overonly_range=0--2 overonly_expr=''2.0'' to maximize the time coverage. The corresponding integrated fluence distribution detected with NICER is shown in Figure B1. It shows a power law–like distribution with a low-fluence turnover, which may be caused by the detection limit of NICER. We fit the tail and found a power-law index of −1.5 ± 0.2. The uncertainty is estimated from 104 times of Monte Carlo simulations. In each run, we simulate 45 bursts, and the number of photons of each burst is simulated from Poisson-distributed noise with a mean value the same as the observed one. Then we rebin the distribution and obtain the power-law index with data points with a fluence higher than 2 × 10⁻¹⁰ erg cm−2.
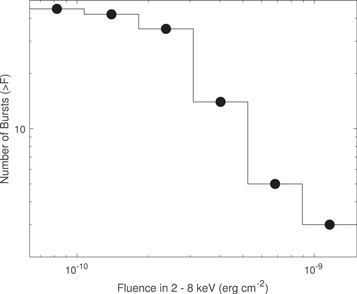
Figure B1. Integrated fluence distribution in 2–8 keV of the detected short bursts from Swift J1555.2−5402 obtained with NICER.
Download figure:
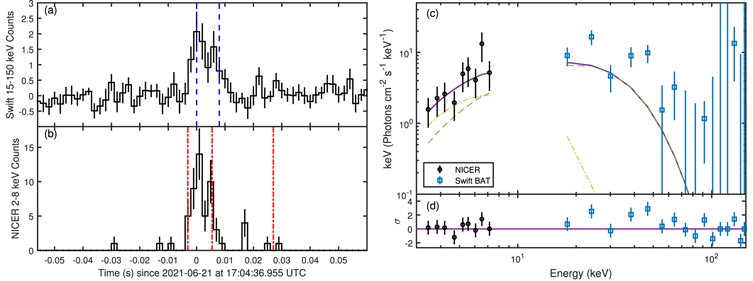
Standard image High-resolution imageA burst (burst number 5 in Table B1 and 32 in Table B2) is simultaneously detected with Swift BAT and NICER. The light curves of this simultaneous event are shown in Figure B2(a) and (b). We extracted the broadband X-ray spectrum and fit it with an absorbed power law and set NH = 8.72 × 1022 cm−2 (see Figures B2(c) and (d)). The spectrum can be fitted by two blackbodies, although the normalization cannot be well constrained. The soft one has a temperature of  keV, which is set to be 0.37 times the temperature of the hard component (Nakagawa et al. 2009). On the other hand, the spectrum can also be well fitted by an absorbed blackbody with kT = 5.3 ± 0.8 keV and a radius of 7.0 ± 1.6 km at 10 kpc.
Figure B2. Light curves of a burst detected simultaneously with (a) Swift BAT in 15–150 keV, burst number 5 in Table B1, and (b) NICER in 2–8 keV, numbers 32 and 33 in Table B2. The bin size of the light curves is 2 ms. Blue dashed lines denote the start and end of T90 of the Swift light curve, where the red dashed–dotted lines are the boundaries of Bayesian blocks detected with NICER events. The broadband X-ray spectrum of this burst is shown in panel (c), with the best-fit model (purple solid line) consisting of two blackbodies (orange dashed–dotted line and green dashed line). The residuals are shown in panel (d).
Download figure:
Standard image High-resolution image
Table B1. A List of Short Bursts from Swift J1555.2−5402 Detected with Swift/BAT
| No. | Trigger ID | Time | Duration | S/N | kT | Fluence | χ2 |
|---|---|---|---|---|---|---|---|
| (UTC) | T90 (ms) | (keV) | |||||
| 1 | 1053220 | 2021-06-03T09:45:46.589 | 12 ± 2.8 | 9.9 | 6.66 ± 0.98 | 9.09 ± 2.32 | 33.98 |
| 2 | 1053653 | 2021-06-05T23:52:04.582 | 14 ± 4.5 | 7.3 | 8.53 ± 1.40 | 7.47 ± 2.62 | 28.54 |
| 3 | 1053961 | 2021-06-07T12:33:40.020 | 4 ± 2.2 | 5.0 | N/A a | N/A a | N/A a |
| 4 | 1056025 | 2021-06-16T14:44:30.489 | 7 ± 2.8 | 6.9 | 6.58 ± 2.22 | <3.08 | 31.20 |
| 5 | 1057131 | 2021-06-21T17:04:36.839 | 12 ± 4.5 | 6.9 | 6.47 ± 2.03 | <3.82 | 55.54 |
Notes. Reported errors are 90% confidence for each parameter. Time: burst detection time (UTC) determined as the start time of T90. S/N: Signal-to-noise ratio of the BAT image in 15–350 keV. kT: blackbody temperature (keV) when fitted by the single blackbody model. Fluence: burst fluence in the 15–150 keV band (10−9 erg cm−2). χ2: fitting χ2 values for 57 dof.
a Burst 3 is too weak to constrain the spectral-fit parameters.Download table as: ASCIITypeset image
Table B2. A List of Short Bursts from Swift J1555.2−5402 Detected with NICER
| No. | ObsID | Time | Duration | Significance | Phase | Fluence |
|---|---|---|---|---|---|---|
| (UTC) | (ms) | σ | ||||
| 1 | 4202190101 | 2021-06-03T13:51:09.341 | 14.94 | 8.80 | 0.085 | 2.6 ± 0.8 |
| 2 | 4202190101 | 2021-06-03T13:51:27.181 | 59.18 | 6.38 | 0.711 | 2.4 ± 0.8 |
| 3 | 4202190101 | 2021-06-03T13:54:40.275 | 19.79 | 15.47 | 0.717 | 6.3 ± 1.3 |
| 4 | 4202190101 | 2021-06-03T14:01:50.242 | 12.95 | 6.75 | 0.076 | 1.9 ± 0.7 |
| 5 | 4202190101 | 2021-06-03T18:49:06.251 | 35.90 | 6.35 | 0.166 | 1.9 ± 0.7 |
| 6 | 4560010101 | 2021-06-04T14:37:30.785 | 18.43 | 6.91 | 0.874 | 1.9 ± 0.7 |
| 7 | 4560010101 | 2021-06-04T14:43:50.878 | 15.12 | 11.32 | 0.316 | 4.0 ± 1.0 |
| 8 | 4560010102 | 2021-06-05T05:57:03.457 | 49.87 | 6.19 | 0.449 | 2.1 ± 0.7 |
| 9 a | 4560010102 | 2021-06-05T13:55:42.156 | 15.91 | 5.67 | 0.504 | 1.3 ± 0.6 |
| 10 | 4560010102 | 2021-06-05T15:42:02.189 | 14.03 | 6.67 | 0.910 | 1.9 ± 0.7 |
| 11 | 4560010102 | 2021-06-05T15:43:00.342 | 16.03 | 7.43 | 0.971 | 1.9 ± 0.7 |
| 12 | 4560010102 | 2021-06-05T17:12:27.003 | 1.35 | 5.50 | 0.919 | 0.8 ± 0.5 |
| 13 | 4560010102 | 2021-06-05T21:55:06.519 | 98.82 | 6.41 | 0.391 | 2.6 ± 0.8 |
| 14 | 4560010102 | 2021-06-05T23:31:46.102 | 34.26 | 6.50 | 0.454 | 2.4 ± 0.8 |
| 15 b | 4560010103 | 2021-06-06T05:36:42.18 | 0.27 | 10.62 | 0.523 | 2.1 ± 0.7 |
| 16 | 4560010105 | 2021-06-08T11:19:42.895 | 9.55 | 7.63 | 0.285 | 1.9 ± 0.7 |
| 17 | 4560010105 | 2021-06-08T11:23:17.712 | 3.20 | 5.95 | 0.922 | 1.1 ± 0.5 |
| 18 | 4560010201 | 2021-06-09T05:51:19.191 | 19.64 | 10.85 | 0.299 | 4.2 ± 1.1 |
| 19 | 4560010201 | 2021-06-09T07:24:11.030 | 7.34 | 6.13 | 0.375 | 1.3 ± 0.6 |
| 20 | 4560010201 | 2021-06-09T10:34:21.954 | 7.21 | 6.50 | 0.747 | 1.3 ± 0.6 |
| 21 | 4560010201 | 2021-06-09T13:41:17.195 | 25.52 | 8.77 | 0.438 | 3.2 ± 0.9 |
| 22 | 4560010201 | 2021-06-09T13:42:48.797 | 19.87 | 6.18 | 0.162 | 1.6 ± 0.6 |
| 23 | 4560010202 | 2021-06-10T02:00:03.424 | 14.08 | 6.89 | 0.687 | 1.9 ± 0.7 |
| 24 | 4560010202 | 2021-06-10T05:05:18.924 | 21.26 | 6.24 | 0.540 | 1.9 ± 0.7 |
| 25 | 4560010301 | 2021-06-11T10:39:52.520 | 6.94 | 6.11 | 0.570 | 1.3 ± 0.6 |
| 26 | 4560010602 | 2021-06-17T02:51:59.547 | 6.71 | 16.58 | 0.542 | 6.6 ± 1.3 |
| 27 | 4560010602 | 2021-06-17T02:53:19.142 | 54.05 | 19.37 | 0.162 | 13.2 ± 1.9 |
| 28 | 4560010602 | 2021-06-17T02:59:19.487 | 72.30 | 7.00 | 0.493 | 2.6 ± 0.8 |
| 29 | 4560010701 | 2021-06-19T04:33:05.105 | 7.04 | 7.19 | 0.028 | 1.6 ± 0.6 |
| 30 | 4560010701 | 2021-06-19T04:40:15.346 | 7.71 | 7.19 | 0.457 | 1.9 ± 0.7 |
| 31 | 4560010701 | 2021-06-19T06:07:18.896 | 23.03 | 9.82 | 0.305 | 3.4 ± 1.0 |
| 32 c | 4560010801 | 2021-06-21T17:04:36.952 | 8.54 | 20.58 | 0.664 | 10.8 ± 1.7 |
| 32-1 d | 4560010801 | 2021-06-21T17:04:36.960 | 21.55 | 6.25 | 0.668 | 2.6 ± 0.8 |
| 33 | 4560010801 | 2021-06-21T23:05:26.979 | 17.84 | 6.39 | 0.767 | 1.6 ± 0.6 |
| 34 | 4560010801 | 2021-06-21T23:06:53.759 | 35.45 | 8.78 | 0.244 | 3.2 ± 0.9 |
| 35 | 4560010802 | 2021-06-22T00:35:18.974 | 12.50 | 8.94 | 0.228 | 2.4 ± 0.8 |
| 36 | 4560010802 | 2021-06-22T00:45:29.330 | 15.47 | 8.55 | 0.307 | 2.6 ± 0.8 |
| 37 | 4560010802 | 2021-06-22T02:20:44.171 | 32.71 | 8.16 | 0.385 | 2.9 ± 0.9 |
| 38 | 4560010802 | 2021-06-22T03:55:16.474 | 30.36 | 10.37 | 0.445 | 4.0 ± 1.0 |
| 39 | 4560010802 | 2021-06-22T08:26:59.567 | 6.15 | 12.71 | 0.746 | 4.0 ± 1.0 |
| 40 | 4560010802 | 2021-06-22T08:29:34.911 | 49.79 | 19.15 | 0.984 | 10.6 ± 1.7 |
| 41 | 4560010802 | 2021-06-22T10:00:07.220 | 15.05 | 8.79 | 0.882 | 2.6 ± 0.8 |
| 42 | 4560010902 | 2021-06-24T06:50:27.424 | 5.97 | 5.68 | 0.654 | 1.1 ± 0.5 |
| 43 | 4560011001 | 2021-06-26T00:52:34.199 | 12.48 | 9.24 | 0.167 | 2.6 ± 0.8 |
| 44 | 4560011301 | 2021-07-01T21:40:50.682 | 211.22 | 7.86 | 0.284 | 4.0 pm 1.0 |
| 45 | 4560011301 | 2021-07-01T23:21:28.122 | 5.28 | 12.89 | 0.860 | 4.2 ± 1.1 |
Notes. Time: burst detection time (UTC) determined as the start time of the Bayesian block. Duration: duration between two consecutive Bayesian blocks. Significance: detection significance of the burst from Poisson-distributed noise. Fluence: burst fluence in the 2–8 keV band (10−10 erg cm−2) estimated from the number of photons and assuming a blackbody spectrum with kT = 2.8 keV. The uncertainty is simply calculated from the Poisson noise, i.e., the square root of the number of photons.
a This burst was simultaneously observed with the second observation of DSN (Table A4). b This burst was simultaneously observed with the third observation of DSN (Table A4). c This burst was simultaneously observed with Swift BAT (burst 5 in Table B1). d This candidate is the tail of burst 27.Download table as: ASCIITypeset image
Appendix C: Comparison with Previous Magnetar Outbursts
Tables C1 and C2 summarize the properties of previous magnetar outbursts.
Table C1. A List of X-Ray Outbursts of Radio-loud Transient Magnetars
| Source | State | Lx | Lsd | Distance | PF | Energy | References |
|---|---|---|---|---|---|---|---|
| (erg s−1) | (erg s−1) | (kpc) | (keV) | ||||
| 1E 1547.0−5408 | Quiescent | 2.2 × 1033 | 2.11 × 1035 | 4.5 | 0.205 | 0.5–2 | 1, 2 |
| Outburst (2008) | 2.3 × 1035 | 0.26 | 0.5–10 | 1, 3 | |||
| Outburst (2009) | 5.0 × 1035 | 0.13 | 0.5–3 | 1, 4 | |||
| XTE J1810−197 | Quiescent | 2.5 × 1034 | 1.80 × 1033 | 3.5 | 0.212 | 0.5–2 | 1, 2 |
| Outburst (2003) | 1.7 × 1035 | 0.43 | 1–1.5 | 1, 5 | |||
| Outburst (2018) | 2.5 × 1035 | 0.27 | 0.5–2 | 6, 7 | |||
| PSR J1622−4950 | Quiescent | < 7.7 × 1032 | 8.27 × 1033 | 9 | 8 | ||
| Outburst (2017) | 1.5 × 1035 | 0.04 | 0.3–6 | 8 | |||
| SGR 1745−1900 | Quiescent | 4.7 × 1033 | 1.02 × 1034 | 8.3 | 0.26 | 0.5–7 | 2, 9 |
| Outburst (2013) | 6.8 × 1035 | 0.45 | 0.3–3.5 | 1, 10 | |||
| Swift J1818.0−1607 | Quiescent | < 1.7 × 1034 | 1.40 × 1036 | 6.5 | 11 | ||
| Outburst (2020) | 1.9 × 1035 | 0.52 | 1–3 | 11, 12 | |||
| SGR 1935+2154 | Quiescent | 1.1 × 1034 | 1.65 × 1034 | 9 | 0.1 | 0.5–2 | 2, 13 |
| Outburst (2014) | 2.5 × 1034 | 0.17 | 0.5–1.5 | 1, 14 | |||
| Outburst (2020) | 1.6 × 1034 | 0.14 | 0.7–3 | 13, 15 | |||
| PSR J1119−6127 | Quiescent | 5.7 × 1032 | 2.33 × 1036 | 8.4 | 0.74 | 0.5–2 | 1, 16 |
| Outburst (2016) | 3.7 × 1035 | 0.67 | 0.7–3 | 1, 17 |
Note. Lx: observed X-ray luminosity (0.3–10 keV) assuming the distance in the right column. Lsd: spin-down luminosity. PF: X-ray PF defined in the energy band in the right column.
References. 1. Coti Zelati et al. (2018); 2. Hu et al. (2019); 3. Israel et al. (2010); 4. Bernardini et al. (2011); 5. Gotthelf et al. (2004); 6. Pearlman et al. (2020); 7. Borghese et al. (2021); 8. Camilo et al. (2018); 9. Rea et al. (2020); 10. Coti Zelati et al. (2015); 11. Hu et al. (2020); 12. Esposito et al. (2020); 13. Borghese et al. (2020); 14. Israel et al. (2016); 15. Göğüş et al. (2020); 16. Gonzalez et al. (2005); 17. Archibald et al. (2018).
Download table as: ASCIITypeset image
Table C2. A List of X-Ray Outbursts of Radio-quiet Transient Magnetars
| Source | State | Lx | Lsd | Distance | PF | Energy | References |
|---|---|---|---|---|---|---|---|
| (erg s−1) | (erg s−1) | (kpc) | (keV) | ||||
| Swift J1555.2−5402 | Outburst (2021) | 9.7 × 1035 | 1.82 × 1034 | 10 | 0.15 | 1–2 | This work |
| SGR 0418+5729 | Quiescent | 7.0 × 1030 | 2.11 × 1029 | 2 | 0.37 | 0.5–2 | 1, 2 |
| Outburst (2009) | 1.6 × 1034 | 0.42 | 1.5–2.5 | 1, 3 | |||
| SGR 0501+4516 | Quiescent | 1.2 × 1033 | 1.22 × 1033 | 1.5 | 0.28 | 0.5–2 | 1, 2 |
| Outburst (2008) | 3.4 × 1034 | 0.24 | 0.3–2 | 1, 4 | |||
| 1E 1048.1−5937 | Quiescent | 8.6 × 1034 | 3.29 × 1033 | 9 | 0.584 | 0.5–2 | 1, 2 |
| Outburst (2011) | 5.7 × 1035 | 0.10 | 1–10 | 1, 5 | |||
| Outburst (2016) | 3.7 × 1035 | 0.51 | 3–7 | 1, 6 | |||
| CXOU J164710.2−455216 | Quiescent | 3.3 × 1033 | 1.32 × 1031 | 4 | 0.47 | 0.5–2 | 1, 2 |
| Outburst (2006) | 1.2 × 1035 | 0.10 | 0.5–4 | 1, 7 | |||
| Outburst (2011) | 2.1 × 1034 | 0.60 | 0.5–4 | 1, 7 | |||
| Outburst (2017) | 1.9 × 1034 | 0.60 | 0.3–2.5 | 8 | |||
| Outburst (2018) | 8.0 × 1034 | 0.45 | 0.3–2.5 | 8 | |||
| SGR 1806−20 | Quiescent | 8.2 × 1034 | 4.54 × 1034 | 8.7 | 0.1 | 0.5–4 | 1, 2 |
| Outburst (2004) | 3.6 × 1035 | 0.03 | 2–10 | 1, 9 | |||
| Swift J1822.3−1606 | Quiescent | 2.0 × 1032 | 1.38 × 1030 | 1.6 | 0.33 | 0.5–2 | 1, 2 |
| Outburst (2011) | 8.0 × 1034 | 0.43 | 2–8 | 1, 10 | |||
| 1E 2259+586 | Quiescent | 5.8 × 1034 | 5.61 × 1031 | 3.2 | 0.233 | 0.5–2 | 1, 2 |
| Outburst (2002) | 1.2 × 1035 | 0.322 | 0.1–2 | 1, 11 | |||
| SGR 1627−41 | Quiescent | 1.2 × 1033 | 4.29 × 1034 | 11 | 1 | ||
| Outburst (1998) | 5.2 × 1034 | 0.10 | 0.1–10 | 1, 12 | |||
| Outburst (2008) | 3.2 × 1035 | 0.13 | 2–10 | 1, 13 | |||
| SGR 1833−0832 | Quiescent | < 8.0 × 1033 | 3.18 × 1032 | 10 | 1 | ||
| Outburst (2010) | 1.0 × 1035 | 0.34 | 0.2–4 | 1, 14 | |||
| Swift J1834.9−0846 | Quiescent | < 2.0 × 1032 | 2.05 × 1034 | 4.2 | 1 | ||
| Outburst (2011) | 1.0 × 1035 | 0.85 | 2–10 | 1, 15 | |||
| SGR 1830−0645 | Quiescent | < 2.0 × 1034 | 2.44 × 1032 | 10 | 16 | ||
| Outburst (2020) | 6.0 × 1035 | 0.63 | 0.3–2 | 16 | |||
| SGR 1900+14 | Quiescent | 1.3 × 1035 | 2.58 × 1034 | 12.5 | 0.11 | 0.5–2 | 1, 2 |
| Outburst (2001) | 3.5 × 1035 | 0.10 | 0.8–6.5 | 1, 17 | |||
| Outburst (2006) | 2.4 × 1035 | 0.151 | 0.8–4 | 1, 18 | |||
| 1E 1841−045 | Quiescent | 4.3 × 1035 | 9.84 × 1032 | 8.5 | 0.11 | 0.5–2 | 1, 2 |
| Outburst (2011) | 1.7 × 1036 | 0.10 | 0.5–2 | 1, 19 | |||
| 4U 0142+61 | Quiescent | 3.6 × 1035 | 1.21 × 1032 | 3.6 | 0.047 | 0.5–2 | 1, 2 |
| Outburst (2011) | 1.2 × 1036 | 0.17 | 0.7–10 | 1, 20 | |||
| Outburst (2015) | 1.3 × 1036 | 0.09 | 0.7–10 | 1, 20 |
Note. Definitions of the columns are the same as in Table C1.
References. 1. Coti Zelati et al. (2018); 2. Hu et al. (2019); 3. Esposito et al. (2010); 4. Göǧüş et al. (2010b); 5. Archibald et al. (2015); 6. Archibald et al. (2020); 7. Rodríguez Castillo et al. (2014); 8. Borghese et al. (2019); 9. Woods et al. (2007); 10. Livingstone et al. (2011); 11. Zhu et al. (2008); 12. Woods et al. (1999); 13. Esposito et al. (2009); 14. Göǧüş et al. (2010a); 15. Kargaltsev et al. (2012); 16. Coti Zelati et al. (2021a); 17. Göǧüş et al. (2011); 18. Mereghetti et al. (2006); 19. An et al. (2013); 20. Archibald et al. (2017).
Download table as: ASCIITypeset image
Footnotes
- 33
- 34
- 35
These are also called failed triggers, which are detections that pass the rate trigger criteria but fail the image detection threshold.
- 36
- 37