


Abstract
We report NanoSIMS Si and Mg–Al isotopic data (and C, N, and Ti isotopic data, when available) for 85 submicron- to micron-sized presolar SiC grains from the CM2 Murchison meteorite, including 60 mainstream (MS), 8 AB1, 8 X, 7 AB2, and 2 Y grains. The MS and Y grain data demonstrate that (1) C and N contamination mainly appears as surface contamination, and sufficient presputtering is needed to expose a clean grain surface for obtaining intrinsic C and N signals, and (2) Mg and Al contamination appears as adjacent grains and rims, and high-resolution imaging and the choice of small regions of interest during data reduction together are effective in suppressing the contamination. Our results strongly indicate that previous studies of presolar SiC grains could have sampled differing degrees of contamination for C, N, Mg, and Al. Compared to the literature data, our new MS and Y grains are in better agreement with carbon star observations for both the C and N isotopic ratios. By comparing our new, tighter distributions of 12C/13C, 14N/15N, and initial 26Al/27Al ratios for MS and Y grains with FRUITY low-mass asymptotic giant branch (AGB) stellar models, we provide more stringent constraints on the occurrence of cool bottom processing and the production of 26Al in N-type carbon stars, which are classical AGB stars.
Export citation and abstract BibTeX RIS
1. Introduction
Presolar grains are microscopic solids that condensed around different types of stars at their advanced evolutionary stages before the formation of the solar system. As stellar condensates, presolar grains preserve a detailed record of nucleosynthesis and mixing processes in their parent stars and thus grant us the possibility of deriving a detailed picture of these stellar processes, if we can determine the types of stars they came from. Silicon carbide (SiC) is the best-studied presolar mineral phase. There are multiple pieces of evidence that the majority of presolar SiC grains condensed from carbon stars. For instance, presolar SiC grains show a 12C/13C ratio distribution similar to that of carbon stars (Zinner 2014), SiC grains are predicted to condense in C-rich stellar environments according to thermodynamic equilibrium calculations (Lodders & Fegley 1995), and SiC dust has also been observed to be ubiquitous in circumstellar envelopes around C-rich asymptotic giant branch (AGB) stars (e.g., Little-Marenin 1986; Chan & Kwok 1990; Yang et al. 2004). Presolar SiC grains were originally divided into five main groups (≥1% of the population), including mainstream (MS), X, Y, Z, and AB. MS grains were defined as SiC grains having 10 ⪅ 12C/13C < 100 and δ29Si 7 and δ30Si correlating with a slope of ∼1.35. In comparison, Y and Z grains have Si isotopic compositions deviating from the linear correlation observed for MS grains toward larger 30Si enrichments relative to 29Si, with the deviations larger for Z grains than for Y grains. In addition, while MS and Z grains overlap in their C and N isotopic compositions, Y grains were defined to have 12C/13C ≥100. AB grains have low 12C/13C ratios (⪅10) and a similar range of Si isotopic compositions as MS grains but exhibit a wider range of 14N/15N ratios. Finally, X grains are characterized by large 15N and 28Si excesses and a wide range of 12C/13C ratios (see Zinner 2014 for a review). These classifications were based on C, N, and Si isotopic ratios mainly because, as the most abundant elements in the grains, they are the easiest to measure, and these elements thus dominate the existing isotope database for presolar SiC. In fact, interpreting the C, N, and Si isotopic compositions of presolar SiC in the context of stellar nucleosynthesis is quite complex. Thus, linking the different groups to different types of carbon stars has proven to be quite a challenge (e.g., Zinner et al. 2006, 2007). Boujibar et al. (2021; hereafter B21) recently assessed the existing classification scheme by applying the technique of cluster analysis, and their results highlight the importance of 14N/15N and the inferred initial 26Al/27Al ratios (hereafter 26Al/27Al, determined from 26Mg excesses) to presolar SiC grain classification and the need for more multielement isotopic data for more accurate classification.
Multielement isotopic data for individual presolar SiC grains are limited. There are only ∼100 MS grains with both 14N/15N and 26Al/27Al (<50% errors) in the Presolar Grain Database (PGD; Hynes & Gyngard 2009; Stephan et al. 2021), although >10,000 MS SiC grains have been examined for their isotopic compositions. Moreover, asteroidal and terrestrial contamination complicates the data interpretation. Although the wide range of 14N/15N ratios observed in MS grains may provide important constraints on astrophysical processes, it is possible that some or all of this large range is simply caused by differing amounts of N contamination sampled during laboratory analyses. Furthermore, evidence that Al contamination strongly affected 26Al/27Al data in the literature was presented by Groopman et al. (2015). For the case of some trace-element measurements, e.g., Sr and Ba, special cleaning procedures have been developed (e.g., Liu et al. 2015), but similar methods have not been applied to studies of important elements like N, Mg, and Al.
In this study, we examined the problem of contamination by adopting two approaches. For C, N, and Si isotopes, we conducted NanoSIMS analyses on the same grains after (i) minimal presputtering (a few seconds to minutes of sputtering for the Si count rate to reach equilibrium) and (ii) extensive presputtering for comparison (see Appendix A for details), which enabled us to determine the source and degree of contamination for these elements. For Mg–Al, Ca–Ti, and Ti–V isotopic systematics, we used an RF plasma primary ion source, the Hyperion (Oregon Physics, LLC), which produces an O– beam of reduced size compared to previous duoplasmatron ion sources (Malherbe et al. 2016). The improved spatial resolution enabled us to suppress contamination from the surrounding substrate for these elements.
2. Results
All of the isotopic data were collected with the Cameca NanoSIMS 50L instrument at the Carnegie Institution in imaging mode; the analytical details are given in Appendix A. We obtained Si and Mg–Al isotopic data for all 85 grains investigated (Tables 1 and A1) and Ti isotopic data for 35 of the grains (Table A1). Prior to these isotopic analyses using the Hyperion O– source, we used a Cs+ ion source to obtain C, N, and Si isotopic ratios (hereafter pre-Hyperion data) for all AB and X grains 8 and 25 of the MS and Y grains. For 47 of the MS and Y grains, we also collected their C and N isotopic data after the Hyperion analyses on the remaining grains (hereafter post-Hyperion data). The C and N isotopic ratios and 26Al/27Al are reported as absolute ratios, while the Mg, Si, and Ti isotopic ratios are reported in δ notation, defined as δiA = ((iA/jA)grain/(iA/jA)standard–1) × 1000, in which (iA/jA)grain and (iA/jA)standard denote the measured ratios of a grain and standard, respectively; the normalizing isotopes for Mg, Si, and Ti are 24Mg, 28Si, and 48Ti, respectively. All data are reported with 1σ errors.
A comparison of the pre-Hyperion, post-Hyperion, and PGD data (PGD_SiC_2021-01-10; Stephan et al. 2021) for MS, Y, and Z grains is given in Figure 1. We chose these three types of grains for comparison because MS grains are the dominant type (Zinner 2014), and the three types are all inferred to have come from low-mass AGB stars given their comparable s-process Mo isotopic signatures (Liu et al. 2019). Figure 1(a) shows that (1) the PGD data have a distribution (in gray-scale color map) that peaks at 12C/13C ≈ 50–55 and 14N/15N ≈ 500, (2) our pre-Hyperion data for 25 MS and Y grains (Table A1) overlap with the PGD data (our average 12C/13C = 59.5, 14N/15N = 756), and (3) the post-Hyperion data for the same grains (Table 1) show significantly enhanced 14N/15N ratios, with the average being shifted upward to ∼2000. The significant increase in 14N/15N between the pre- and post-Hyperion data suggests that N contamination was present across the whole grain surface during the pre-Hyperion measurements, which could not be effectively suppressed even by selecting small regions of interest (ROIs) with low N within the grain 9 during the data reduction; instead, extensive sputtering was needed to expose clean grain surfaces for obtaining intrinsic N signals. Differences in 12C/13C between the pre- and post-Hyperion data are overall small; the averages are 59.5 and 56.7, respectively. The probability distribution of our 47 MS and Y grains (post-Hyperion data in Table 1) is shown in Figure 1(b) for comparison with the PGD data in Figure 1(a). Given its absence in our post-Hyperion data, the secondary peak at 12C/13C ≈ 90 and terrestrial/solar-like 14N/15N ratios for the PGD data are most likely the result of significant asteroidal/terrestrial contamination.
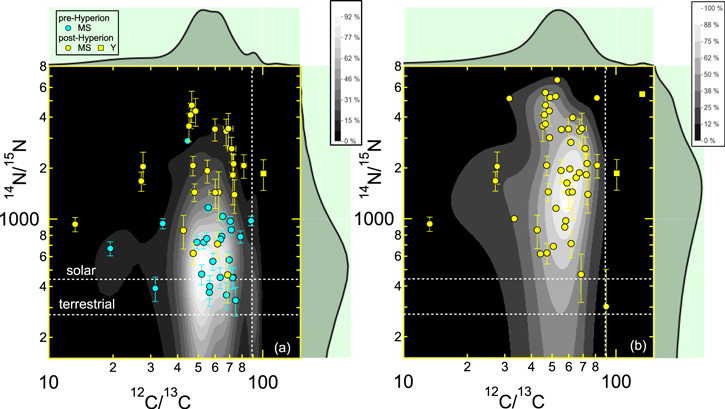
Figure 1. Plots of 14N/15N versus 12C/13C. (a) The pre- and post-Hyperion data for 25 MS and Y grains from this study are compared to the probability distribution (in gray-scale color map) of MS, Y, and Z grain data (1σ errors <2 for 12C/13C and <10% for 14N/15N) from the literature (PGD_SiC_2021-01-10). (b) The post-Hyperion data for our 47 MS and Y grains (Table 1) are overlaid on their probability distribution (in gray-scale color map). Unless otherwise noted, dashed lines represent terrestrial values.
Download figure:
Standard image High-resolution imageTable 1. NanoSIMS Isotope Data of Presolar SiC Grains a
| Grain | Type | Size (μm) | 12C/13C b | 14N/15N | δ29Si (‰) | δ30Si (‰) | δ25Mg (‰) | δ26Mg (‰) | 26Al/27Al (×10−3) | Mg/Si c (×10−4) | Al/24Mg |
|---|---|---|---|---|---|---|---|---|---|---|---|
| M1-A3-G203 | MS | 0.92 | 61.5 ± 1.4 | 713 ± 125 | 25 ± 16 | 55 ± 11 | 111 ± 102 | 148 ± 99 | 1.68 | 7 | |
| M1-A3-G220 | MS | 0.93 | 68.5 ± 1.9 | 468 ± 149 | 27 ± 19 | 6 ± 16 | −42 ± 42 | 934 ± 60 | 3.70 ± 0.21 | 1.83 | 25 |
| M1-A3-G226 | MS | 0.69 | 47.3 ± 1.1 | 627 ± 87 | −13 ± 17 | −14 ± 15 | 143 ± 546 | 4513 ± 1412 | 0.84 ± 0.20 | 0.10 | 519 |
| M1-A3-G243 | MS | 1.33 | 67.4 ± 1.7 | 3309 ± 590 | 37 ± 15 | 64 ± 9 | 270 ± 250 | 7713 ± 881 | 1.47 ± 0.11 | 0.24 | 511 |
| M1-A3-G277 | MS | 1.22 | 59.8 ± 1.5 | 3400 ± 508 | 76 ± 18 | 77 ± 13 | 928 ± 480 | 75,462 ± 8776 | 1.13 ± 0.04 | 0.04 | 6475 |
| M1-A3-G338 | MS | 1.26 | 45.2 ± 1.1 | 3539 ± 674 | 47 ± 18 | 49 ± 14 | 39 ± 152 | 13,469 ± 876 | 1.13 ± 0.04 | 0.20 | 1156 |
| M1-A4-G476-1 | MS | 0.47 | 69.1 ± 3.6 | 3425 ± 790 | 106 ± 18 | 67 ± 14 | −118 ± 179 | 6847 ± 693 | 0.58 ± 0.04 | 0.86 | 1141 |
| M1-A4-G476-2 | MS | 0.46 | 71.6 ± 3.2 | 2602 ± 438 | 124 ± 21 | 67 ± 23 | 306 ± 352 | 18,982 ± 2352 | 0.59 ± 0.04 | 0.24 | 3298 |
| M1-A4-G508 | MS | 1.06 | 13.3 ± 0.3 | 932 ± 91 | −32 ± 15 | −10 ± 10 | 449 ± 251 | 24,358 ± 2471 | 2.38 ± 0.11 | 0.10 | 995 |
| M1-A4-G612 | MS | 0.75 | 73.7 ± 2.0 | 1394 ± 314 | 50 ± 17 | 40 ± 13 | 18 ± 289 | 4782 ± 824 | 0.97 ± 0.12 | 1.43 | 479 |
| M1-A5-G657 | MS | 0.76 | 62.3 ± 1.5 | 1441 ± 457 | 47 ± 16 | 41 ± 11 | 4714 ± 3346 | 26,566 ± 11,692 | 1.49 ± 0.30 | 0.02 | 1735 |
| M1-A5-G662 | Y | 0.70 | 100.8 ± 3.2 | 1858 ± 382 | 16 ± 11 | 28 ± 8 | 321 ± 350 | 58,676 ± 14,120 | 1.02 ± 0.08 | 0.13 | 5567 |
| M1-A5-G754 | AB1 | 0.71 | 3.4 ± 0.1 | 271 ± 12 | 3 ± 16 | 3 ± 12 | 228 ± 95 | 22,121 ± 747 | 4.84 ± 0.04 | 0.53 | 1954 |
| M1-A5-G950 | MS | 0.56 | 46.6 ± 1.5 | 4702 ± 987 | 100 ± 17 | 95 ± 12 | 67 ± 803 | 10,435 ± 3764 | 0.89 ± 0.20 | 0.07 | 1145 |
| M1-A5-G953 | MS | 0.74 | 81.5 ± 2.5 | 2072 ± 331 | −5 ± 17 | 13 ± 14 | 259 ± 147 | 162 ± 106 | 0.22 | 37 | |
| M1-A5-G960 | MS | 0.9 | 48.5 ± 1.2 | 4353 ± 815 | −35 ± 15 | 16 ± 10 | 379 ± 668 | 25,616 ± 5567 | 2.74 ± 0.27 | 0.03 | 909 |
| M1-A5-G1147 | MS | 0.41 | 60.0 ± 3.8 | 1436 ± 284 | 72 ± 17 | 66 ± 11 | 1154 ± 917 | 12,194 ± 3213 | 0.73 ± 0.11 | 0.14 | 1623 |
| M1-A5-G1205 | X | 0.51 | 106.8 ± 1.4 | 55 ± 2 | −185 ± 27 | −323 ± 25 | 246 ± 201 | 121,222 ± 7209 | 94.89 ± 1.47 | 2.58 | 573 |
| M1-A5-G1211 | MS | 0.78 | 46.0 ± 1.2 | 4120 ± 703 | 42 ± 18 | 44 ± 15 | 208 ± 458 | 51,320 ± 7662 | 1.03 ± 0.05 | 0.07 | 4858 |
| M1-A5-G1216 | MS | 0.96 | 72.5 ± 2.4 | 1824 ± 609 | 21 ± 17 | 16 ± 13 | −127 ± 108 | 700 ± 151 | 1.12 ± 0.21 | 0.38 | 61 |
| M1-A5-G1381 | MS | 1.19 | 73.1 ± 1.9 | 2122 ± 276 | 17 ± 16 | 17 ± 11 | 24 ± 57 | 280 ± 62 | 1.70 ± 0.35 | 0.75 | 16 |
| M1-A6-G096 | MS | 1.04 | 55.1 ± 1.6 | 1930 ± 298 | −29 ± 18 | −12 ± 16 | 1455 ± 540 | 543 ± 390 | 0.08 | 108 | |
| M1-A6-G099 | MS | 0.88 | 47.2 ± 1.2 | 2071 ± 272 | 90 ± 18 | 91 ± 14 | 311 ± 316 | 37,194 ± 3768 | 1.96 ± 0.08 | 0.10 | 1840 |
| M1-A6-G106-1 | MS | 1.05 | 42.6 ± 1.2 | 858 ± 193 | −15 ± 19 | 8 ± 17 | −217 ± 193 | 2962 ± 489 | 3.83 ± 0.51 | 0.15 | 75 |
| M1-A6-G106-2 | MS | 0.67 | 27.1 ± 0.7 | 1679 ± 220 | 16 ± 26 | 0 ± 28 | 1000 ± 845 | 234 ± 465 | 0.10 | 14 | |
| M1-A6-G313 | AB1 | 0.36 | 10.0 ± 0.1 | 441 ± 42 | −57 ± 55 | −20 ± 71 | 19 ± 128 | 5016 ± 364 | 2.38 ± 0.12 | 2.36 | 1142 |
| M1-A6-G428 | MS | 0.75 | 27.6 ± 0.7 | 2045 ± 439 | 114 ± 17 | 105 ± 12 | 1999 ± 1753 | 31,558 ± 8474 | 1.10 ± 0.13 | 0.04 | 2799 |
| M1-A6-G501 | AB2 | 0.54 | 7.2 ± 0.1 | 2945 ± 404 | 43 ± 23 | 65 ± 24 | 510 ± 545 | 18,814 ± 3187 | 0.90 ± 0.05 | 0.35 | 9779 |
| M1-A6-G506 | AB2 | 0.30 | 9.7 ± 0.1 | 526 ± 50 | 2 ± 31 | −1 ± 36 | −84 ± 103 | 508 ± 126 | 1.49 ± 0.09 | 17.00 | 151 |
| M1-A6-G594 | AB1 | 0.48 | 4.4 ± 0.1 | 252 ± 15 | 89 ± 32 | 68 ± 35 | −28 ± 75 | 8424 ± 316 | 5.67 ± 0.09 | 4.61 | 704 |
| M1-A6-G605 | MS | 0.65 | 48.0 ± 1.7 | 1441 ± 170 | 122 ± 20 | 97 ± 16 | 318 ± 380 | 3120 ± 739 | 1.23 ± 0.23 | 0.41 | 247 |
| M1-A9-G509 | AB2 | 0.83 | 9.4 ± 0.1 | 926 ± 111 | −67 ± 36 | −61 ± 44 | 170 ± 197 | 10,650 ± 859 | 12.95 ± 0.18 | 1.17 | 404 |
| M1-A9-G1012 | X | 0.44 | 103.2 ± 0.9 | 43 ± 1 | −196 ± 17 | −350 ± 13 | 76 ± 75 | 103,865 ± 2705 | 271.60 ± 2.37 | 21.26 | 190 |
| M2-A2-G152 | AB2 | 0.26 | 6.4 ± 0.1 | 708 ± 94 | 23 ± 49 | −13 ± 59 | −191 ± 845 | 263,678 ± 80,933 | 2.36 ± 0.09 | 0.02 | 48,053 |
| M2-A2-G621 | AB1 | 0.42 | 6.1 ± 0.1 | 387 ± 56 | −13 ± 32 | 39 ± 39 | 482 ± 925 | 51,306 ± 13,166 | 3.43 ± 0.25 | 0.04 | 7760 |
| M2-A2-G820 | X | 0.52 | 220.0 ± 7.8 | −274 ± 11 | −393 ± 13 | 96 ± 62 | 39,824 ± 921 | 205.37 ± 1.79 | 65.71 | 89 | |
| M2-A2-G992 | X | 0.56 | 283.0 ± 15.3 | −339 ± 15 | −566 ± 16 | 172 ± 178 | 308,361 ± 16,534 | 134.70 ± 1.07 | 6.02 | 699 | |
| M2-A2-G1129 | AB2 | 0.38 | 8.8 ± 0.2 | 1146 ± 94 | 199 ± 9 | 142 ± 10 | −134 ± 234 | 88,402 ± 7546 | 2.31 ± 0.06 | 0.12 | 18,614 |
| M2-A4-G1510 | X | 0.48 | 170.4 ± 4.9 | −298 ± 10 | −432 ± 12 | 76 ± 158 | 1,225,817 ± 60,657 | 331.50 ± 1.59 | 1.31 | 1617 | |
| M3-G324 | X | 0.59 | 169.7 ± 2.0 | 56 ± 1 | −230 ± 8 | −159 ± 9 | −123 ± 129 | 16,357 ± 926 | 39.03 ± 0.19 | 4.00 | 182 |
| M3-G398 | AB1 | 0.43 | 4.3 ± 0.1 | 382 ± 14 | −38 ± 8 | −7 ± 8 | 89 ± 85 | 24,542 ± 787 | 73.95 ± 1.20 | 7.26 | 386 |
| M3-G472 | AB1 | 0.61 | 4.2 ± 0.1 | 436 ± 65 | 35 ± 15 | 47 ± 18 | −40 ± 94 | 135,628 ± 4517 | 37.64 ± 0.26 | 1.99 | 1707 |
| M3-G1154 | AB2 | 0.44 | 5.0 ± 0.2 | 523 ± 37 | 11 ± 10 | 58 ± 10 | −121 ± 97 | 344 ± 113 | 0.64 ± 0.03 | 1.38 | 301 |
| M3-G1507 | AB2 | 0.47 | 10.0 ± 0.1 | 1503 ± 79 | −34 ± 8 | −13 ± 10 | 145 ± 195 | 27,229 ± 1841 | 2.06 ± 0.03 | 0.34 | 5428 |
| M3-G1607 | AB1 | 0.45 | 4.7 ± 0.1 | 354 ± 9 | 39 ± 10 | 18 ± 13 | −25 ± 119 | 11,600 ± 618 | 2.37 ± 0.05 | 2.48 | 2248 |
| M4-A1-1 | MS* d | 2.95 | 106 ± 20 | 96 ± 29 | −288 ± 371 | 200 ± 168 | 0.01 | 18 | |||
| M4-A1-2 | MS* | 1.17 | 147 ± 21 | 107 ± 29 | 129 ± 364 | 619 ± 891 | 0.04 | 85 | |||
| M4-A1-5 | MS* | 1.26 | −42 ± 17 | 13 ± 27 | −91 ± 117 | 65 ± 128 | 0.06 | 5 | |||
| M4-A1-6 | MS* | 0.84 | 91 ± 20 | 63 ± 28 | −203 ± 174 | 5081 ± 484 | 2.03 ± 0.14 | 0.10 | 452 | ||
| M4-A2-1 | MS* | 1.36 | 68 ± 20 | 73 ± 28 | −302 ± 188 | 15,723 ± 1030 | 1.21 ± 0.04 | 0.09 | 2344 | ||
| M4-A2-2 | MS | 1.24 | 65.0 ± 0.3 | 1752 ± 8 | 74 ± 20 | 80 ± 28 | −210 ± 313 | 30,069 ± 3955 | 2.06 ± 0.12 | 0.02 | 2637 |
| M4-A2-3 | MS | 1.15 | 55.4 ± 0.4 | 3369 ± 24 | 41 ± 19 | 90 ± 29 | −448 ± 181 | 11,551 ± 2586 | 1.03 ± 0.14 | 0.03 | 2021 |
| M4-A2-4 | X | 1.73 | −301 ± 13 | −471 ± 14 | −162 ± 164 | 10,846,858 ± 2,058,167 | 627.86 ± 1.25 | 0.08 | 3106 | ||
| M4-A2-5 | MS* | 1.02 | 24 ± 19 | 55 ± 28 | 32 ± 50 | 181 ± 82 | 1.27 | 20 | |||
| M4-A3-3 | Y | 1.10 | 132.8 ± 1.5 | 5466 ± 49 | 21 ± 19 | 47 ± 28 | −42 ± 97 | 1792 ± 466 | 0.90 ± 0.20 | 0.27 | 359 |
| M4-A3-4 | MS* | 1.44 | 17 ± 19 | 29 ± 27 | 78 ± 98 | 11,984 ± 646 | 1.53 ± 0.05 | 0.10 | 1409 | ||
| M4-A4-1 | MS | 1.10 | 67.2 ± 0.4 | 1872 ± 25 | 54 ± 19 | 50 ± 28 | 271 ± 433 | 20,978 ± 6825 | 2.34 ± 0.39 | 0.02 | 1616 |
| M4-A4-2 | MS | 0.82 | 81.3 ± 1.0 | 5191 ± 60 | 43 ± 19 | 37 ± 27 | 45 ± 641 | 375,282 ± 77,589 | 1.47 ± 0.04 | 0.01 | 45,984 |
| M4-A4-3 | MS | 0.99 | 46.5 ± 0.2 | 5584 ± 21 | 31 ± 19 | 37 ± 28 | 933 ± 814 | 116,256 ± 19,899 | 0.90 ± 0.04 | 0.02 | 23,291 |
| M4-A4-4 | MS | 1.36 | 57.4 ± 0.3 | 892 ± 3 | 110 ± 20 | 97 ± 29 | 495 ± 435 | 125 ± 152 | 0.02 | 3 | |
| M4-A4-5 | MS | 1.10 | 49.0 ± 0.2 | 5218 ± 22 | 2 ± 19 | 9 ± 27 | 158 ± 259 | 7218 ± 653 | 0.52 ± 0.03 | 0.26 | 2524 |
| M4-A4-6 | MS | 0.77 | 52.9 ± 0.4 | 6632 ± 50 | −32 ± 18 | 25 ± 27 | 119 ± 235 | 11,170 ± 1343 | 1.73 ± 0.13 | 0.09 | 1161 |
| M4-A4-7 | MS | 0.60 | 60.6 ± 1.6 | 1973 ± 51 | 29 ± 19 | 22 ± 27 | −134 ± 456 | 130,319 ± 25,533 | 1.66 ± 0.08 | 0.03 | 14,134 |
| M4-A4-8 | MS* | 0.50 | 6 ± 19 | 37 ± 28 | 579 ± 462 | 14,719 ± 4000 | 0.71 ± 0.11 | 0.08 | 3729 | ||
| M4-A4-9 | MS | 1.21 | 58.0 ± 0.3 | 973 ± 4 | 53 ± 19 | 63 ± 28 | 393 ± 534 | 2169 ± 384 | 3.01 ± 0.45 | 0.03 | 130 |
| M4-A4-10 | MS* | 0.47 | 43 ± 21 | 46 ± 29 | −110 ± 420 | 7173 ± 2847 | 0.45 ± 0.12 | 0.20 | 2906 | ||
| M4-A5-1 | MS | 1.62 | 61.3 ± 0.3 | 2830 ± 15 | 57 ± 19 | 75 ± 28 | 201 ± 263 | 49,690 ± 8711 | 1.58 ± 0.10 | 0.02 | 5676 |
| M4-A5-2 | MS | 0.98 | 31.5 ± 0.1 | 5153 ± 18 | 140 ± 21 | 133 ± 30 | −384 ± 452 | 39,385 ± 12,720 | 2.07 ± 0.27 | 0.01 | 3434 |
| M4-A5-3 | MS | 0.50 | 44.1 ± 1.1 | 619 ± 15 | 143 ± 21 | 136 ± 30 | −71 ± 80 | 495 ± 189 | 1.26 ± 0.44 | 1.10 | 71 |
| M4-A7-1 | MS* | 1.87 | 9 ± 18 | 38 ± 27 | −103 ± 179 | 15,202 ± 1851 | 1.22 ± 0.08 | 0.07 | 2253 | ||
| M4-A7-2 | MS* | 1.91 | −8 ± 18 | 33 ± 27 | −225 ± 210 | 19,468 ± 1420 | 1.00 ± 0.04 | 0.04 | 3529 | ||
| M4-A7-3 | MS | 1.21 | 33.2 ± 0.2 | 1000 ± 5 | 33 ± 19 | 48 ± 28 | −73 ± 209 | 36,981 ± 3681 | 3.18 ± 0.13 | 0.13 | 2097 |
| M4-A7-4 | MS | 0.80 | 58.8 ± 3.3 | 1627 ± 90 | 45 ± 19 | 48 ± 28 | 57 ± 164 | 14,261 ± 1186 | 1.24 ± 0.06 | 0.18 | 2078 |
| M4-A8-1 | MS* | 0.75 | 64 ± 20 | 90 ± 29 | −42 ± 124 | 2422 ± 401 | 1.30 ± 0.18 | 0.58 | 335 | ||
| M4-A9-3 | MS | 1.10 | 62.6 ± 0.3 | 3973 ± 16 | 45 ± 19 | 62 ± 28 | 1670 ± 796 | 60,978 ± 11,107 | 0.94 ± 0.06 | 0.03 | 11,708 |
| M4-A9-4 | MS* | 0.50 | −8 ± 19 | 19 ± 28 | 144 ± 177 | 20 ± 157 | 0.72 | 129 | |||
| M4-A10-2 | MS | 2.09 | 46.5 ± 0.2 | 3645 ± 15 | 155 ± 21 | 122 ± 30 | −58 ± 176 | 1345 ± 355 | 2.95 ± 0.68 | 0.06 | 82 |
| M4-A10-3 | MS | 0.69 | 50.7 ± 0.5 | 686 ± 7 | −75 ± 17 | 81 ± 29 | 1 ± 531 | 279 ± 435 | 0.02 | 20 | |
| M4-A10-4 | MS | 0.88 | 48.7 ± 0.3 | 3021 ± 16 | −6 ± 18 | 31 ± 27 | −44 ± 221 | 3425 ± 689 | 1.14 ± 0.18 | 0.04 | 540 |
| M4-A10-5 | MS | 0.79 | 52.0 ± 0.5 | 5304 ± 55 | 13 ± 19 | 50 ± 28 | 152 ± 263 | 6863 ± 1166 | 1.81 ± 0.26 | 0.07 | 684 |
| M4-A10-6-1 | AB1 | 0.62 | 3.4 ± 0.1 | 394 ± 1 | −35 ± 18 | 24 ± 28 | 1883 ± 1121 | 115,237 ± 39,465 | 3.16 ± 0.16 | 0.05 | 6565 |
| M4-A10-6-2 | X | 0.32 | −342 ± 13 | −578 ± 12 | 92 ± 213 | 2,560,159 ± 478,185 | 267.50 ± 1.10 | 0.33 | 1721 | ||
| M4-A10-7 | MS* | 0.51 | 57 ± 20 | 48 ± 29 | 144 ± 339 | 3688 ± 499 | 1.59 ± 0.17 | 0.21 | 419 | ||
| M4-A10-8 | MS | 1.12 | 89.9 ± 0.9 | 302 ± 200 | 24 ± 19 | 8 ± 27 | 496 ± 396 | 145 ± 637 | 0.01 | 119 | |
| M4-A10-9 | MS* | 0.70 | 104 ± 20 | 97 ± 29 | 86 ± 409 | 10,706 ± 3142 | 2.08 ± 0.38 | 0.03 | 930 |
Notes.
a All data are reported with 1σ errors. b Carbon and nitrogen isotopic ratios for MS/Y grains reported here are those measured after the analyses of Mg–Al and Ti isotopes (i.e., post-Hyperion data). c The revised RSF value for Mg/Si based on SEM-EDX data, 7.5, was adopted for calculation (see Appendix B for details). d Here MS* denotes that the grain is classified as type MS solely based on its Si isotopic composition.Our MS and Y grains show 26Mg/24Mg values that are more than one order of magnitude higher than those of Huss et al. (1997). 10 Our higher 26Mg/24Mg values result from sampling less Mg contamination, as evidenced by our lower Mg/Si (Figure 2(b)) and enhanced Al/Mg ratios. The Huss et al. data and our data lie close to the same trend line in Figure 2(a). Hence, the differences in the Al/Mg ratios between the two studies cannot be explained by higher levels of Al contamination in our analyses because this would have moved our data horizontally to the right of the trend line in Figure 2(a). Thus, Figures 2(a) and (b) together point out that our study sampled much reduced Mg contamination, which was made possible by both the high spatial resolution achieved with the Hyperion O beam and the use of ROIs that were smaller than the full grains to exclude adjacent Mg contamination (see Figure A1 and Appendix A for details). This was not possible with the ion probe technology of the 1990s.
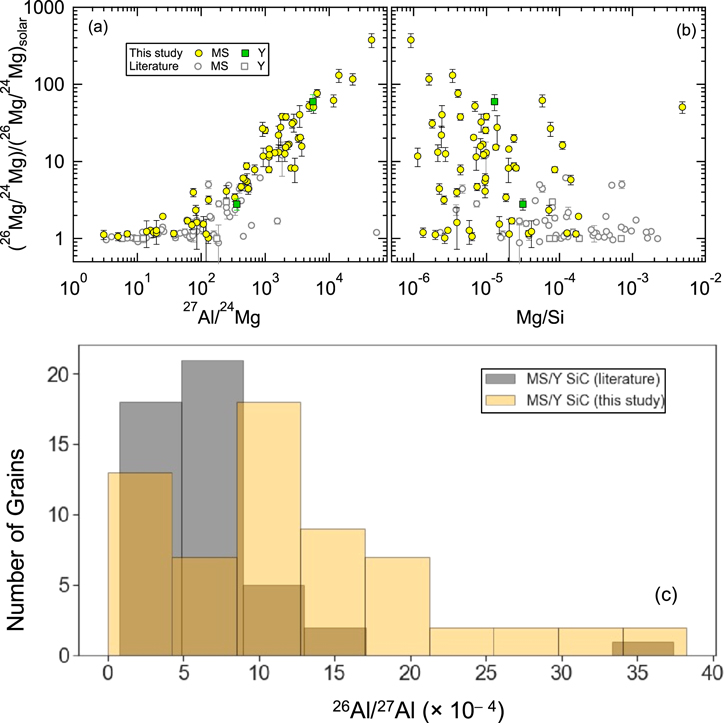
Figure 2. Plots comparing MS and Y SiC grains from this study and Huss et al. (1997) for their Mg–Al isotopic systematics and elemental ratios.
Download figure:
Standard image High-resolution imageThe high spatial resolution and exclusion of Al contamination (Figure A1) also resulted in higher 26Al/27Al ratios, calculated by assuming that all 26Mg excesses were produced by the decay of 26Al (see Appendix A for details), for our MS and Y grains (Figure 2(c)). We simulated the effect of having a larger primary beam on the levels of Al contamination by recalculating the 26Al/27Al ratios while including all Al signals within each grain (blue circles in Figure A2). This lowered the 26Al/27Al ratios by up to 60% (45% on average). The effects of Mg and Al contamination on reducing the Mg isotopic ratios and 26Al/27Al ratios, respectively, are further illustrated in Figure A3 by comparing the density distributions of our new data with those from Huss et al. (1997).
Our high-resolution ion images also revealed (1) common Ca and Cr contamination present on the substrate and (2) insignificant Si, Ti, and V contamination (Figure A1). The literature MS grains have an average δ50Ti of 179‰ ± 75‰ (one standard deviation), and our MS grains have 153‰ ± 95‰. In agreement with the literature data, our AB grains exhibit less correlated Si and Ti isotopic compositions than the MS grains. For instance, δ46Ti and 29Si show a strong correlation among MS grains (with Pearson's correlation coefficient R = 0.79 and 0.78 for the PGD and our data, respectively) but a weaker correlation among AB grains (with R = 0.58 and 0.44, respectively).
In summary, we identified substantial N and Al contamination, which has certainly impacted the literature data by, for example, lowering the 14N/15N and initial 26Al/27Al ratios in the PGD and thus compromising the inferred ratio distributions. In the next section, our discussion focuses on the grain classification and AGB stellar nucleosynthesis based on our new 14N/15N and 26Al/27Al results for MS, Y, and AB grains.
3. Discussion and Conclusions
3.1. Comparison with Observations for Carbon Stars
Stellar nucleosynthesis model calculations suffer from uncertainties in the initial stellar composition, nonstandard mixing processes, and nuclear reaction rates (see Busso et al. 1999; Palmerini et al. 2011 for reviews). Given the challenges in using model calculations to explain presolar grains' C and N isotopic ratios, we first compare the MS, Y, and AB grain data with observations for carbon stars (Table 2) in Figure 3(a). N-type carbon stars represent classical AGB stars and are the most numerous type of carbon star in the Galaxy. Most N-type carbon stars with near-solar initial metallicities are enhanced in s-process elements and F, which results from the recurrent mixing of He-burning products from the stellar interior into the envelope through third dredge-up (TDU) episodes (Abia et al. 2001, 2008; Abia 2008). J-type carbon stars represent about 10%–15% of all Galactic carbon stars (Abia & Isern 2000; Morgan et al. 2003) and are characterized by peculiar chemical compositions, including low 12C/13C ratios, Li enhancements (80% of the stars), and no enhancement in s-process elements (e.g., Sr, Zr, Ba, Nd) or F (Abia & Isern 2000; Abia et al. 2015). The origin of J-type carbon stars is unknown. SC-type carbon stars are rare in the Galaxy (Abia & Wallerstein 1998). They are characterized mainly by C/O ratios of around unity and are chemically similar to N-type carbon stars. In the classical picture, an SC-type carbon star represents a brief AGB phase when an oxygen-rich, class-M star transitions into a carbon star as TDU episodes bring increasing amounts of 12C to the stellar surface. N- and SC-type carbon stars in the solar neighborhood are inferred to be 1.5–3 M⊙ AGB stars according to their derived luminosity functions (Abia et al. 2020).
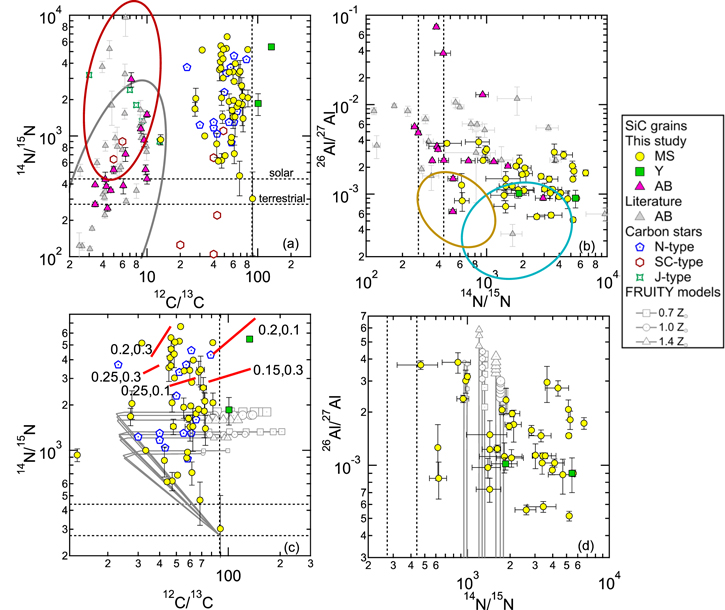
Figure 3. Plots comparing MS, Y, and AB SiC grains with observations for different types of carbon stars (Hedrosa et al. 2013; stars with upper limits reported for 14N/15N are not plotted) and FRUITY AGB models. The two groups of AB grains (fuchsia and gray ellipses) defined by B21 based on PGD (DB4 including C, N, Si isotopic data) are given in panel (a) for comparison with AB grains from this study and Hoppe et al. (2019). The two groups of MS and Y grains (brown and blue ellipses) defined by B21 based on PGD (DB5 including C, N, Si, Al isotopic data) are shown in panel (b) for comparison with our MS/Y grains. In panels (c) and (d), FRUITY stellar models (without CBP) are shown as gray lines with symbols, with the symbols representing C-rich phases during which SiC could condense; the small, medium, and large symbol sizes correspond to 1.5, 2.0, and 3.0 M⊙ stars, respectively. The CBP calculations of Palmerini et al. (2011) based on the FRUITY stellar model for a 2 M⊙, Z⊙ AGB star are shown in panel (c) as red lines, with the two numbers denoting the values adopted for the two parameters in the CBP model (see the main text for details).
Download figure:
Standard image High-resolution imageTable 2. Abundances and Chemical Characteristics of Carbon Stars
| Carbon Star | Abundance | 12C/13C | 14N/15N | s-process Enrichment |
|---|---|---|---|---|
| N-type | Large majority (e.g., Lloyd Evans 2010) | 20–90 | 1000–5000 | Yes |
| J-type | 10%–15% in the Galaxy and the Large Magellanic Cloud | ≤13 | 1000–3000 | No |
| SC-type | Rare (Abia & Isern 2000; Morgan et al. 2003) | 5–50 | 100–1000 | Yes |
Download table as: ASCIITypeset image
3.1.1. MS/Y Grains and N- and SC-type Carbon Stars
The grain-observation comparison in Figure 3(a) links MS and Y grains to N-type carbon stars, which are classical low-mass AGB stars. MS and Y grains make up more than 90% of presolar SiC grains, which is consistent with the observation that N-type carbon stars are the large majority of carbon stars in the Galaxy and the Large Magellanic Cloud (e.g., Lloyd Evans 2010). Our MS and Y grain C and N isotopic data are very similar to those of N-type carbon stars in Figure 3(a); i.e., the stars mostly lie within the region where most of the grain data are plotted (Figure A4). The consistency implies that N contamination was effectively suppressed in our analyses, such that the measured N (and C) isotopic ratios are representative of the envelope compositions of the grains' parent stars. Thus, our results solve a long-standing discrepancy highlighted by many previous studies (e.g., Hedrosa et al. 2013), in which 14N-poor MS grains could not be reproduced by theoretical AGB stellar models and were linked to astrophysical sites other than N-type carbon stars.
Despite the general consistency, a slight difference is seen in the range of 14N/15N; while N-type stars generally have 14N/15N above 1000, some of our MS grains show 14N/15N down to the terrestrial value. This raises the question of whether these grains represent SiC from a different type of star or their lowered ratios were caused by sampling N contamination. It was pointed out by B21 that MS grains with 14N/15N ≲ 1000 (hereafter 15N-rich MS grains; brown ellipse in Figure 3(b)) tend to show higher 26Al/27Al than those with higher 14N/15N (hereafter 14N-rich MS grains; blue ellipse), on the basis of which they divided MS grains into two groups. In agreement with the B21 results, 26Al/27Al ≳ 3 × 10⁻³ was found in four of our seven 15N-rich MS grains (57.1%) but none of our 33 14N-rich MS/Y grains. However, Figure 3(b) shows that the definition for these two clusters given by B21 based on the PGD is not applicable to our new grain data due to the PGD's N and Al contamination problem.
Figure 3(a) suggests that the 15N-rich MS grains may have come from SC-type carbon stars. The rareness of SC-type carbon stars (3% of all AGB stars) naturally explains the scarcity of 15N-rich MS grains. Abia et al. (2017) observed that, compared to N-type carbon stars, SC-type carbon stars tend to exhibit higher 17O/16O ratios, leading to the suggestion that SC-type carbon stars could have higher initial stellar masses (≳3–4 M⊙) than typical N-type carbon stars (≲3 M⊙). However, the stellar models of Karakas (2014) for 3–4 M⊙ carbon stars (compared to ≲3 M⊙ carbon stars) predict enhanced 14N production and no 26Al/27Al increase at the stellar surface (Karakas & Lugaro 2016) and thus cannot explain the 15N- and 26Al-rich nature of 15N-rich MS grains. Instead, these minor isotope enrichments, together with the observed high 17O/16O ratios for SC-type carbon stars, point to the occurrence of high-temperature (≳1 × 10⁸ K) H-burning process(es), i.e., nova-like nucleosynthesis (José et al. 2004), in SC-type carbon stars, which are not predicted by any of the state-of-the-art stellar models for 1.5–4 M⊙ carbon stars and need further investigation.
3.1.2. AB Grains and J- and SC-type Carbon Stars
Type AB grains with higher-than-solar 14N/15N ratios are consistent with observations of both J-type carbon stars and a few SC-type carbon stars in Figure 3(a). AB grains were defined as having 12C/13C ⪅ 10 and a wide range of 14N/15N ratios. Based on differences in the 26Al/27Al, Ti, and Mo isotopic ratios, Liu et al. (2017a, 2017b, 2018a) proposed to further divide AB grains into two subgroups, AB1 (with subsolar 14N/15N) and AB2 (with higher 14N/15N), using the solar 14N/15N as a divider. This division scheme is supported by the observed 14N/15N ratios of SC- and J-type carbon stars. The B21 cluster analysis also suggested that there are two clusters of AB grains but with some overlap in their 14N/15N ratios (ellipses in Figure 3(a)). Liu et al. (2017b) proposed that AB2 grains mostly came from J-type carbon stars based on their general lack of s-process Mo isotopic signatures. However, two of the 12 AB2 grains from Liu et al. (2017b) and one AB2 grain from Stephan et al. (2019) exhibit s-process Mo isotopic signatures and are consistent with an origin in SC-type carbon stars.
The proposal that AB1 grains originated in supernovae that experienced explosive H burning in the He/C zone (Liu et al. 2017a, 2018a) is supported by the stellar observations in Figure 3(a), given the lack of carbon stars with 14N/15N < 440 and 12C/13C ≤ 10. Schmidt et al. (2018) reported large 13C, 17O, and 15N enrichments in a young, C-rich planetary nebula (K4–47), based on which the authors proposed that the precursor of the nebula was a J-type star that underwent a He-shell flash. The result of Schmidt et al. (2018) raises the possibility that some J-type carbon stars have subsolar 14N/15N ratios. However, K4–47 could represent an extended nebula that was ejected by a pair of interacting binary stars during a nova-like explosion (Corradi et al. 2000), which is supported by the observation of high-velocity bullets of material plowing through the surrounding interstellar medium (e.g., Gonçalves et al. 2004). Moreover, such a low 14N/15N ratio as observed by Schmidt et al. (2018), 13.6 ± 6.5, has yet to be observed for any J-type carbon stars (Hedrosa et al. 2013). Thus, 15N-rich J-type carbon stars are relatively rare, if they exist at all. In contrast, AB1 and AB2 grains are about equally abundant, and, unlike AB2 grains, AB1 grains generally exhibit moderate s-process isotopic enrichments (Liu et al. 2018a). Since J-type carbon stars are characterized by the lack of any s-process enrichments, J-type carbon stars are unlikely to be the sources of AB1 grains.
3.2. Comparison with FRUITY Stellar Models for Low-mass AGB Stars
As discussed above, the 14N-rich MS and Y grains likely represent dust from N-type carbon stars, i.e., 1.5–3 M⊙ AGB stars with close-to-solar metallicities (Abia et al. 2020). Here we compare the isotopic data for these grains, as well as the measurements of N-type carbon stars, to appropriate FRUITY 11 stellar models in Figures 3(c) and (d). The FRUITY stellar models were computed by fully coupling a full nuclear network to the updated FUNS stellar evolution code 12 (see Cristallo et al. 2009, 2011 for details), in contrast to the postprocessing approach commonly adopted in the literature. Besides the use of a full nuclear network, FUNS differs from previous versions of the code in other important details. In particular, FUNS adopts low-temperature molecular opacities that take into account the increased opacity due to the formation of C- and N-bearing molecules at low temperatures (T < 5000 K; Cristallo et al. 2007). Moreover, the adopted mass-loss rate is calibrated against the physical properties of a sample of Galactic giant stars (see Straniero et al. 2006 for details). The FRUITY stellar models predict higher 12C/13C and 26Al/27Al ratios and a narrower range of 14N/15N ratios than are present in the grain data. Galactic chemical evolution (GCE) could have caused the initial compositions of the grains' parent stars to deviate from the assumed solar isotopic starting compositions (except for 14N/15N 13 ) adopted in the FRUITY model calculations. However, this is unlikely because the parent stars of the MS and Y grains were born at much earlier times than the observed N-type carbon stars, yet the MS and Y grains and N-type carbon stars show comparable C and N isotopic ratios. The inconsistent C and N isotopic ratios between observations and models, instead, are probably the result of cool bottom processing (CBP) in N-type carbon stars. The CBP is not taken into account in the FRUITY models (shown as lines with symbols in Figure 3) and can enhance a star's 13C, 14N, and 26Al production as envelope material is circulated to deep regions where H-burning reactions can take place at enhanced stellar temperatures (Wasserburg et al. 1995). The cause of this circulation, which may already work during the red giant branch (RGB) phase, is as yet unknown but may be related to magnetic buoyancy effects (Palmerini et al. 2017).
Given the uncertainties in the underlying mechanism for CBP, Palmerini et al. (2011) implemented CBP in the 2 M⊙, Z⊙ FRUITY stellar model using two parameters (shown as red lines in Figure 3(c)): (1) maximum circulation temperature (the first number next to the red lines), which is defined as Δ = logTH–logTP, where TH is the T at which the energy from the H-burning shell is maximum (6.3 × 10⁷ K) and TP is the maximum T sampled by circulating material, and (2) transport rate (the second number, in units of 10−6 M⊙ yr−1). A comparison of the grain data with the CBP calculations in Figure 3(c) constrains the upper limits for the rate of mass transport and the maximum temperature sampled by the circulating material to 3.5 × 10⁷ K and 3 × 10⁻⁷ M⊙ yr−1, respectively. Within this parameter regime, the CBP calculations predict negligible changes in the 26Al production. Thus, after the CBP is taken into consideration, two problems remain: (1) none of the models can reach 14N/15N ≲ 1000, but a dozen of our MS grains lie within this region (Figure 3(c)), and (2) the models generally predict higher 26Al/27Al ratios than the grain data (Figure 3(d)).
First, the fact that the minimum 14N/15N predicted by FRUITY models for low-mass C-rich AGB stars lies above ∼1000 supports our earlier conclusion that 15N-rich MS grains did not come from classical low-mass AGB stars (Section 3.1.1). Second, the lower-than-predicted 26Al/27Al ratios inferred for most of our MS and Y grains are unlikely to have been caused by Al contamination. Figure A5 indeed suggests that Al contamination was not completely suppressed for grains with diameters ≲500 nm (green shaded area), resulting in their lower 26Al/27Al ratios. However, among larger SiC grains, no dependence of 26Al/27Al on grain size can be seen (Figure A5), and we observed homogeneous 26Al/27Al ratios in the cores of these grains (see Figure A1 for example), pointing to negligible Al contamination present in our selected ROIs. Thus, our MS and Y grain data reveal that the 26Al/27Al ratios at the surface of their parent AGB stars mainly fall within the range of (1–2) × 10−3 (Figure 2(c)), in contrast to the FRUITY model predictions that lie above 2 × 10⁻³ during the C-rich phase (Figure 3(d)).
The data–model discrepancies in 26Al/27Al ratios are most likely caused by uncertainties in the 26Alg(p, γ)27Si reaction rate. To test this, we adopted the upper limit for this reaction rate given by Iliadis et al. (2010) in our 2 M⊙, Z⊙ stellar model, which reduces the 26Al/27Al ratio by a factor of 2 during the C-rich phase (e.g., from 4.27 × 10⁻³ to 2.11 × 10⁻³ at the last thermal pulse) and thus leads to a better grain–model agreement. On the other hand, (1) adoption of the new 25Mg(p, γ)26Al reaction rate estimated based on LUNA laboratory measurements (Straniero et al. 2013) resulted in only around a 15% decrease in the predicted 26Al/27Al ratio, and (2) although possible enhancements of the 26Al(n, p)26Mg and 26Al(n, α)23Na reaction rates could lower the 26Al/27Al ratio, data obtained by the n_TOF experiment (Guerrero et al. 2013) point to rate changes that are in the wrong direction (Lederer-Woods et al. 2021a) or confirm previous values (Lederer-Woods et al. 2021b).
In conclusion, a comparison of our MS, Y, and AB grain data with observations for carbon stars suggests that 14N-rich MS and Y grains originated in N-type carbon stars, 15N-rich MS and Y grains in 12C-rich SC-type carbon stars, and AB2 grains in J-type and 13C-rich SC-type carbon stars. The lack of observed carbon stars with 14N/15N < 440 and 12C/13C ≤ 10 supports that AB1 grains with such isotopic signatures condensed from ejecta of explosive events. Compared to 14N-rich MS and Y grains from N-type stars, 15N-rich MS and Y grains are more enriched in 26Al, and AB2 grains are more enriched in 13C and 26Al, both of which point to the occurrence of high-temperature H-burning process(es) in their parent stars. Finally, we highlight the urgent need for more multielement isotopic data for AB2 and 15N-rich MS, Y, and Z grains, especially their coupled 14N/15N, initial 26Al/27Al, and heavy-element isotopic compositions, by adopting the analytical procedures for suppressing contamination for these elements. This will shed more light on the mysterious evolution of SC- and J-type carbon stars.
We would like to thank Dr. Diego Vescovi for his help with running some of the FRUITY model tests for this study. We also would like to thank Dr. Ryan Ogliore for pointing out a small mistake in the manuscript. This work was supported by NASA through grants 80NSSC20K0387 to N.L. and NNX10AI63G and NNX17AE28G to L.R.N.
Appendix A: Analytical Methods
The SiC grains in this study were extracted from the CM2 carbonaceous chondrite Murchison by using the isolation method described in Nittler & Alexander (2003). The extracted SiC grains have a median diameter of 0.9 μm. Isotopic data for a number of AB, Y, Z, X, putative nova, and ungrouped grains on the prepared mounts have been previously reported (Liu et al. 2017a, 2017b, 2018a, 2018b, 2019). The presolar SiC grains investigated in this study were identified by both scanning electron microscope (SEM)–based energy dispersive X-ray (EDX) analyses and isotopic analyses of C, N, and Si with the Cameca NanoSIMS 50L instrument at the Carnegie Institution. A total of 85 new SiC grains were chosen for NanoSIMS isotopic analyses in this study, including 60 MS, 15 AB, 8 X, and 2 Y grains. Note that grains on mount #4 (named M4-AX-X) were first measured for Mg–Al and Si isotopes, during which 17 of the 40 SiC grains were completely consumed and could not be further measured for their C and N isotopic compositions. While the Si isotopic data clearly indicate that two of the 17 grains are X grains given their large 28Si depletions, the Si isotopic data alone cannot tell MS and AB grains apart. Also, the analytical uncertainties in the measured Si isotopic ratios are relatively large for the other 15 grains, thus precluding us from distinguishing between MS, Y, and Z grains. However, given the dominance of MS grains among presolar SiC grains (∼90%), the inferred stellar sources for these grains are likely robust, considering that the MS, Y, and Z grains all came from low-mass AGB stars and that less than one grain (by assuming 5% AB grains among presolar SiC) is expected to be of type AB. Thus, the grain-type assignment for these 15 grains solely based on Si isotopic ratios is not expected to affect any of the discussions in the main text. In addition, we chose 25 well-isolated (i.e., no adjacent grains), relatively large (0.84 μm, on average) MS and Y grains on mounts #1, 2, and 3 to investigate the problem of C and N contamination by collecting pre- and post-Hyperion C and N isotopic data (see next section for details).
Note that Figure 3(a) suggests that the MS grain M1-A4-G508 (12C/13C = 13.3 ± 0.3) could be classified as an AB2 grain, as this grain overlaps well with one of the J-type stars. The pre-Hyperion analysis for this grain yielded a 12C/13C ratio of 19.4 ± 0.1 (Tables A1). Also, note that the AB grain data in Figure 3(a) are all pre-Hyperion data, and the true 14N/15N ratios of the AB2 grains are probably a factor of 3 higher on average (see Section 2 for discussion), which explains that the AB2 grains generally show lower 14N/15N ratios than observed in J-type carbon stars (Figure A4) and consequently implies that some of the AB1 grains with terrestrial ≤14N/15N < solar could be AB2 grains instead.
Table A1. NanoSIMS Isotope Data of Presolar SiC Grains a
| Grain | Type | 12C/13C b | 14N/15N | δ46Ti (‰) | δ47Ti (‰) | δ49Ti (‰) | δ50Ti (‰) |
|---|---|---|---|---|---|---|---|
| M1-A3-G203 | MS | 67.7 ± 0.3 | 356 ± 16 | −34 ± 23 | 7 ± 23 | −2 ± 12 | 27 ± 8 |
| M1-A3-G220 | MS | 73.0 ± 0.5 | 452 ± 25 | 40 ± 35 | −11 ± 35 | ||
| M1-A3-G226 | MS | 56.3 ± 0.4 | 369 ± 26 | −43 ± 13 | −18 ± 11 | 39 ± 12 | 62 ± 8 |
| M1-A3-G243 | MS | 64.4 ± 0.2 | 789 ± 42 | −10 ± 12 | −31 ± 9 | 41 ± 12 | 268 ± 10 |
| M1-A3-G277 | MS | 65.0 ± 0.4 | 1037 ± 72 | 39 ± 15 | 19 ± 12 | 113 ± 13 | 190 ± 9 |
| M1-A3-G338 | MS | 56.5 ± 0.4 | 400 ± 24 | 2 ± 12 | −21 ± 8 | 51 ± 12 | 192 ± 9 |
| M1-A4-G476-1 | MS | 69.7 ± 0.4 | 574 ± 32 | 20 ± 20 | −10 ± 18 | 36 ± 13 | 290 ± 11 |
| M1-A4-G476-2 | MS | 72.3 ± 0.7 | 450 ± 34 | 4 ± 17 | 9 ± 16 | 137 ± 14 | 86 ± 9 |
| M1-A4-G508 | MS | 19.4 ± 0.1 | 670 ± 30 | −115 ± 12 | −67 ± 10 | 63 ± 13 | −143 ± 7 |
| M1-A4-G612 | MS | 70.5 ± 0.5 | 971 ± 72 | −31 ± 16 | −24 ± 14 | 141 ± 17 | 224 ± 18 |
| M1-A5-G657 | MS | 63.6 ± 0.4 | 760 ± 65 | −6 ± 14 | −3 ± 12 | 135 ± 13 | 180 ± 9 |
| M1-A5-G662 | Y | 88.2 ± 0.6 | 977 ± 64 | 1 ± 15 | −16 ± 13 | 98 ± 13 | 197 ± 9 |
| M1-A5-G950 | MS | 44.5 ± 0.3 | 2895 ± 255 | 64 ± 13 | 24 ± 8 | 139 ± 13 | 218 ± 9 |
| M1-A5-G953 | MS | 78.7 ± 0.6 | 787 ± 73 | −44 ± 17 | −9 ± 16 | 83 ± 13 | 165 ± 9 |
| M1-A5-G960 | MS | 53.0 ± 0.2 | 730 ± 40 | −97 ± 11 | −65 ± 8 | −25 ± 11 | 76 ± 8 |
| M1-A5-G1147 | MS | 58.5 ± 0.3 | 562 ± 39 | 65 ± 23 | 27 ± 22 | 36 ± 12 | 116 ± 9 |
| M1-A5-G1211 | MS | 54.8 ± 0.4 | 766 ± 54 | 48 ± 16 | 9 ± 13 | 31 ± 13 | 93 ± 10 |
| M1-A5-G1216 | MS | 74.7 ± 0.4 | 331 ± 17 | 27 ± 15 | 1 ± 12 | 79 ± 13 | 236 ± 9 |
| M1-A5-G1381 | MS | 71.2 ± 0.4 | 865 ± 68 | −13 ± 15 | −19 ± 12 | 111 ± 13 | 155 ± 9 |
| M1-A6-G096 | MS | 51.8 ± 0.4 | 473 ± 36 | 16 ± 12 | 171 ± 9 | ||
| M1-A6-G099 | MS | 63.3 ± 0.3 | 452 ± 24 | 69 ± 16 | 18 ± 13 | 36 ± 12 | 196 ± 9 |
| M1-A6-G106-1 | MS | 55.6 ± 0.4 | 1170 ± 76 | −9 ± 34 | −33 ± 35 | 4 ± 62 | 127 ± 67 |
| M1-A6-G106-2 | MS | 34.1 ± 0.2 | 942 ± 96 | 87 ± 16 | 239 ± 13 | ||
| M1-A6-G428 | MS | 31.5 ± 0.2 | 390 ± 29 | ||||
| M1-A6-G605 | MS | 49.3 ± 0.4 | 729 ± 76 | 119 ± 23 | 81 ± 21 | 139 ± 13 | 202 ± 9 |
| M1-A5-G754 | AB1 | −90 ± 14 | −62 ± 12 | −24 ± 11 | −86 ± 7 | ||
| M1-A6-G313 | AB1 | −88 ± 17 | −68 ± 16 | −4 ± 14 | 40 ± 11 | ||
| M1-A6-G594 | AB1 | 71 ± 18 | 18 ± 16 | 175 ± 14 | 110 ± 8 | ||
| M3-G472 | AB1 | −4 ± 51 | −67 ± 52 | 70 ± 13 | −3 ± 8 | ||
| M3-G1607 | AB1 | 32 ± 12 | −73 ± 7 | ||||
| M1-A6-G501 | AB2 | 91 ± 18 | 14 ± 15 | 178 ± 14 | 288 ± 10 | ||
| M1-A6-G506 | AB2 | 50 ± 14 | 75 ± 10 | ||||
| M2-A2-G1129 | AB2 | 74 ± 19 | 34 ± 17 | −13 ± 12 | |||
| M3-G1154 | AB2 | −88 ± 19 | −99 ± 30 | 134 ± 14 | 112 ± 10 | ||
| M3-G1507 | AB2 | 109 ± 16 | 51 ± 12 | 155 ± 14 | 232 ± 9 | ||
| M2-A2-G820 | X | −36 ± 50 | −48 ± 52 | 269 ± 15 | 210 ± 10 |
Note.
a All data are reported with 1σ errors. b Carbon and nitrogen isotopic ratios for MS/Y grains reported here are those measured before the analyses of Mg–Al and Ti isotopes (i.e., pre-Hyperion data).Download table as: ASCIITypeset image
All isotopic analyses were conducted with the Cameca NanoSIMS 50L instrument at the Carnegie Institution. For 48 grains, a Cs+ primary ion beam of ∼1 pA (16 keV energy) was first used for isotopic analyses of C, N, and Si as negative ions (N measured as CN−) at a spatial resolution of ∼100–150 nm (pre-Hyperion data for AB and X grains in Table 1 and those for MS/Y grains in Table A1). After that, a primary O− ion beam of ∼3–10 pA produced by the Hyperion source was used here for Mg/Al, Ca, and Ti isotopic analyses, resulting in spatial resolutions of ∼150–300 nm in the obtained ion images. Similar to our previous analytical procedure (Liu et al. 2018b), we conducted Ti isotopic analyses in the multicollection mode instead of the combined analysis mode to improve the analytical stability and reliability. We measured Ca–Ti and Ti–V isotopic ratios in two sets of runs in the multicollection mode: 28Si+, 40Ca+, 48Ti+, 49Ti+, 50Ti+, 51V+, and 52Cr+ in the first set and 28Si+, 40Ca+, 44Ca+, 46Ti+, 47Ti+, 48Ti+, and 51V+ in the second set. For N, the high 14N/15N ratios obtained with IMS-3f (Hoppe et al. 1996; Huss et al. 1997) may suggest that extensive presputtering is an effective way to suppress N contamination. This is because, with respect to the corresponding NanoSIMS measurements, these old IMS-3f measurements had to consume more material, as the IMS-3f instrument is equipped with only one detector (five or seven detectors on NanoSIMS) and has a lower transmission efficiency. Thus, after the Hyperion-NanoSIMS analyses, we switched back to the Cs+ source and measured the C, N, and Si isotopic ratios in all of the remaining grains (post-Hyperion data for MS/Y grains in Table 1). The hope was that the additional sputtering of the sample and surrounding substrate would have reduced any contamination present. Note that during the post-Hyperion analyses, there was a problem with one of the detectors, and we chose to collect 12C12C, 12C13C, 12C14N, 12C15N, 28Si, and 29Si, which means that the 30Si/28Si ratio could not be determined in the post-Hyperion analyses.
All of the isotopic data were collected in imaging mode, which allowed for the selection of smaller ROIs for calculating isotopic ratios and thus reduced the likelihood of contamination (see Figure A1 for an example). The measurements were all done with an entrance slit width of 30 μm and exit slit widths of 50 (minor isotopes, e.g., 13C) and 80 (major isotopes, e.g., 12C) μm, and all of the secondary ions were counted with electron multipliers. The achieved mass resolving powers (5000–8000) were sufficient to suppress all potential molecular isobaric interferences, e.g., resolving 12CH from 13C at mass 13. The detector background was found to be between 0.001 and 0.01 cps, which compares with the lowest ion signal intensity of 0.1 cps for 25Mg+.
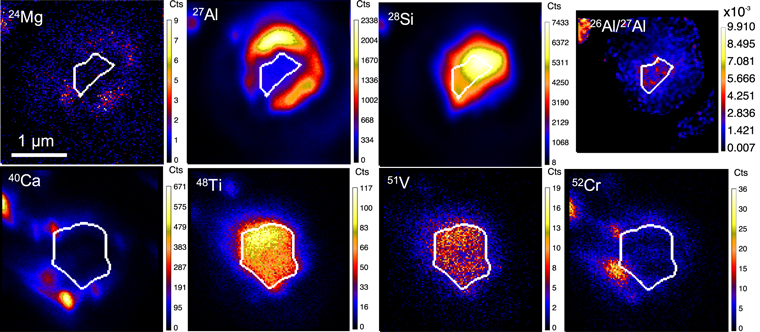
Figure A1. NanoSIMS ion (and inferred initial 26Al/27Al) images of grain M1-A4-G508. The white lines highlight the contours of less contaminated grain regions (for Mg, Al, Ca, and Cr). Note that the ion images in the upper and lower panels were taken during two different analytical sessions.
Download figure:
Standard image High-resolution imageTo demonstrate the effectiveness of our two approaches (extensive presputtering and reduced ROIs) in suppressing potential contamination, the two sets of 14N/15N (pre-Hyperion versus post-Hyperion) and 26Al/27Al (all Al signals included versus Al contamination excluded) ratios are compared in Figure A2 for MS/Y grains from this study. The Mg–Al isotopic systematics of our MS and Y grains are also compared with those from Huss et al. (1997) for their distributions in Figure A3, from which we infer significant Mg and Al contamination sampled in the study of Huss et al. (1997). Although presolar SiC grains are generally free of Ti contamination (Figures A1 and A6), the presence of Cr can result in an isobaric interference at mass 50, thus compromising the analysis of δ50Ti. Since Ti and Cr signals do not always overlap in ion images of presolar SiC grains (Figure A1), the improved spatial resolution here allowed us to suppress the Cr contribution by choosing small ROIs to exclude Cr contamination and thus to derive more reliable δ50Ti values (the 50Cr contribution is generally <10%, with an average of 5%). The high spatial resolution achieved by the Hyperion source also enabled direct observation of Ti- and V-rich subgrains within the SiC host in NanoSIMS ion images (Figure A6), which had mainly been previously achieved by transmission electron microscopic (TEM) observations. The 1σ errors reported in all tables and figures include both analytical (estimated based on 1σ standard deviations of all standard measurements) and counting statistical uncertainties (1σ Poisson errors).

Figure A2. Plot of 26Al/27Al vs. 14N/15N comparing the two sets of data for MS and Y grains from this study. Reduced ROI and no reduced ROI denote the cases of deducing the initial 26Al/27Al by excluding adjacent Al contamination using a small ROI and including all Al signals contained within the SiC grain, respectively.
Download figure:
Standard image High-resolution image
Figure A3. Probability distributions of 26Al/27Al vs. 26Mg/24Mg normalized to the solar value for MS and Y SiC grain data from this study in panel (a) and Huss et al. (1997) in panel (b).
Download figure:
Standard image High-resolution image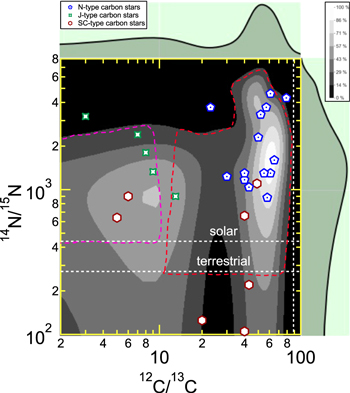
Figure A4. Observations for different types of carbon stars as shown in Figure 3 are overlaid on the probability distribution (in gray-scale color map) of the post-Hyperion data for our 47 MS and Y grains (red dashed line region) and the pre-Hyperion data for our 7 AB2 grains (fuchsia dashed line region).
Download figure:
Standard image High-resolution imageA variety of standards with terrestrial isotopic compositions were used as isotopic standards and also for determining the relative sensitivity factor (RSF), defined as (A/B)true = (A/B)measured/RSF, in which A and B represent two elements of interest. Synthetic SiC and Si3N4 grains were used as standards for C, N, and Si isotopic analyses. The NIST glass standard, SRM 610, was used as a standard for Ca–Ti and Ti–V isotopic analyses, while the Burma spinel was used as a standard for Mg–Al isotopic analysis. For Ti isotopic analysis, synthetic TiC was used as an additional standard. The sensitivity factors of Mg, Ca, and Ti relative to Si were determined by measuring SRM 610, and the obtained values were 3.10, 9.78, and 4.02, respectively. The RSF of Mg/Al was determined to be 1.20 in the Burma spinel for deducing 26Al/27Al. The 26Al/27Al ratios were determined from the collected ion counts by use of the equation 26Al/27Al = [26Mgmeasured – 24Mgmeasured × (26Mg/24Mg)standard]/(27Almeasured × RSF), where (26Mg/24Mg)standard is the measured 26Mg/24Mg ratio of the Burma spinel standard (e.g., Nittler et al. 2003). However, it is questionable whether O-rich standards such as SRM 610 are appropriate for determining RSF values for C-rich samples like SiC, and we examine this problem in Appendix B by comparing the NanoSIMS elemental data of presolar SiC grains with the corresponding EDX data obtained with an SEM and TEM when available.
Appendix B: Mg/Si and Al/Si RSF Values for SiC
Although the SIMS ionization efficiency for positive ions shows a strong correlation with the ionization potential, variations are expected depending on the sample matrix and the element itself. For example, the presence of oxygen in the sample enhances positive ion yields for most elements, and an O2 flooding gun was therefore used in old 3f-IMS analyses to boost the yields of Mg+, Al+, and Ti+ ions for presolar SiC measurements (e.g., Hoppe et al. 1996; Huss et al. 1997). However, NanoSIMS is not equipped with such an O2 flooding gun. The contrasting matrix chemistries between the standard SRM 610 (silicon glass) and SiC raise the question of whether RSF values determined based on SRM 610 measurements can be directly applied to calculate trace-element abundances (Mg, Al, K, Ca, Ti, V, and Cr) for SiC samples. In comparison to NanoSIMS analyses, SEM-EDX trace-element analyses are less affected by differing sample-standard matrix chemistries but more affected by other factors, such as topography. We therefore compared the RSF-corrected NanoSIMS Mg and Al data for SiC grains from this study and Liu et al. (2018b) with their SEM-EDX data when available. The EDX data were obtained with a JEOL 6500F field emission SEM equipped with an Oxford Instruments silicon drift detector in autoparticle analysis mode (Liu et al. 2017c). The data were quantified by using pyrope (Mg, Al garnet) as the standard for Si and ENAL20 (enstatite aluminum 20 wt%, an Al-bearing enstatite glass) for Mg and Al. In addition, EDX data were also obtained with a TEM on electron transparent thin sections that had been extracted from X grains M2-A1-G674 and M2-A2-G1036 by using a focused ion beam instrument (Singerling et al. 2021). It is noteworthy that the Mg/Si ratios in MS SiC grains are determined by NanoSIMS to be <0.003 (Table 1; also see Hoppe et al. 2015), and Mg in single presolar SiC grains is, therefore, below the detection limit of SEM-EDX analyses. The high Mg abundances reported for X grains in Figure A7(b) mainly result from 26Mg from 26Al decay, since most X grains are characterized by extremely high 26Al/27Al ratios (≳0.1; see Liu et al. 2017c for details). Errors in the trace-element data are not reported in Figure A7 because the associated statistical errors are negligible, and uncertainties in the data are probably mainly caused by analytical artifacts as mentioned above, which cannot be accurately assessed based on our obtained data.
The data comparisons shown in Figure A7 suggest that the Al/Si and Mg/Si ratios in SiC grains determined based on NanoSIMS measurements of SRM 610 are generally overestimated, i.e., the RSF values are underestimated, by factors ranging from 2 to 5. First of all, it is noteworthy that the X grain data from Liu et al. (2018b) in Figure A7 were obtained with a duoplasmatron O source at a worse spatial resolution than the grain data from this study. As discussed in the main text, this probably means that the X grain data sampled an average of 45% Al contamination (Section 2), which roughly accounts for the larger slope (by a factor of ∼2) determined by the X grain data in Figure A7(a). We excluded MS grain M1-A4-G476-1 and X grain M2-A2-G1036 (highlighted by black arrows) in obtaining the linear fits because (1) the MS grain was quite small (0.47 μm) and had significant Al contamination that could not be completely excluded by selecting a small ROI (Figure A5), and (2) the NanoSIMS data suggest that the X grain had an Al/Si ratio of 0.6, which is too high for SiC. The high Al/Si ratio of the X grain was probably caused by Al contamination, since the 26Al/27Al ratio inferred based on its NanoSIMS data (0.21 ± 0.01) is a factor of 3–4 lower than those based on its SEM-EDX (0.93 ± 0.11) and TEM-EDX (0.77 ± 0.08) data. The lower 26Al/27Al ratio inferred by the NanoSIMS data suggests that ∼70% of the sampled Al signals by NanoSIMS were from contamination instead of being intrinsic signals. In other words, the intrinsic Al/SiNanoSIMS ratio for the X grain should be a factor of around 3 lower, and the corrected data point falls within the 95% confidence band for the linear fit in Figure A7(a). By excluding these two grains, the respective Pearson's correlation coefficients (R) in Figure A7(a) increase from 0.85 to 0.91 for the MS grains and 0.88 to 0.95 for the X grains. Second, the NanoSIMS X grain data in Figure A7(b) are less likely to have suffered from significant Mg contamination. This is because, for instance, Hoppe et al. (2015) reported that the Mg/Si ratios of all of their studied MS grains lie below 0.003 (i.e., the maximum level of Mg contamination) based on NanoSIMS analyses with a duoplasmatron source. In comparison, all but one X grain from Liu et al. (2018b) show Mg/SiNanoSIMS above 0.003, thereby suggesting that the Mg signals are dominated by 26Mg and that the effect of Mg contamination should be negligible in skewing the correlation shown in Figure A7(b). The X grain data in Figure A7(b) show a strong linear correlation, with a correlation coefficient R value of 0.95 (gray dashed line). However, the linear fit is mainly controlled by the two grains with the highest Mg/Si ratios (highlighted by black arrows), and many grains with low Mg/Si ratios lie below the 95% confidence band for the linear fit. As a test, we excluded these two grains and obtained a new linear fit (blue dotted line; R = 0.90), which includes more grains in the lower range within the confidence band. Given that the two slopes agree with each other within the uncertainties, to be conservative, we adopted the shallower slope (2.43) for correcting the NanoSIMS Mg/Si data for presolar SiC (Table 1, Figure 2(b)). In summary, according to the MS grain data in Figure A7(a) and the X grain data in Figure A7(b), the RSF values of Al/Si and Mg/Si should be revised to 5.6 ± 1.6 (95% confidence) and 7.5 ± 2.4, respectively. The revised Mg/Si RSF value, 7.5, was adopted for calculating the Mg/Si ratios reported in Table 1 and Figure 2(b). For calculating the 26Al/27Al ratio, we still adopted the RSF value of 1.2 for Mg/Al based on the NanoSIMS analyses of the Burma spinel because this value agrees with the revised RSF value (1.3), which, however, has a much larger error due to the uncertainties in the linear fits in Figure A7.
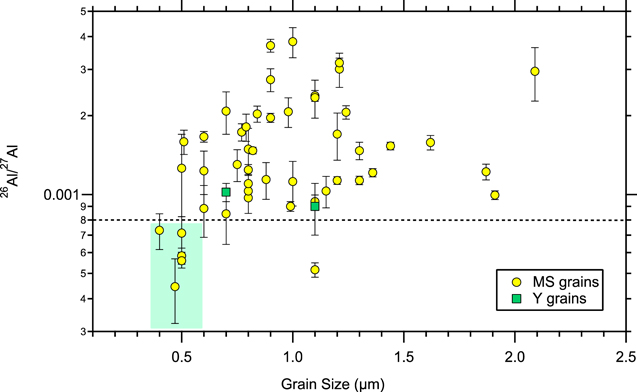
Figure A5. Plot of 26Al/27Al ratio vs. grain size for the MS and Y grains from this study.
Download figure:
Standard image High-resolution image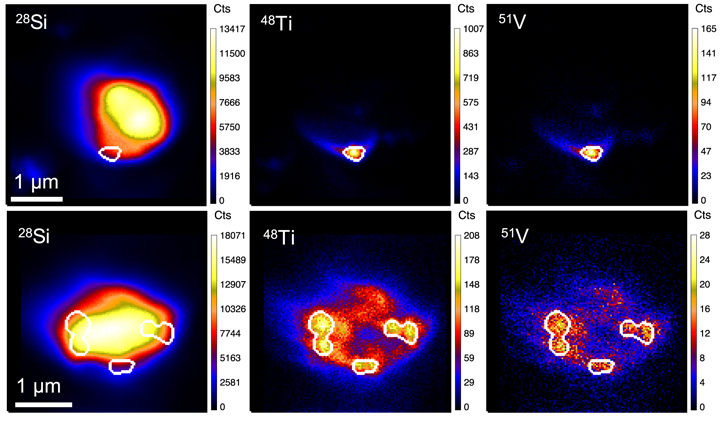
Figure A6. NanoSIMS ion images of MS grains M1-A2-277 (upper panels) and M1-A3-338 (lower panels). The white contours highlight Ti and V hot spots within the grains.
Download figure:
Standard image High-resolution image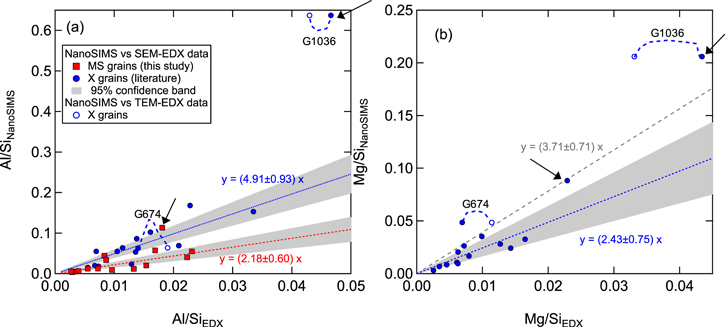
Figure A7. (a) Plot of Al/Si ratios determined by NanoSIMS vs. those by SEM- and TEM-EDX for MS grains from this study and X grains from Liu et al. (2018b). A blue dashed curve connects TEM-EDX (open symbols) and SEM-EDX (filled symbols) data for the same grain. Black arrows denote grains that were excluded from the respective linear fits (blue and red dotted lines for X and MS grains, respectively). (b) Same as panel (a) but for Mg/Si ratios. The gray dashed line represents the linear fit to all of the grain data, and the blue dotted line is the linear fit to all but two grains (highlighted by black arrows).
Download figure:
Standard image High-resolution image
Finally, note that the SEM-EDX Mg/Si and Al/Si data of grain M2-A1-G674 are both 40% lower than its corresponding TEM-EDX data. The differences for grain M2-A1-G674 appear to be caused by some SEM-EDX analytical artifact, e.g., topography, as the TEM-EDX Mg/Si data agree better with the linear fit shown in Figure A7(b). However, it is noteworthy that the TEM-EDX data for grain M2-A1-G674 show large Mg and Al heterogeneities across the TEM thin section (Singerling et al. 2021). The observed heterogeneities could be responsible for the inconsistencies between the EDX data and the linear fit in Figure A7(b) and also between the TEM-EDX and SEM-EDX data, because the SEM-EDX data represent the grain's bulk composition while the NanoSIMS and TEM-EDX analyses only sampled a thin slice of the grain.
Footnotes
- 7
Here δ29Si is defined as [(29Si/28Si)grain/(29Si/28Si)SS–1] × 1000, in which (29Si/28Si)SS denotes the solar system value.
- 8
We did not determine the 14N/15N ratio for three of the X grains due to a problem with one of the detectors during that analytical session.
- 9
The grain contour is inferred from the 12C and/or 28Si ion images (see Figure A1 for example).
- 10
We chose to compare our data with only those of Huss et al. (1997) because (1) the sizes of the two sets of data are similar, and (2) many other studies reported only the inferred 26Al/27Al ratios and not the measured Mg isotopic data.
- 11
FRUITY stands for FRANEC Repository of Updated Isotopic Tables & Yields (Cristallo et al. 2011, 2015). The FRUITY database is available at http://fruity.oa-teramo.inaf.it/.
- 12
The FUNS code (Straniero et al. 2006) is a more recent version of the original FRANEC code (Chieffi & Straniero 1989). As already highlighted, the main novelty of the FUNS code is the adoption of a full nuclear network, which involves about 500 isotopes linked by more than 1100 reactions that are directly coupled to the physical evolution of the stellar structure (see, e.g., Cristallo et al. 2009). For a full description of the FUNS code, we refer the reader to Straniero et al. (2006).
- 13
For the N isotopic composition, the FRUITY models adopted the terrestrial value, 272, in contrast to the solar value, 440 (Marty et al. 2011). Thus, adopting the solar value would enhance the 14N/15N ratios predicted by the FRUITY models. Note that the initial composition of the grains' parent stars (older than the solar system) is largely unknown due to uncertainties in the GCE.