


Abstract
We report a unique combination of ∼10 eV to ∼344 MeV in situ ion measurements from the Plasma Science (PLS), Low Energy Charged Particle (LECP), and Cosmic Ray Subsystem (CRS) experiments on the Voyager 2 (V2) spacecraft, and remotely sensed ∼110 eV to ∼55 keV energetic neutral atom (ENA) measurements from the Interstellar Boundary Explorer (IBEX) mission and Ion and Neutral Camera (INCA) on the Cassini mission. This combination is done over the time period from 2009 to the end of 2016, along the V2 trajectory, toward assessing the properties of the ion energy spectra inside the heliosheath. The combined energy spectra exhibit a series of softening and hardening breaks, providing important insights on the various ion acceleration processes inside the heliosheath. Ions in the <6 keV energy range dominate the total pressure distribution inside the heliosheath but the ion distributions at higher energies (>5.2 keV) provide a significant contribution to the total pressure. With the assumption that all ENAs (∼110 eV to 55 keV) are created by charge-exchange interactions inside the heliosheath, we estimate that the magnetic field upstream at the heliopause required to balance the pressure from the heliosheath in the direction of V2 is ∼0.67 nT. This number is consistent with the measured magnetic field at V2 from 2018 November, when the spacecraft entered interstellar space.
Export citation and abstract BibTeX RIS
1. Introduction
Voyager 1 and Voyager 2 (V1 and V2), launched more than 43 years ago, are two of the most important and successful missions traversing the heliosphere in the upwind (nose) hemisphere, where the interstellar flow impinges (Wood et al. 2015). They have made several key discoveries concerning the properties and evolution of the Sun's expanding atmosphere, a dynamic magnetized flow called the solar wind (SW; Parker 1958), and the SW interactions with the local interstellar medium (LISM) (Parker 1961). These interactions form the most important regions and boundaries of our local astrosphere, called the "heliosphere."
The termination shock (TS) crossings from V1 and V2 occurred in 2004 and 2007, respectively, at distances of ∼94 au (Decker et al. 2005; Stone et al. 2005) and ∼84 au (Decker et al. 2008; Stone et al. 2008) (1 au equals the distance between the Earth and Sun, ∼150 × 106 km). These crossings led to the discovery of the reservoir of suprathermal particles and weak magnetic fields that constitute the heliosheath (HS). This region is characterized by plasma with β (particle pressure divided by the magnetic field pressure; Pparticle/PMAG) always ≫1 and mostly >10 (e.g., Decker et al. 2015; Dialynas et al. 2019), and extends from the TS out to the heliopause (HP), the outer boundary of our solar bubble.
Although the TS was considered to be the site at which anomalous cosmic rays (ACRs) are accelerated, the ∼10–100 MeV intensities at both V1 and V2 did not peak at the TS (Stone et al. 2005, 2008; Decker et al. 2005). These observations drove the search for an alternative ACR acceleration mechanism and/or location, e.g., inside the heliosheath near the heliopause due to reconnection, a pumping mechanism, turbulence generated by multi-ion magnetosonic waves (e.g., Langner et al. 2006; Lazarian & Opher 2009; Drake et al. 2010; Strauss et al. 2010; Fisk & Gloeckler 2013; Zieger et al. 2015), or due to a blunt TS geometry that causes the ACRs to be accelerated along the flank or tail of the TS (e.g., McComas & Schwadron 2006; Cummings et al. 2019, and references therein). The ACR composition is different from that of the Galactic cosmic rays (GCRs); therefore, their sources must be different, with ACRs generated from SW pickup ions (PUIs). A comparison of the ACR energy spectra with the estimated flux of PUIs at the termination shock revealed a mass-dependent acceleration that favors heavier ions (Cummings & Stone 2016, and references therein).
Remote observations of <6 keV energetic neutral atoms (ENAs) from the Interstellar Boundary Explorer (IBEX) mission, at ∼1 au, and of >5.2 keV ENAs from the Cassini spacecraft (in orbit around Saturn at ∼10 au until 2017 September 15) through its dedicated ENA imager, Ion and Neutral Camera (INCA), provided the first full-sky ENA images of the heliosphere (Krimigis et al. 2009; McComas et al. 2009a). These images provide global context to the local measurements of both Voyagers. The distribution of ENAs in the celestial sphere, together with the shape of the global heliosphere itself, appears to be very different when looking at different ENA energies.
The IBEX images at <6 keV revealed the existence of a bright and narrow ribbon of ENA emissions that roughly encircles the global heliosphere (McComas et al. 2009a; Schwadron et al. 2009). This unexpected feature is thought to lie beyond the HP and formed through a secondary ENA process (McComas et al. 2009a; Heerikhuisen et al. 2010). The ribbon center coincides with the locus of directions where the interstellar magnetic field (ISMF) is perpendicular to the radial Sun–IBEX line (Schwadron et al. 2009). The ribbon "sits" on top of the globally distributed flux (GDF), the background ENA flux that exhibits different characteristics (Livadiotis et al. 2011; Schwadron et al. 2011) and evolves differently in time over the solar cycle (McComas et al. 2017, 2020). The origin of the GDF may be in the HS (Dayeh et al. 2011; McComas et al. 2009a; Schwadron et al. 2009). The <6 keV IBEX/ENA measurements are correlated with the dynamic properties of the SW. These ENA fluxes respond to the SC SW pressure changes, with the ∼4.29 keV ENA response showing the shortest time delay and largest flux variation (Reisenfeld et al. 2016; Zirnstein et al. 2018; Schwadron et al. 2018; McComas et al. 2020). These observations were interpreted as evidence for an intermediate global heliospheric configuration (McComas et al. 2013, 2020), where both the external dynamic and magnetic pressures strongly affect the heliosphere. This configuration is "intermediate between the Parker (1961) extremes of the possible interaction, with comparable dynamic and magnetic pressures governing the interaction," consistent with models showing a heliotail that extends out to thousands to tens of thousands of au (e.g., Zirnstein et al. 2016; Pogorelov et al. 2017).
The INCA images at 5.2–55 keV revealed the existence of a "belt" of varying ENA intensities (Krimigis et al. 2009). This feature is identified as a high intensity, relatively wide, and nearly energy-independent ENA region that wraps around the sky sphere. It is produced by a "reservoir" of particles in the HS that is constantly replenished by new particles from the solar wind (Dialynas et al. 2013). The INCA images also revealed two prominent "basins," identified as two extended heliosphere lobes, where ENA minima occur (Krimigis et al. 2009; Dialynas et al. 2013). Remotely sensed >5.2 keV INCA/ENAs, together with in situ >28 keV ion measurements from the Voyager missions in overlapping energy bands (Decker et al. 2005), were combined to estimate the V1 and V2 HP crossing distances (Krimigis et al. 2011; Dialynas et al. 2019), and the magnitude of the magnetic field upstream of the HP (Krimigis et al. 2010; Dialynas et al. 2019). These measurements showed that the heliosphere responds promptly, within ∼2–3 years, to outward-propagating SW changes in both the nose and tail directions over the solar cycle and supported the interpretation of a diamagnetic, "bubble-like" heliosphere, with few substantial tail-like features (Dialynas et al. 2017a, 2017b). This concept is consistent with recent modeling (Opher et al. 2015; Drake et al. 2015; Kivelson & Jia 2013; Boschini et al. 2019; Opher et al. 2020) as well as ENA observations from IBEX-Lo (Galli et al. 2016, 2017).
The V1 and V2 crossings of the HP, in 2012 (Krimigis et al. 2013; Stone et al. 2013; Burlaga et al. 2013; Gurnett et al. 2013) and 2018 (Krimigis et al. 2019; Stone et al. 2019; Richardson et al. 2019; Gurnett & Kurth 2019; Burlaga et al. 2019) at ∼122 au and ∼119 au, respectively, provided invaluable information on the extent of the upwind heliosphere's expansion into the LISM and the properties of the upstream medium, showing that the interstellar (IS) flow is not the primary driver of the interaction of the heliosphere with the LISM. The pressure of the IS magnetic field is mainly responsible for configuring the HS, as was initially suggested in Krimigis et al. (2009) and Dialynas et al. (2017a). However, based on IBEX observations, it is also suggested that the contributions from the IS flow and magnetic field are comparable (Fuselier & Cairns 2013; Schwadron et al. 2014). Both V1 and V2 crossings from the HP showed prominent similarities and intriguing differences (e.g., Table 1 of Krimigis et al. 2019).
2. ENA and Ion Energy Spectra in the Heliosheath
We present a unique combination of in situ ion and remotely sensed ENA measurements from three different missions and six instruments, namely, the Plasma Science (PLS), Low Energy Charged Particle (LECP), and Cosmic Ray Subsystem (CRS) experiments on the V2 spacecraft, as well as the IBEX mission and INCA on the Cassini mission (see the Appendix), over the time period from the beginning of 2009 to the end of 2016 (Figure 1). These measurements occur in the declining phase of Solar Cycle 23 (SC23; 2009–2012) and in the onset and ascending phase of SC24 (2013–2016).
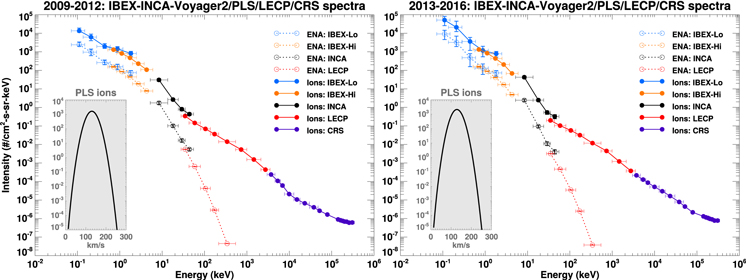
Figure 1. (Left) Average 110 eV to 55 keV ENA energy spectra from IBEX and INCA (blue, orange, and black dotted lines) in the pixels enclosing the position of Voyager 2 (IBEX-Lo: over 4°; IBEX-Hi: over 9°, and INCA: over 5°), together with the deduced H+ spectra (blue, orange, and black solid lines), and the 28 keV to 344 MeV ion energy spectra measured in situ by LECP and CRS on V2 (red and purple solid lines) from the beginning of 2009 to the end of 2012. The inlay indicates the 10 to 5950 eV ion intensities (in units of #/cm2 · sr · s · keV) as a function of radial velocity, using the average of the 2009–2012 plasma parameters derived from fits to the PLS data with an isotropic Maxwellian (thermal speed of ∼29 km s−1, bulk speed of ∼145.4 km s−1, and plasma density of ∼1.4 × 10⁻³ cm−3). The ∼28–540 keV LECP measurements are converted to ENAs (red dotted line) using LHS = 35 au and nH ∼ 0.12 cm−3. Horizontal bars indicate the instruments' energy passbands for H ENAs and ions. Details are explained in the text. (Right) The same as in the left panel, but for the time period from the beginning of 2013 to the end of 2016. Note that the Maxwellian distribution that corresponds to the PLS measurements for 2013–2016 is consistent with a thermal speed of ∼28.5 km s−1, bulk speed of ∼143.6 km s−1, and plasma density of ∼1.9 × 10⁻³ cm−3.
Download figure:
Standard image High-resolution imageSC23 exhibited a "deep" solar minimum in 2009–2010 when the sunspot numbers bottomed out and began a weak recovery thereafter. In correlation, there was approximately a factor of 2 change in the solar wind energy flux and dynamic pressure at ∼1 au (Sokol et al. 2015). The intensities of >5.2 keV ENAs and >28 keV ions in the HS have been shown to relate to the solar wind changes over the SC (with a ∼2–3 yr time delay), exhibiting a local minimum in early 2013 and a recovery thereafter (Decker et al. 2015; Dialynas et al. 2017a, 2017b; Rankin et al. 2019). Lower-energy ENAs (<6 keV) did not show a local minimum in ∼2013, and required more time to respond to the min-to-max pressure changes over the SC than higher-energy ENAs (e.g., McComas et al. 2020). However, a clear response to a large solar wind intensification in the upwind hemisphere (but not downwind), with a time delay of ∼2–3 yr, especially of the higher-energy ∼4.29 keV ENAs, has been reported (McComas et al. 2018a). The ENA and ion energy spectra in Figure 1 are representative of the HS conditions near solar minimum.
The ∼0.11–0.88 keV ENA energy spectra from IBEX-Lo are fairly consistent with a power law in energy (e.g., 2009–2012: J ∼ E−(1.5±0.2) and 2013–2016: J ∼ E−(2.1±0.3)), exhibiting a hardening break at ∼0.88 to 2 keV, matching the >0.52 keV ENA intensities from IBEX-Hi. The IBEX-Hi ENA energy spectra are also consistent with a power law (e.g., 2009–2012: J ∼ E−(1.7±0.03) and 2013–2016: J ∼ E−(2.0±0.02)). Several studies have shown that the spectral index is rather variable, pointing to the possibility of an "ankle" break beyond about 1.1 keV (e.g., Schwadron et al. 2011; Dayeh et al. 2012), especially toward the polar regions. At ∼5.2–55 keV energies, the ENA spectra from INCA become significantly softer, consistent with a power law (e.g., 2009–2012: J ∼ E−(3.5±0.2) and 2013–2016: J ∼ E−(4.2±0.2)), with a possible hardening break at ∼35–55 keV. This high-energy break is shown to be consistent with in situ ion measurements from LECP on V2 (Dialynas et al. 2019).
Assuming that all ∼0.11 to 55 keV ENAs shown in Figure 1 are due to charge-exchange (CE) interactions (Lindsay & Stebbings 2005) between heliosheath ions and an IS neutral H distribution of nH ∼ 0.12 cm−3, over a line of sight of LHS ∼ 35 au (measured HS thickness in the V2 direction), measured ENA intensities are convertible to ion intensities about the V2 pixel and vice versa (e.g., Krimigis et al. 2010; Dialynas et al. 2019). The assumed nH is consistent with the electron densities observed by the Plasma Wave (PWS) instruments on V1 and V2, at the order of ∼0.04–0.14 cm−3 (Gurnett et al. 2013, 2015; Gurnett & Kurth 2017; Kurth & Gurnett 2020), which are comparable to nH, assuming that the equilibrium ionization fraction is ∼50% for the LISM. This value is also consistent with the Dialynas et al. (2019) prediction and a new estimate for the TS region from Swacszyna et al. (2020).
The resulting ∼0.11 to 6 keV ENA-derived H+ spectra (IBEX-Lo and IBEX-Hi) follow the spectral breaks shown in the corresponding ENA spectra. However, the ∼5.2–55 keV ENA-derived H+ spectra from INCA are less steep than the corresponding >5.2 keV ENAs, but fit smoothly to the >28 keV spectra from LECP. The ion energy spectra from LECP on both V1 and V2 are consistent with a power law of γ ∼ −1.4 or a κ-distribution index of ∼−1.63 (e.g., Decker et al. 2005; Dialynas et al. 2019). In turn, those >28 keV ion spectra fit smoothly with the >3 MeV spectra from CRS, with roughly the same power law (especially the 2013–2016 data). The observed hardening break beyond about 100 MeV is most likely due to GCRs.
The conversions of the in situ ∼28 to 540 keV LECP ions (using LHS ∼ 35 au and nH ∼ 0.12 cm−3) result in ENA spectra that fit smoothly to the measured 5.2–55 keV INCA spectra, with comparable power-law slopes. ENAs at this particular energy range are not currently measured, but lie within the energy range of the upcoming IMAP-Ultra instrument (McComas et al. 2018b). The >55 keV ENA fluxes shown in Figure 1 are very low, but if the IMAP-Ultra observed a similar energy, this result would indicate that these ENAs are the result of CE interactions inside the HS. Differences among these ENA distributions from the ENAs shown in Figure 1 would require a search for an alternative source/mechanism. Nevertheless, the comparison of the IMAP-Ultra ENAs with the historic V1 and V2/LECP measurements would be of paramount importance and would provide important constraints for future modeling.
The shape of the ion energy spectra plays a critical role in determining the pressure balance and acceleration mechanisms inside the HS. Thus, the combined H+ spectra shown in Figure 1 provide an excellent summary of these processes on average. The intensities of the ∼10 eV to ∼6 keV ions from PLS are significantly lower than the corresponding IBEX-Lo ENA-derived H+ intensities at overlapping energies. The measured PLS ions are a result of a convected isotropic H+ Maxwellian distribution with bulk speeds that exceed the thermal speeds by a factor of ∼5 for both time periods in Figure 1. Thus, the portion of H+ with sufficient energy to return to the heliosphere as charge-exchanged ENAs is very small (Zirnstein et al. 2014). Perhaps this is the reason for the mismatch in intensities between the in situ PLS H+ and the IBEX-Lo ENA-derived H+ in overlapping energies, although the possibility of contributions to the <2 keV ENAs from CE interactions beyond the HP cannot be excluded.
The discovery of the HS by the Voyagers showed that the shocked thermal plasma downstream of the TS remained supersonic, with a substantial amount of the upstream energy density being transferred into heating the pickup ions and >15% being transferred to the >28 keV H+ (Richardson et al. 2008). The measurements in Figure 1 correspond to the period from ∼1.5 yr after the V2 TS crossing to ∼1.5 yr before the HP crossing. In that sense, these prominent hardening and softening breaks in the H+ distributions are characteristic throughout the HS, from the TS to the HP. Earlier simulations showed that the shape of the ion spectra upstream of the TS are due to an accelerated "core" IS PUI distribution at the TS, through shock drift acceleration and particle scattering in the vicinity of the shock (Giacalone & Decker 2010).
At higher energies (>3 MeV), the hardening break that occurs beyond ∼10 MeV in 2009–2012 may be related to a local disturbance at V2 that was caused by a global merged interaction region (GMIR) that likely crossed through the HS (Rankin et al. 2019), as suggested by Richardson et al. (2017). It should be noted, however, that the ACR spectrum evolved substantially from 2007 through at least the end of year of 2010 and the beginning of 2011. In other words, the ACR spectrum was not the expected power law at the shock in 2007, but unfolded as V2 traveled through the HS.
The measurements shown in Figure 1 provide invaluable constraints for future ENA global heliosphere models. Future analyses that focus on various directions in the sky that are within the limits of the Solar and Heliospheric Observatory (SOHO) obervation regions (e.g., Czechowski et al. 2018) can also incorporate the 58–88 keV ENA data from SOHO/High-energy Suprathermal Time Of Flight (HSTOF) as shown in Hsieh et al. (2010) (see also the Appendix).
3. Discussion
The extended energy range of the measurements in Figure 1 (∼10 eV to 344 MeV) provide the opportunity to obtain the total pressure inside the HS, in the direction of V2. After the V1 and V2 respective crossings of the TS, it was found that the HS pressure is dominated by PUI and suprathermal particles. Here we adopt the equation for pressure (second-order moment of velocity distribution function) and underlying assumptions made in Dialynas et al. (2019). The resulting pressures in Figure 2 are used to investigate the pressure balance at the interaction region between the HS and the LISM. Although the >5.2 keV ENAs from INCA are sourced from the HS, the origin of <6 keV ENAs from IBEX (especially from IBEX-Lo) is perhaps due to a combination from both the HS and an external source. For this exercise, we focus on the measured 2013–2016 spectra (5.5–1.5 yr before the V2 HP crossing) and assume that all ENAs in Figure 1 are due to charge-exchange interactions inside the HS.

Figure 2. (Left) The 10 eV to 344 MeV H+ pressures as a function of energy inside the heliosheath, for each different experiment considered in this study, namely IBEX-Lo, IBEX-Hi, INCA, V2/PLS, V2/LECP, and V2/CRS derived from the measurements shown in Figure 1, using LHS = 35 au and nH ∼ 0.12 cm−3 over the time period from the beginning of 2009 to the end of 2012. Horizontal bars indicate the instrument energy ranges. (Right) The same as in the left panel, but for the time period from the beginning of 2013 to the end of 2016.
Download figure:
Standard image High-resolution image
The plasma measurements from PLS over this time period correspond to PPLS ∼ 0.0013 pPa. Because of the substantial overlap in energies between the IBEX-Lo and IBEX-Hi, here we use the ∼0.11 to ∼0.44 keV partial pressure from the first three channels of IBEX-Lo, and the rest of the partial pressure from energies ∼0.52 to 6 keV from IBEX-Hi. The IBEX-Lo and IBEX-Hi fluxes (see Figure 1) in this energy range are in reasonable agreement, implying that this separation is unlikely to cause a substantial uncertainty. Therefore, P0.11–0.44keV ∼ 0.105 pPa and P0.52–6keV ∼ 0.085 pPa, consistent with the pressures calculated by Schwadron et al. (2014) and McComas & Schwadron (2014).
At higher energies, the 5.2–24 keV partial pressure from INCA is P5.2–55keV ∼ 0.037 pPa, whereas the partial pressure from V2/LECP is P28–3,500keV ∼ 0.0097 pPa. The partial pressure in the CRS energy range is P3–344MeV ∼ 0.0078 pPa, whereas the magnetic field pressure in the V2 direction is much smaller, i.e., PMAG ∼ 0.005 pPa, on average (Dialynas et al. 2019). Thus, the overall (isotropic) pressure in the heliosheath in the direction of V2 is calculated by adding the aforementioned partial pressures, i.e., PHS ∼ 0.251 pPa. Recent calculations (Rankin et al. 2019) using data-driven models and observations from IBEX (Schwadron et al. 2014) resulted in a total effective pressure of 0.267 ± 0.55 pPa, consistent with the total pressure calculated here from the combination of remote ENA and in situ ion measurements.
These measurements show that PUIs and suprathermal particles provide a substantial amount of pressure inside the HS. Specifically, ∼41.9%, ∼33.8%, ∼14.7%, ∼3.9%, and ∼3.1% of the total pressure inside the HS are due to the ∼0.11–0.44 keV, ∼0.52–6 keV, ∼5.2–55 keV, ∼28–3,500 keV, and ∼3–344 MeV ions, respectively. Both the thermal component from PLS and the magnetic field pressures have a small contribution to the total pressure inside the HS, i.e., ∼0.52% and ∼2%, respectively. Earlier calculations of the plasma beta (β = Pparticle/PMAG) using the V2/LECP measurements (Decker et al. 2015) showed that it remained well above unity throughout the HS, exhibiting large fluctuations about an average of ∼5 that are due to variations in B through the HS. The inclusion of >5.2 keV measurements from INCA (Dialynas et al. 2019) showed that β in the direction of V2 was >10 on average, reflecting the substantial role played by pickup protons and suprathermal particles in maintaining pressure balance in the HS (Decker et al. 2008; Richardson et al. 2008; Krimigis et al. 2010). The inclusion of measurements from IBEX and CRS in this study demonstrates that β ∼ 49.2. Although such specific calculations have not been performed yet toward the direction of V1, due to the consistency in the LECP spectra between V1 and V2, we do not expect β in V1 direction to be substantially different. Therefore, the upwind HS is a high-pressure region that exhibits diamagnetic behavior (Krimigis et al. 2009; Dialynas et al. 2017a).
Despite possible adiabatic cooling throughout the HS, the PHS ∼ 0.251 pPa would be carried out to the HP. Also, in our simplified method we assume that the thermal ram pressure will not affect the force balance at the HP because there should be no flow across an ideal HP (Krimigis et al. 2010). Following the assumptions and simplifications explained in Dialynas et al. (2019), adding also the pressure from GCRs in the upstream medium (Stone et al. 2019), we estimate that due to the pressure balance at the HP (PISMF ∼ PHS - [PIS(thermal) + PIS(dynamic) + PGCR]), the required IS magnetic field strength in order to balance the calculated PHS is BISMF ∼ 0.67 nT. Here we should highlight that this value corresponds to the magnetic field strength at the interaction region, i.e., just upstream of the HP, and that this number is the result of a rough estimate of the pressures inside the heliosheath and subject to parameters that are not accurately known in the upstream medium. Nevertheless, our estimate is consistent with the measured magnetic field in the direction of V2 after the HP crossing, i.e., ∼0.68 ± 0.03 nT (Burlaga et al. 2019) and is also consistent with the predicted magnetic field upstream of the HP that is derived from recent sophisticated modeling (Opher et al. 2020).
Our estimated value does not necessarily reflect the magnetic field strength at very large distances from the HP, but due to the presence of a possible plasma depletion layer immediately upstream of the HP (Fuselier & Cairns 2013; Cairns & Fuselier 2017), BISMF, may be a factor of 2 lower. Notably, the magnetic field strength in V1 exhibited very little change to ∼25 au past the HP (Burlaga et al. 2020).
Previous analyses using the 0.52 to 6 keV ENAs from IBEX-Hi have shown that the ribbon is consistent with the locus of directions where the draped IS magnetic field is perpendicular to a radial line of sight from the Sun and IBEX (Schwadron et al. 2009; McComas et al. 2020). Further, previous estimates of the IS magnetic field upstream of the HP using the ∼5.2–55 keV ENAs measurements from INCA over the 2003–2009 (Krimigis et al. 2010) and 2013–2016 (Dialynas et al. 2019) predicted a BISMF < 0.6 nT along the V1 direction and BISMF > 0.5 nT along the V2 direction, respectively. Both predictions are consistent with observations (Burlaga & Ness 2016; Burlaga et al. 2019) of BISMF after the V1 and V2 crossings of the HP. The measurements presented here not only provide invaluable insights on the pressure balance and acceleration processes inside the HS, but the combined use of ENAs from IBEX and INCA, together with plasma and suprathermal ions from V2 and V1, can be used to infer critical quantities in the upstream medium.
4. Summary
We reported on a unique combination of ∼10 eV to ∼344 MeV in situ ion measurements from the V2/PLS/LECP/CRS experiments, and remotely sensed ∼110 eV to ∼55 keV ENA measurements from the IBEX and Cassini missions, over the time period from 2009 to the end of 2016, along the V2 trajectory.
The ENA spectra were converted to ions using nH = 0.12/cm−3 and LHS = 35 au, and the resulting ∼10 eV to 344 MeV spectra are indicative of the conditions around solar minimum, showing a series of softening and hardening breaks at various energies that are consistent with the fact that the bulk of the solar wind energy density upstream of the TS went into heating the pickup ions and suprathermal particles (Richardson et al. 2008; Decker et al. 2008). At >∼100 MeV, the shape of the energy spectra is consistent with modulation from GCRs. The conversion of ∼28–540 keV ions from LECP to ENAs showed that the resulting distributions fit smoothly to the ∼5.2–55 keV ENAs from Cassini/INCA. These ENAs are expected to be measured from the IMAP mission.
With the assumption that all ENAs from ∼110 to 55 keV are due to CE interactions inside the HS, we show that ions in the <6 keV energy range dominate the total pressure distribution, but the ions at ∼5.2 keV to 344 MeV provide a significant contribution to the total pressure. We estimate a total PHS ∼ 0.251 pPa that would be carried out to the HP. The magnetic field upstream of the HP required to balance PHS in the direction of V2 is ∼0.67 nT. This value is consistent with the magnetic field measured immediately upstream of the HP from V2 (Burlaga et al. 2019).
This work was supported by the NASA Drive Science Centers initiative, under contract 80NSSC20K0603-18-DRIVE18_2-0029 in BU SHIELD DRIVE Science Center (http://sites.bu.edu/shield-drive/). The authors are grateful to all Cassini/MIMI, Voyager/LECP/PLS/CRS, and IBEX team members for useful discussions that made this work possible. The work at JHU/APL was supported also by NASA under contracts NAS5 97271, NNX07AJ69G, and NNN06AA01C and by subcontract at the Office for Space Research and Technology. The work at Caltech was supported by NASA award NNN12AA01C. J.D.R. was supported by NASA contract 959203 from JPL to MIT and NASA HGI 80NSSC19K0260.
Appendix: Data and Experiments Details
The in situ ions within the energy range of ∼10 eV to ∼344 MeV shown in Figure 1 are collected from three different experiments on Voyager 2, namely, (1) the PLS experiment (Bridge et al. 1977) that consists of three Faraday cups, arrayed about an axis of symmetry and have pentagonal apertures and collectors, and a fourth, circular-shaped Faraday cup pointing 88° from the main sensor symmetry axis, taking measurements of ions and electron currents with energies/charge from ∼10 to ∼5950 eV/q every 192 s, providing the plasma speed, density, and temperature through fits to an isotropic Maxwellian distribution (e.g., Richardson et al. 2008; Richardson & Decker 2014); (2) the LECP experiment (Krimigis et al. 1977), utilizing two distinct all solid-state detector configurations (LEMPA and LEMPT), that measures differential intensities of ions with energies of 28 keV to ∼60 MeV/Nuc and of electrons with energies of 26 keV to >10 MeV (together with an integral ion measurement >211 MeV), determines the composition of ions with energies of >200 keV/Nuc, and provides angular information via a mechanically stepped platform (e.g., Krimigis et al. 2003, 2013; Decker et al. 2005, 2015), thus allowing determination of energetic ion flow anisotropies; and (3) the CRS instrument (Stone et al. 1977) that consists of three independent systems resolving the energy spectrum of electrons from ∼3–110 MeV and the energy spectra and elemental composition of all cosmic-ray nuclei from hydrogen through iron over an energy range from ∼1–500 MeV/nuc, whereas the isotopes of hydrogen through sulfur are resolved from ∼2–75 MeV/nuc (e.g., Cummings et al. 2016).
Charge exchange between ions and the neutral hydrogen gas flowing through the HS generates the ENAs that can be imaged by remote sensing systems on board spacecraft (e.g., Krimigis et al. 2009; McComas et al. 2009a). The ENAs within the energy range of ∼110 eV to 55 keV in Figure 1 are measured from two different missions, namely, (1) the IBEX mission (McComas et al. 2009b) at ∼1 au that carries two high-sensitivity, single-pixel ENA cameras: (i) the IBEX-Lo (Fuselier et al. 2009) taking measurements from ∼10 eV to ∼2 keV (e.g., Galli et al. 2016), and (ii) IBEX-Hi (Funsten et al. 2009) that measures ENAs from ∼520 eV to ∼6 keV (e.g., Table 3; Qualified Triple-Coincidences in McComas et al. 2014); and (2) INCA (Krimigis et al. 2009), part of the Magnetospheric Imaging Instrument (MIMI; Krimigis et al. 2004) on board the Cassini spacecraft, in orbit around Saturn, at ∼10 au (from 2004 July 1 to mission end, 2017 September 15), which was a large geometry factor (G ∼ 2.4 cm2 · sr) detector, utilizing a broad field of view (FOV) of 90° in the nominal Cassini roll direction and 120° in the direction perpendicular to the spacecraft roll plane, that analyzes separately the composition (H and O groups), velocity, and direction of the incident ENAs, based on the time-of-flight (TOF) technique through four discrete energy passbands within the energy range of ∼5.2 to 55 keV (e.g., Dialynas et al. 2017a, 2019).
The IBEX-Hi (Ram-only direction; data release 16; survival probability and Compton–Getting corrected; McComas et al. 2020) and IBEX-Lo intensities shown in Figure 1 are carefully sampled about the V2 pixel, avoiding areas in the sky that include the "ribbon" (that is formed outside the HP) and have been corrected for the energy-dependent survival probability of ENAs with the Bzowski (2008) method (ionization rate model shown in Sokol et al. 2020 and radiation pressure model shown in Kowalska-Leszczyńska et al. 2020), and for the proper motion of the IBEX spacecraft relative to the Sun, i.e., the Compton–Getting (CG) effect (Compton & Getting 1935). These corrections are particularly important for the IBEX-Lo measurements (Galli et al. 2016, 2017). The effects of radiation pressure on ENAs with energies of a few hundred electronvolts and above are negligible (Dayeh et al. 2012) and become insignificant for the >5.2 keV neutrals that INCA measures. In addition, loss effects of IBEX-Hi ENAs from their source to 1 au are very small, at the order of ∼10% (McComas et al. 2010; Dayeh et al. 2012), whereas the ENA emission at >5.2 keV becomes essentially optically thin (Dialynas et al. 2017a). The Compton–Getting effect does not exceed ∼15% (on average) at >500 eV ENA energies (Dayeh et al. 2012), whereas Roelof et al. (2012) and Dialynas et al. (2019) showed that consideration of the Compton–Getting factor has a minimal effect in the >5.2 keV ENA and ion intensities.
Overviews of the ENA and ion measurements in the V2 direction, shown in Figure 1, can be reviewed in earlier publications (e.g., Richardson & Decker 2015; Richardson et al. 2017; Decker et al. 2015; Dialynas et al. 2017a; Rankin et al. 2019; McComas et al. 2020).
We note that HSTOF on SOHO is providing measurements of 58–88 keV ENAs from the heliosphere since the year 1996. However, after the year 2005 only the flank regions were accessible to observations, whereas the V2 (and V1) trajectories inside the heliosheath were outside the ecliptic latitude limits of the HSTOF observation region (details in Czechowski et al. 2018). Thus, the 58–88 keV ENA measurements from SOHO/HSTOF are not included in our study (e.g., Figure 1) that is focused on the ENA and ion measurements about the V2 pixel from the beginning of 2009 to the end of 2016.