


Abstract
We examine the release times of energetic electrons in the 2001 April 25 event. An M2.7 flare occurred on 2001 April 25, from AR 09433, located at N18W09. The flare was observed in X-rays by GOES and the Yohkoh spacecraft. The Yohkoh observation also included hard X-ray (HXR) images for all four energy channels: L, M1, M2, and H. We use Yohkoh observation times as a proxy for the release time of energetic electrons that propagated downward, which are responsible for the HXRs. In situ >∼25 keV electrons were observed by the Wind spacecraft. For these electrons, we obtain the release time at the Sun using the recently developed Fractional Velocity Dispersion Analysis method. We find that the release times of outward-propagating energetic electrons are clearly delayed from those that propagated downward. Furthermore, these delayed releases are energy dependent. The implication of this delay on the underlying acceleration and trapping process of the >∼25 keV electrons at solar flares is discussed.
Export citation and abstract BibTeX RIS
1. Introduction
Understanding the acceleration mechanism in solar flares has been a central topic of solar physics. Both solar flares and coronal mass ejections (CMEs) are acceleration sites of solar energetic particles (SEPs; Neupert 1968; Reames 2015). In most impulsive SEP events, however, CMEs are either absent or small and the underlying acceleration site is believed to be at a localized and short-lived current sheet where magnetic reconnection occurs. Magnetic reconnection converts magnetic energy to other forms of energy, leading to plasma heating and efficient acceleration of both electrons and ions to nonthermal energies.
In the standard flare model (aka CSHKP model; Carmichael 1964; Sturrock 1966; Hirayama 1974; Kopp & Pneuman 1976), magnetic reconnection occurs during a solar eruption, and ions and electrons can be accelerated to high energies and propagate along the reconnected field lines. These energetic electrons, when precipitating to the solar surface, generate hard X-rays (HXRs). However, in the standard flare model, upward-accelerated electrons are "trapped" in closed loops, and cannot propagate to 1 au unless they access open field lines through either interchange reconnection or cross field diffusion. Masson et al. (2013) addressed this trapping and escaping issue by noticing that in the breakout model, there exists intrinsic external interchange magnetic reconnection, which is a byproduct of the CME initiation, and which can provide a natural explanation for escape of flare-accelerated energetic particles onto an open field.
An interchange reconnection provides a convenient site of particle acceleration as well as simultaneous access to both closed and open fields, so it is natural to consider interchange reconnection as the driver of solar flares. Indeed, exploration of such an idea dates back to the 1970s by Heyvaerts et al. (1977), who not only pointed out that an interchange reconnection is crucial for the observation of in situ energetic electrons, but also associated the outward-propagating energetic electrons to type III radio bursts. More recently, further refinements along this line have been pursued by Vršnak et al. (2003) and Krucker et al. (2007). If electrons are accelerated at an interchange reconnection site, then an immediate conclusion one can draw is that the release of the downward and upward energetic electrons from the acceleration site are simultaneous. This differs from the standard flare model. Therefore, strong constraints about the underlying acceleration mechanism can be obtained by examining the relative delay between the release times of the downward- and upward-propagating electrons at the Sun. Often the release time of the downward-propagating electrons can be accurately determined through observations of the resulting HXRs, so an accurate determination of the release time of the upward-propagating electrons is crucial for obtaining the time delay.
In obtaining the release times at the Sun of in situ energetic electrons, the traditional velocity dispersion analysis (VDA) has often been used where both the path length of electrons and the release time at the Sun (e.g., Krucker et al. 2007) are obtained. The VDA assumes that electrons of different energies are released simultaneously at the Sun and that the first arriving electrons observed at 1 au experience little pitch angle scattering and can be regarded as free streaming. While the free propagation of first arriving electrons can be somewhat justified (Wang et al. 2006, 2011), the assumption of a simultaneous release for electrons of different energies at the Sun can be problematic. Indeed, Wang et al. (2016) found a delay of high-energy electrons comparing to low-energy electrons in selected events. The VDA also suffers many other complications, such as the identification of the background level, the determination of the onset time, and the contamination of low-energy channels by electrons of high energies. To address these complications, recently, a fractional velocity dispersion analysis (FVDA) has been developed by Zhao et al. (2019). Comparing to the traditional VDA, the FVDA makes use of the entire rising phase and therefore provides more robust estimates of the path length and the release time of energetic electrons at the Sun. We use the FVDA in this work. We also use Yohkoh observation as a proxy of the release time of downward-propagating electrons.
We report in this Letter, by combining in situ Wind/3DP electron measurements and Yohkoh HXR measurements, a direct comparison of the release times between the downward-precipitating electrons and those upward-escaping electrons for the 2002 April 25 event.
2. Observations
The event we study is an M2.7 flare. It occurred in AR 09433 on 2001 April 25 13:36:40 UT.
Figure 1 shows the Solar and Heliospheric Observatory/EIT image and the Michelson Doppler Imager (MDI) magnetogram of active region (AR) 09433 before the eruption at time 13:36 UT and 12:48 UT. From the figure we can see that AR 09433 was near the center of the disk and lies on the northern hemisphere. It was complex and large. From the EIT movie (not provided here), one can spot postflare brightening near the western boundary of the AR.

Figure 1. The EIT and MDI image of AR 09433 before the eruption. Postflare brightening can be seen at the western edge of the AR.
Download figure:
Standard image High-resolution imageFigure 2 shows the HXR observations from Yohkoh and soft X-ray from GOES. The five left panels are hard and soft X-ray time profiles between 13:30 and 14:00 UT. The top four panels are HXR time intensities from Yohkoh/HXT. These are for the four energy channels of L, M1, M2, and H, covering a photon energy range from 14 to 100 keV (Kosugi et al. 1991). The bottom panel is from GOES soft X-ray. Note that the soft X-ray emission detected by GOES is produced by thermal plasma. Based on a simple energy argument (e.g., Veronig et al. 2005), there exists an empirical Neupert effect (Neupert 1968). Namely, the time derivative of the soft X-ray flux, representing the change rate of the thermal energy content of the radiating plasma, is often temporally correlated with the HXR flux, representing the instantaneous rate of energy deposition to the plasma by HXR-producing electrons. This effect is indeed present in our case, with the time derivative of the 1–8 Å channel (blue dotted line in Figure 2) agrees reasonably well with the HXR flux, especially the L channel.
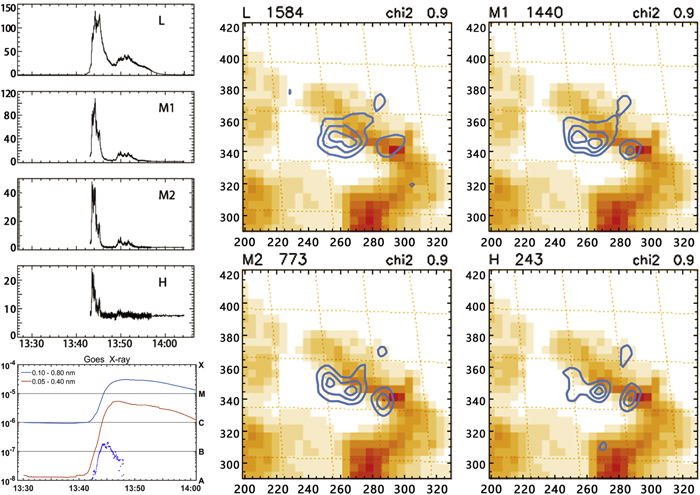
Figure 2. Left: top four panels are hard X-ray time intensity from Yohkoh/HXT for the 2001 April 25 event (between 13:30 and 14:00 UT); the bottom panel is the GOES soft X-ray time profile for the same time period. The four energy channels of Yohkoh/HXT are L (15–24 keV), M1 (24–35 keV), M2 (35–57 keV), and H (57–100 keV). Right: HXR imaging for the four energy channels between 13:43:25 UT and 13:43:44 UT, overlaid on the soft X-ray image taken at 13:36:40 UT. The contour levels are 12.5%, 35%, and 70% of the maximum brightness.
Download figure:
Standard image High-resolution imageThis is a very typical impulsive flare. All four HXR channels registered clear increases. As HXRs are produced by electron bremsstrahlung (mainly in the thick-target chromosphere), their energy range is comparable to that of their parent electrons. From the figure we can see that all four energy channels show a similar start time, suggesting that electrons precipitating back to the solar surface are instantaneously accelerated to energies ∼100 keV. The duration of the HXR signal for the H channel is very short, about 2 minutes. For the M1 and M2 channels, there were the initial impulsive peaks, lasting ∼3 minutes and then there was another peak of much lower intensities. This is also true for the L channel. However, the L channel also responds to soft X-rays. So for this work, we focus on the M1, M2, and H channels. Furthermore, we will focus on the first peak. Using the data from the H channel, we can approximate the start of the release of the downward-propagating electrons from the flare site to be 13:43:26 UT, and the duration to be 2.5 minutes.
In the right panels of Figure 2, contour plots of the HXR intensity for the four energy channels between 13:43:25 UT and 13:43:44 UT, overlaid on the soft X-ray image taken at 13:36:40 UT, are shown. The contour levels are at 12.5%, 35%, and 70% of the maximum brightness. The number of photons detected in the four channels are 1584, 1440, 773, and 243, respectively. The chi-squared fitting is a measure between the synthetic image and the observation with a value close to 1 indicating a good agreement between the synthetic image and the observation. In all channels, three bright HXR spots can be identified. Further examination of the HXR imaging is not the focus of this work. The main conclusion we draw from Figure 2 is the relative short duration of the HXR, which is from 13:43:26 UT to 13:46:00 UT. Note that this is the time as observed by Yohkoh, so the corresponding time at the Sun is 13:35:06 UT to 13:37:40 UT.
Next we examine the in situ electrons as observed by Wind/3DP using the FVDA. The essence of the FVDA is to perform the VDA analysis for multiple points identified in the rising phase with the flux being a fraction, η, of the peak flux. The left panel of Figure 3 shows intensity profiles of energetic electrons observed by Wind/3DP at E = 27, 40, 66, 109, and 182 keV, respectively. This event was included in the survey of Zhao et al. (2019). The profile is of a typical impulsive event, and it is one of the cleanest events listed in Zhao et al. (2019). The rising phases of the time profiles for all five energy channels (E ≤ 182.4 keV) are very similar, making it an ideal event for applying FVDA. In calculating η, the background flux has to be identified. The periods highlighted in green in the left panels denote the periods from which the background fluxes are obtained. Three reference points corresponding to η = 0.6, 0.4, and 0.2 are shown as a filled triangle, circle, and square in the plots. The fittings to obtain the path lengths for three η are shown in the upper three panels in the right column. The resulting path lengths are 1.0 ± 0.03, 1.08 ± 0.05, and 1.18 ± 0.06 au, respectively. One can apply the FVDA to multiple η. The bottom panel in the right column shows the path length L(η) (with uncertainties) as a function of η (η ranges from 0.15 to 0.75). The calculated path length using the onset times (η = 0) from Equation (1) is represented by the green open circle.
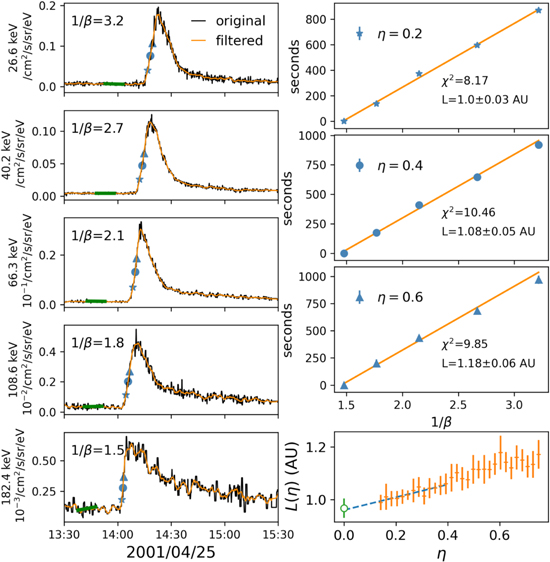
Figure 3. Left: time intensity profiles of energetic electrons by Wind/3DP at E = 27, 40, 66, 109, and 18 keV. These energies correspond to 1/β = 3.2, 2.7, 2.1, 1.8, and 1.5, respectively. The period highlighted in green in each panel denotes the periods from which the background fluxes are obtained. Three reference points corresponding to η = 0.6, 0.4, and 0.2 are shown as a filled triangle, circle, and star. Right: the fitted path lengths for three η are shown in the top three panels. The bottom panel shows the path length L(η) (with uncertainties) as a function of η (η ranges from 0.15 to 0.75). The calculated path length using the onset times (η = 0) from Equation (1) is represented by the green open circle.
Download figure:
Standard image High-resolution imageNote that the first arriving electrons correspond to η = 0. However, the presence of the background electrons makes the determination of the onset time very hard. To obtain the path length at η = 0, one can either take the limit of  to obtain
  , or to approximate η as a polynomial in time, i.e.,

where to is the true onset time, corresponding to η = 0. If, η, as a function of t, is continuous and its derivative with respect to t is also continuous, then (dη/dt) = 0 at t = to, so a1 = 0. Using multiple pairs of  , one can fit the parameters ai and to in Equation (1). Once to is obtained for multiple electron energies, one can then fit them in the
  plot to obtain the path length L at η = 0 and the release time at the Sun. The onset minutes and seconds (MM:SS) obtained using Equation (1) are 14:21 ± 00:11, 10:02 ± 00:03, 05:51 ± 00:18, 02:09 ± 00:08, and 00:48 ± 00:20 at hour 14, 2001 April 25, for energies 27, 40, 66, 109, and 182 keV, respectively. Note that we have applied corrections for contamination due to high-energy electrons scattering out and depositing only part of their energy in the silicon semiconductor telescopes of Wind/3DP, following Wang et al. (2006).
We have used both methods to obtain L when  and the results are consistent. We find

This is shown in the bottom right panel of Figure 3.
A physically meaningful path length should be larger than 1 au, so the path length in Equation (2) is a sign that some assumptions we made in the FVDA are invalid. One primary reason for obtaining a path length smaller than 1 au is the assumption of simultaneous releases of high- and low-energy electrons at the Sun. If the release times for higher-energy electrons are later than lower-energy electrons, one finds larger path lengths, which are more physical. This suggests that we can invert the above process and obtain the electron release times at the Sun as a function of energy by assuming a physical path length.
For a given path length, the release time tr of particles at the Sun can be computed from

where to is the in situ onset time,  is electron speed, and L is the path length. Using a 1 day pre-event average solar wind speed of Vsw = 443 km s−1, the nominal Parker field path length is 1.15 au. Figure 4 plots the release time at the Sun for three different path lengths. The left panel corresponds to L = 1.5 au, the middle panel corresponds to L = 1.15 au, and the right panel corresponds to L = 1.0 au.

Figure 4. Calculated release time tr from Equation (3) at the Sun for different electron energies. From left to right, the path lengths are 1.5 au (plotted in black), 1.15 au (plotted in blue), and 1.0 au (plotted in red). Green and gray shaded areas represent the onset-to-peak and peak-to-end phases of the hard X-ray for the H channel.
Download figure:
Standard image High-resolution image
A path length of L = 1.5 au is much larger than both the inferred path length of  and the nominal Parker field path length L = 1.15 au. It therefore represents an extreme case. As shown in Zhao et al. (2019), a large fraction of impulsive events have their inferred path length close to 1.2 au, with an uncertainty of
  . At the time of eruption, AR 09433 is located at the western ∼10° in longitude. If the footpoint at the source surface has a similar longitude to the AR itself, then the field line connecting the AR to the Earth has to be non-Parker and is possibly smaller than 1.15 au. However, the coronal magnetic field can be very complicated and the AR longitude can differ significantly from that of the footpoint at the source surface (Zhao & Zhang 2018). Both footpoint motion and interplanetary turbulence can lead to a non-Parker field, and the path length of energetic electrons propagating along these non-Parker fields can differ from those of the field lines themselves (see, e.g., Laitinen et al. 2018; Moradi & Li 2019).
The HXR observations indicated that the downward-propagating electrons started at 13:35:06 UT and end 13:37:40 UT. Since the flare site is very close to the solar surface, we can safely regard these times as the release time of the downward energetic electrons from the acceleration site. If we assume the path length to be 1.5 au, as shown in the left panel of Figure 4, then the release times of upward E = 26 keV electrons, which is 13:34:15 UT, is similar to 13:35:06 UT, the beginning of the HXR. However, the release time of upward E = 66 keV electrons, which is 13:39:03 UT, is already after the ending time of HXR, which is 13:37:40 UT. The release times of 108 and 182 keV electrons are further delayed. Clearly, the simple interchange reconnection scenario, as advocated by Heyvaerts et al. (1977), where the upward- and downward-propagating electrons are released from the flare site at the same time needs to be revised. One straightforward revision of the interchange reconnection scenario is to introduce delays that account for possible trapping. These delays indicate an energy-dependent trapping, where electrons of higher energies are somehow trapped for a longer period before they get access to the open field lines. A more efficient trapping for high-energy electrons can be counterintuitive since higher-energy electrons have larger gyroradii and one may expect that it is relatively easier for them to escape than lower-energy electrons. Another possibility of these delays is due to acceleration. If the downward and upward energetic electrons are accelerated at different locations by different mechanisms, then unlike the downward-propagating electrons, which have an energy-independent release, the upward-propagating electrons can have an energy-dependent release due to an energy-dependent acceleration. For example, shock acceleration can lead to a natural delay for high-energy electrons.
If we assume the path length to be 1.15 au, representing a nominal Parker field, then the release times at the Sun are shown in the middle panel of Figure 4. These release times are for E = 27 keV electrons, 13:43:37 UT; for E = 40 keV electrons, 13:44:33 UT; for E = 66 keV electrons, 13:45:18 UT; for E = 109 keV electrons, 13:45:15 UT; and for E = 182 keV electrons, 13:46:40 UT. Clearly, these times are significantly later than the HXR end time of 13:37:40 UT. Therefore, we again find that the upward-propagating energetic electrons and the downward-propagating energetic electrons are two distinct populations.
Finally, if we assume the path length to be 1.0 au, then the release times at the Sun are shown in the right panel of Figure 4. These release times are 13:47:37 UT for E = 27 keV electrons, 13:47:52 UT for E = 40 keV electrons, 13:47:59 UT for E = 66 keV electrons, 13:47:28 UT for E = 109 keV electrons, and 13:48:30 UT for E = 182 keV electrons. Again, these times are significantly later than the HXR end time of 13:37:40 UT.
In any case, we find that the upward-propagating energetic electrons and the downward-propagating energetic electrons are of two distinct populations. Furthermore, the upward-propagating electrons are subject to both acceleration and trapping with respect to the downward-propagating energetic electrons.
One can use the release time of E = 27 keV electrons as a reference and compute the delay time as a function of electron energy,

where we have expressed the delay as two parts: (1) acceleration time difference, and (2) trapping time differences, between electrons of energy E and 27 keV electrons. Considering the case of a path length L = 1.15 au, we find a Δt to be 8 minutes and 6 s between 182 keV electrons and 26 keV electrons. Such a delay and its energy dependence can be used to constrain the underlying acceleration and trapping mechanisms.
3. Discussion and Conclusions
In this Letter, we examined the release times of energetic electrons in the 2001 April 25 prompt flare event. Using the recently developed FVDA method, we show, unambiguously, that the HXR-generating electrons and energetic electrons observed in situ are two distinct populations. The HXR-generating and downward-propagating electrons were released from the acceleration site earlier than the upward-escaping electrons and the former has an energy-independent release while the latter has an energy-dependent release. Whether or not that this conclusion is true for other prompt flare events remains to be seen.
Previously Krucker et al. (2007) compared HXR photon spectra observed by the RHESSI with those observed in situ near 1 au by Wind/3DP. They found that there are two kinds of flare events. The first kind is often prompt, and the inferred injection time at the Sun using the VDA method coincides with the HXR burst and/or type III bursts. The second kind often have prolonged HXR duration ( minutes), and the release of in situ electrons is delayed by
  minutes. For the prompt events, Krucker et al. (2007) found that the HXR photon power-law spectral indexes have a good linear correlation with those of the observed in situ electron spectral indexes, suggesting that these two populations are intimately related. One mystery noted by Krucker et al. (2007) is that the derived total number of escaping electrons is only about
  of the number of HXR-producing electrons.
However, the determination of the release time of in situ electrons in Krucker et al. (2007) was done using the VDA method. As we pointed out, the VDA method has a large uncertainty. Furthermore, the VDA method suffers an intrinsic problem, which is its assumption that electrons of all energies are released at the same time. In the work of Wang et al. (2012), it has been shown that the release of electrons at the Sun can be energy dependent.
The event we examine here is a prompt event, with a very short HXR duration. Nevertheless, using the FVDA method, we find that the release of in situ electrons are delayed from those downward-propagating, HXR-generating electrons, and are energy dependent. These findings indicate unambiguously that the upward- and downward-propagating electrons are two distinct populations. If the upward- and downward-propagating electrons are two distinct populations, they do not need to be related, and in particular, their spectral indices do not need to be correlated.
The scenario as advocated by Heyvaerts et al. (1977), and later extended by Krucker et al. (2007), consisting of simple interchange reconnection, needs to be revised. Scenarios that naturally contain delays and interchange reconnection have been proposed by Vršnak et al. (2003). However, in that scenario, the release of outward-propagating electrons is not energy dependent. In our analysis, as shown in Figure 4, the release of the outward-propagating energetic electrons is clearly energy dependent. So, besides the interchange reconnection, which provides an access to open field lines, the outward-propagating electrons should also go through a further acceleration and trapping process. It is possible that the turbulence in the flare provides the required trapping. A recent paper by Effenberger & Petrosian (2018) examined the trapping and escaping process using a numerical method. Their results show that besides scattering by turbulence the field line convergence toward the acceleration boundary can affect the escaping of electrons from the acceleration region. The escaping can also be strongly affected by the initial pitch angle distribution of the energetic electrons. Shock acceleration is another promising candidate. Unlike gradual SEP events where the CME is more massive and energetic, the CMEs in impulsive events can be of small scale and the shock does not need to be very strong.
In two previous studies, Haggerty & Roelof (2002) and Haggerty et al. (2003) examined 5 yr worth electron events from Advanced Composition Explorer (ACE) observation. By assuming a fixed 1.2 au path length, they obtained the release times (they used the highest-energy channel) of near-relativistic electrons for over 70 events. They compared the release times with the HXR start time and found a 10–20 minute delay. Although they did not obtain the path lengths for individual events, our case study reported here agrees with their statistical conclusion. Note that the distribution of path length obtained in Zhao et al. (2019) does imply that an assumption of a 1.2 au path length is reasonable. Further studies of other events using the FVDA method will be reported in the future.
This work is supported in part by NASA grants 80NSSC19K0075 and 80NSSC19K0079 at UAH; 80NSSC19K0076, 80NSSC18K0644, 80NSSC20K0286, and 80NSSC20K0298 at FIT. L.W. is supported in part by NSFC under contracts 41774183, 41861134033. This work made use of the Yohkoh Legacy data Archive at Montana State University, which is supported by NASA. Support by ISSI and ISSI-BJ through the international teams 469 and 425 is also acknowledged.