


Abstract
Even though tens of directly imaged companions have been discovered in the past decades, the number of directly confirmed multiplanet systems is still small. Dynamical analysis of these systems imposes important constraints on formation mechanisms of these wide-orbit companions. As part of the Young Suns Exoplanet Survey we report the detection of a second planetary-mass companion around the 17 Myr-old, solar-type star TYC 8998-760-1 that is located in the Lower Centaurus Crux subgroup of the Scorpius–Centaurus association. The companion has a projected physical separation of 320 au and several individual photometric measurements from 1.1 to 3.8 microns constrain a companion mass of 6 ± 1 MJup, which is equivalent to a mass ratio of q = 0.57 ± 0.10% with respect to the primary. With the previously detected 14 ± 3 MJup companion that is orbiting the primary at 160 au, TYC 8998-760-1 is the first directly imaged multiplanet system that is detected around a young, solar analog. We show that circular orbits are stable, but that mildly eccentric orbits for either/both components (e > 0.1) are chaotic on gigayear timescales, implying in situ formation or a very specific ejection by an unseen third companion. Due to the wide separations of the companions TYC 8998-760-1 is an excellent system for spectroscopic and photometric follow-up with space-based observatories such as the James Webb Space Telescope.
Export citation and abstract BibTeX RIS
1. Introduction
Driven by the installation of extreme adaptive-optics (AO) assisted imagers such as the Gemini Planet Imager (GPI; Macintosh et al. 2014) and the Spectro-Polarimetric High-contrast Exoplanet REsearch (SPHERE; Beuzit et al. 2019) instrument, the number of directly imaged extrasolar planets has been increasing continuously over the past years. Even though several substellar companions have been identified and characterized with these instruments (e.g., Galicher et al. 2014; Macintosh et al. 2015; Chauvin et al. 2017a; Keppler et al. 2018; Müller et al. 2018; Janson et al. 2019; Mesa et al. 2019), only two systems have been detected so far that show unambiguous evidence for the presence of more than one directly imaged companion: one of these multiplanet systems is HR 8799—an approximately 30 Myr-old star of spectral class A5 that is harboring four giant planets at orbits with semimajor axes ranging from 15 au to 70 au (Marois et al. 2008, 2010; Wang et al. 2018). The other one is PDS 70, which is a K7-type star at an age of approximately 5.4 Myr that is hosting at least two accreting protoplanets inside the gap of a transitional disk that is surrounding this pre-main-sequence star (Keppler et al. 2018; Müller et al. 2018; Haffert et al. 2019). These multiplanet systems are intriguing laboratories to study dynamical interactions and scattering events between several planetary-mass companions, which is crucial for understanding the formation and dynamical evolution of planetary systems (e.g., Morbidelli 2018).
To obtain a statistically significant census of wide-orbit companions to solar-type stars we launched the Young Suns Exoplanet Survey (YSES; Bohn et al. 2020) targeting a homogeneous sample of 70 solar-mass pre-main-sequence stars in the Lower Centaurus Crux subgroup of the Scorpius–Centaurus association (de Zeeuw et al. 1999; Pecaut & Mamajek 2016). Within the scope of this survey, we already detected a self-shadowed transition disk around Wray 15-788 (Bohn et al. 2019) as part of a stellar binary with the debris disk host HD 98363 (Chen et al. 2012; Moór et al. 2017; Hom et al. 2020). Most recent was the announcement of a 14 ± 3 MJup companion that is orbiting the solar analog TYC 8998-760-1 (2MASSJ13251211–6456207) at a projected separation of 160 au (Bohn et al. 2020). The primary is a 16.7 ± 1.4 Myr-old K3IV star with a mass of 1.00 ± 0.02 M☉, located at a distance of 94.6 ± 0.3 pc (Bailer-Jones et al. 2018; Gaia Collaboration et al. 2018). We refer to Table 1 of Bohn et al. (2020) for further information on the host star.
In this article we present new data on this system and report the detection of a second, farther separated, yet lower-mass companion to this young solar analog. Section 2 outlines the observations that we acquired on TYC 8998-760-1 and how the data were reduced. In Section 3 we present the results of this analysis and study the properties of this gas giant companion. Our conclusions and further prospects on characterization of this intriguing multiplanet system are presented in Section 4.
2. Observations and Data Reduction
On the night of 2020 February 16 we acquired data on TYC 8998-760-1 with SPHERE/IRDIS (Dohlen et al. 2008), which was operated in dual-polarization imaging mode (DPI; de Boer et al. 2020; van Holstein et al. 2020) with the instrument derotator switched off (PI: A. Bohn). SPHERE is mounted at the Very Large Telescope (VLT) of the European Southern Observatory (ESO) and it is supported by the SAXO extreme AO system (Fusco et al. 2006) to provide Strehl ratios better than 90% in H band. Within the scope of this work we only used the total intensity frames of the DPI data set that are created by adding the left and right sides of the IRDIS detector. Furthermore, we used parts of the observations presented in Bohn et al. (2020) that were collected with NACO (Lenzen et al. 2003; Rousset et al. 2003) and SPHERE/IRDIS in classical and dual-band imaging modes (Vigan et al. 2010). A detailed description of all observations, applied filters, and weather conditions is presented in Appendix A.
The data reduction was performed as described in Bohn et al. (2020) using a custom processing pipeline based on version 0.8.1 of PynPoint (Stolker et al. 2019) that includes dark and flat calibration, bad pixel cleaning, and subtraction of the sky and instrument background. A more detailed description is presented in Appendix B.
3. Results and Analysis
We report the detection of a second, very red companion to TYC 8998-760-1, which we will refer to as TYC 8998-760-1 c henceforth. A compilation of both confirmed companions around this young, solar analog in several SPHERE and NACO bandpasses is presented in Figure 1. TYC 8998-760-1 c was detected with a signal-to-noise ratio greater than 5 from Y3 to L' band and we did not detect any significant flux at the expected position in the Y2 and M' filters. A detailed analysis of the detection significance for the individual bandpasses and nights is presented in Appendix C.
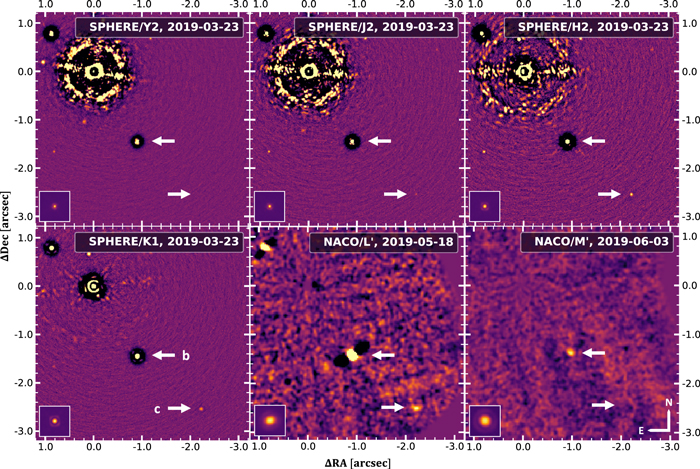
Figure 1. Two planetary-mass companions around TYC 8998-760-1. We present the reduced data for several SPHERE and NACO filters. The white arrows indicate the positions of the confirmed, planetary-mass companions TYC 8998-760-1 b and c as labeled in the bottom left panel. All other objects in the field of view are background contaminants confirmed by proper motion analysis. To highlight off-axis point sources an unsharp mask is applied to the SPHERE data and we smoothed pixel-to-pixel variations in the NACO data with a Gaussian kernel. All images are displayed with an arbitrary logarithmic color scale. The primary is in the upper left of each panel setting the origin of the coordinate system that represents the differential offsets in R.A. and decl. In the lower left of each panel, we present the noncoronagraphic flux PSF as a reference for the corresponding filter. In all frames, north points up and east is to the left.
Download figure:
Standard image High-resolution image3.1. Astrometric Analysis
The main confirmation of the companionship was performed by common proper motion analysis. Because both companions are well separated from the PSF halo of the primary and no PSF subtraction was performed, we extracted the astrometry in the final images with a two-dimensional Gaussian fit. In the H band data collected on the night of 2017 July 5, we detected TYC 8998-760-1 c at a separation of 3 369 ± 0033 and a position angle of 221
 1 ± 06 with respect to the primary.10
From the K1 band data—which provides the highest signal-to-noise ratio of the companion on the night of 2019 March 23—we derived a separation of 3377 ± 0005 and position angle of 2212 ± 01 east of north. For the H band data from 2020 February 16, a separation of 3380 ± 0006 and a position angle of 2213 ± 01 were measured. These measurements imply a projected physical separation of approximately 320 au at the distance of the system.
1 ± 06 with respect to the primary.10
From the K1 band data—which provides the highest signal-to-noise ratio of the companion on the night of 2019 March 23—we derived a separation of 3377 ± 0005 and position angle of 2212 ± 01 east of north. For the H band data from 2020 February 16, a separation of 3380 ± 0006 and a position angle of 2213 ± 01 were measured. These measurements imply a projected physical separation of approximately 320 au at the distance of the system.
This proper motion analysis is visualized in Figure 2. The primary has a parallax of 10.54 ± 0.03 mas and proper motions of μα = −40.90 ± 0.04 mas yr−1 and μδ = −17.79 ± 0.04 mas yr−1 based on Gaia DR2 (Gaia Collaboration et al. 2018). In the top panel we present the additional astrometric measurement of the confirmed comoving companion TYC 8998-760-1 b, which was detected at a separation of 1708 ± 0003 and a position angle of 2121 ± 01 on the night of 2020 February 16. The bottom panel displays the relative astrometric offsets that we measured for background contaminants within the SPHERE/IRDIS field of view. Whereas TYC 8998-760-1 b shows no relative motion with respect to the primary within the measurement uncertainties, the background data points clearly follow the expected trajectory of a static object at infinity as indicated by the blue dashed line. Minor deviations from this trajectory indicate intrinsic nonzero proper motions of these background objects, the measured motions, however, clearly disfavor any bound orbits for these contaminants. As presented in the middle panel of Figure 2, the relative proper motion of TYC 8998-760-1 c is highly inconsistent with the expected movement of a static background object. Analogously to TYC 8998-760-1 b (top panel) its relative motion with respect to the primary is close to zero within the provided uncertainties and the measurements from 2017 July 5 and 2019 March 23 are significantly distinct from the cloud of background objects for the corresponding reference epochs. This is in good agreement with the infinitesimal amount of orbital motion expected for an object at a projected physical separation of 320 au.

Figure 2. Multiepoch proper motion assessments of TYC 8998-760-1 b, c, and confirmed background objects. The colored markers represent the extracted relative astrometry of objects in the SPHERE field of view. The blue, dashed line represents the trajectory of a static background object and the white circles indicate the expected position of such an object, evaluated at the epochs indicated in the top and middle panels. Whereas the origin of the coordinate system is located at the position of the star for the comoving companions (top and middle panel), we present the relative offsets to reference epoch 2020 February 26 for confirmed background objects (bottom panel). The field of view sizes of the plots and the relative positions of the background trajectories are identical for all three panels, so that individual measurements of companions and background objects can be compared among each other.
Download figure:
Standard image High-resolution image3.2. Photometric Analysis
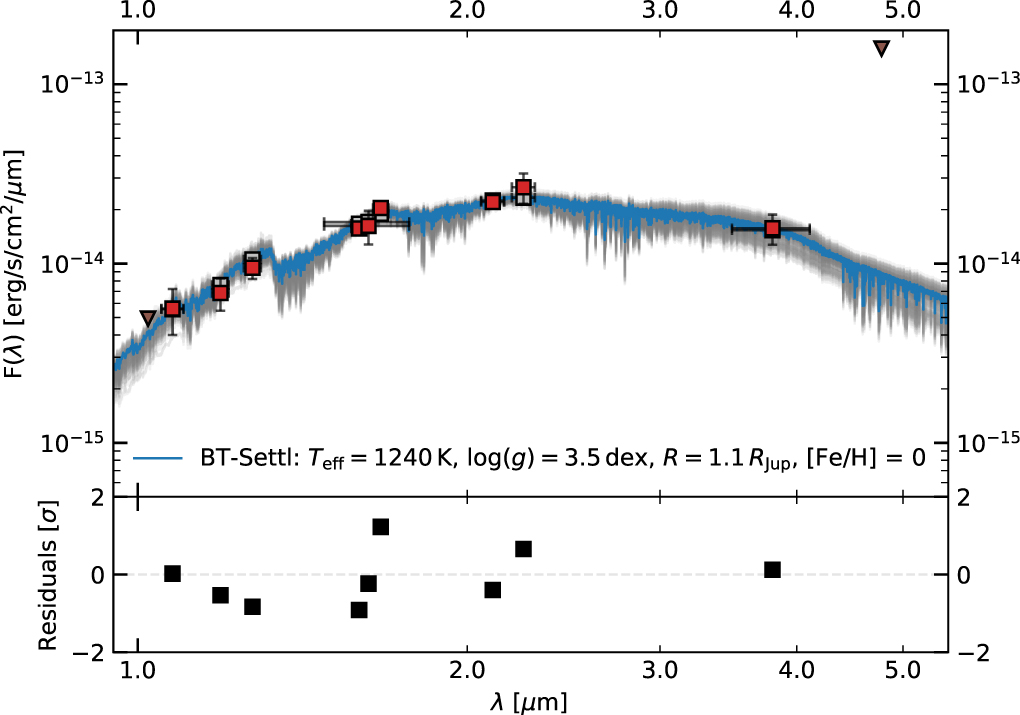
To corroborate the companion status and to further characterize TYC 8998-760-1 c, we analyzed its spectral energy distribution (SED) that we constructed from the SPHERE and NACO detections ranging from Y3 to L' band. The Y2 and M' data imposed additional upper limits to the SED. As described in Bohn et al. (2020) we extracted the companion flux in the SPHERE filters by aperture photometry, choosing an aperture size equivalent to the PSF FWHM of the corresponding filter. The magnitude contrast with respect to the primary is evaluated using the noncoronagraphic flux images that were acquired alongside the observations. As we performed a PCA-based PSF subtraction for the reduction of the NACO L' data, we extracted the magnitude of the companion by injection of negative artificial companions that were generated from the unsaturated stellar PSF in each individual frame. This analysis was performed with the SimplexMinimizationModule of PynPoint that is iteratively minimizing the absolute value norm within a circular aperture around the estimated position of the companion (Wertz et al. 2017) using a simplex-based Nelder–Mead optimization algorithm (Nelder & Mead 1965). The upper limits for Y3 and M' bands were calculated as the 5σ detection limits at the position of the companion. The extracted flux values are presented in Table 1 and visualized in Figure 3.

Figure 3. SED of TYC 8998-760-1 c. The red squares indicate the photometric measurements we extracted from SPHERE and NACO data and the brown triangles are 5σ upper limits for bandpasses with a nondetection of the companion. The blue line represents the median of the posterior distributions from our MCMC fitting routine and the gray squares indicate the evaluation of this model in the SPHERE and NACO bandpasses. We show 100 randomly drawn models from our MCMC posterior distribution (gray curves) and in the bottom panel the residuals of the posterior-median model and the measured photometry are plotted.
Download figure:
Standard image High-resolution imageTable 1. Photometry of TYC 8998-760-1 c and Its Host
| Filter | Magnitude Star | ΔMag | Flux Companion |
|---|---|---|---|
| (mag) | (mag) | ( ) ) |
|
| Y2 | 9.47 | >13.22 | <0.49 × 10⁻¹⁴ |
| Y3 | 9.36 | 13.01 ± 0.31 | (0.56 ± 0.16) × 10−14 |
| J2 | 9.13 | 12.68 ± 0.22 | (0.69 ± 0.14) × 10−14 |
| J3 | 8.92 | 12.25 ± 0.15 | (0.95 ± 0.13) × 10−14 |
| H2 | 8.46 | 11.32 ± 0.08 | (1.57 ± 0.11) × 10−14 |
| H | 8.44 | 11.25 ± 0.23 | (1.62 ± 0.34) × 10−14 |
| H3 | 8.36 | 10.96 ± 0.06 | (2.04 ± 0.12) × 10−14 |
| K1 | 8.31 | 10.03 ± 0.04 | (2.21 ± 0.09) × 10−14 |
| K2 | 8.28 | 9.57 ± 0.09 | (2.67 ± 0.51) × 10−14 |
| L' | 8.27 | 8.02 ± 0.21 | (1.58 ± 0.30) × 10−14 |
| M' | 8.36 | >4.45 | <15.83 × 10⁻¹⁴ |
Note. We present 5σ upper limits of the companion flux in the Y2 and M' bands. The broadband H data is reported for the night of 2020 February 16, which is superior to the data collected on 2017 July 5 due to the longer integration time and better weather conditions.
Download table as: ASCIITypeset image
To assess the planetary parameters of TYC 8998-760-1 c we fitted the photometric data points with a grid of BT-Settl models (Allard et al. 2012) that we evaluated in the corresponding bandpasses. We restricted this analysis to models with effective temperatures from 500 K to 2000 K and surface gravities ranging from 3.5 dex to 5.5 dex with grid spacings of 100 K and 0.5 dex, respectively. In accordance with Sco-Cen membership, only models with solar metallicity were considered for this analysis. Furthermore, we assumed a negligible extinction in agreement with SED modeling of the primary as described in Bohn et al. (2020). To facilitate model evaluation at intermediate temperatures and surface gravities we linearly interpolated the original data grid.
The planetary properties were inferred by a Bayesian parameter study using the affine-invariant Markov chain Monte Carlo (MCMC) ensemble sampler implemented in the emcee python module (Foreman-Mackey et al. 2013). The fitted parameters were the companion's effective temperature Teff, surface gravity  , and radius R. Due to the negligible uncertainties in system parallax, we set the distance to a fixed value of 94.6 pc. The planet luminosity for any realization of Teff,
  , and R was inferred from the integrated flux of the corresponding BT-Settl model, considering the previously fixed system distance. Our MCMC implementation used uniform priors for each of the input parameters, sampling Teff and
  over the full range of interpolated BT-Settl models and allowing for planet radii between 0.5 RJup and 5 RJup. We used a Gaussian likelihood function for the measured photometry of the companion and additionally required that the likelihood decreases to zero in case the flux in Y or M' bands exceeds the corresponding 5σ limits. We set up an MCMC sampler with 100 walkers and 10,000 steps each for the SED fit of the companion. Based on the derived autocorrelation times of approximately 100 iterations, we discarded the first 500 steps of the chains as burn-in phase and continued using only every twentieth step of the remaining data, which resulted in 47,500 individual posterior samples.
The SED of TYC 8998-760-1 c and resulting models from our MCMC fitting procedure are presented in Figure 3. From this analysis we derived estimates of  K,
K,  dex,
dex,  , and
, and  as the 95% confidence intervals around the median of the posterior distributions.11
The uncertainties derived for the surface gravity appear underestimated, as photometric measurements alone cannot precisely constrain this parameter. We thus adopted the spacing of the original model grid of 0.5 dex as the reported uncertainty in the planet's surface gravity henceforth. Future measurements at higher spectral resolution are required though to place tighter constraints to this parameter.
as the 95% confidence intervals around the median of the posterior distributions.11
The uncertainties derived for the surface gravity appear underestimated, as photometric measurements alone cannot precisely constrain this parameter. We thus adopted the spacing of the original model grid of 0.5 dex as the reported uncertainty in the planet's surface gravity henceforth. Future measurements at higher spectral resolution are required though to place tighter constraints to this parameter.
To convert the derived properties to a planetary mass, we evaluated effective temperature and luminosity individually with BT-Settl isochrones at the system age of 16.7 ± 1.4 Myr. This yielded masses of  and
and  for both parameters, respectively. The planet luminosity is usually less model dependent than the derived effective temperature (e.g., Bonnefoy et al. 2016), which is apparent in the uncertainties of both mass estimates. We thus adopted a final mass estimate of 6 ± 1 MJup for TYC 8998-760-1 c as the weighted average of both measurements. This is equivalent to a mass ratio of q = 0.57 ± 0.10% with respect to the primary. Fitting the Y to K band data with several empirical spectra of substellar objects from Chiu et al. (2006) showed best compatibility with a spectral type of L7.5.
We further evaluated the colors of both companions with respect to field brown dwarfs and known directly imaged companions. This analysis is presented within the color–magnitude diagram in Figure 4. To compile the sample of field M, L, and T dwarfs we used data provided by the NIRSPEC Brown Dwarf Spectroscopic Survey (McLean et al. 2003, 2007), the IRTF Spectral library (Cushing et al. 2005; Rayner et al. 2009), the L and T dwarf data archive (Knapp et al. 2004; Golimowski et al. 2004; Chiu et al. 2006), and the SpeX Prism Libraries (Burgasser et al. 2004, 2008, 2010; Cruz et al. 2004; Burgasser & McElwain 2006; Kirkpatrick et al. 2006; Kirkpatrick et al. 2010; McElwain & Burgasser 2006; Reid et al. 2006; Burgasser 2007; Looper et al. 2007, 2010; Muench et al. 2007; Siegler et al. 2007; Sheppard & Cushing 2009; Gelino & Burgasser 2010; Dhital et al. 2011), using distances from Gaia DR2 (Gaia Collaboration et al. 2018; Bailer-Jones et al. 2018), the Brown Dwarf Kinematics Project (Faherty et al. 2009), and the Pan-STARRS1 3π Survey (Best et al. 2018). The photometry of the directly imaged companions were adopted from Chauvin et al. (2005), Lafrenière et al. (2008), Bonnefoy et al. (2011), Currie et al. (2013), Zurlo et al. (2016), Samland et al. (2017), Chauvin et al. (2017b), Keppler et al. (2018), Müller et al. (2018), Cheetham et al. (2019), and Janson et al. (2019). TYC 8998-760-1 b and c are both considerably redder than the evolutionary sequence of field brown dwarfs, which is another strong indicator of their youth and low surface gravity. TYC 8998-760-1 c is located close to the L/T transition but substantially redder than field dwarf equivalents of similar spectral type. Indeed, it is the reddest object among the directly imaged, substellar companions that are presented in Figure 4.

Figure 4. Color–magnitude diagram for TYC 8998-760-1 b and c. The two objects of interest are highlighted by the red stars. The colored, filled circles indicate the evolutionary sequence of field dwarfs of spectral class M to T and the white circles represent confirmed directly imaged companions.
Download figure:
Standard image High-resolution image3.3. Dynamical Stability
We model the system using Rebound and the WHFast integrator (Rein & Liu 2012; Rein & Tamayo 2015). We assume semimajor axes of planets b and c to be 160 au and 320 au respectively, and we place both planets at apastron. For various values of the eccentricity of the planets we then calculate the chaos indicator as the mean exponential growth factor of nearby orbits (MEGNO; Cincotta et al. 2003; Rein & Tamayo 2016) for the system, integrating it for its current lifetime and up to 1 Gyr to check its long-term stability. The derived MEGNO values for several planetary eccentricities are presented in Appendix E. We find that for orbits with low eccentricity (e ⪅ 0.1) for both planets, the system is stable on gigayear timescales. For larger eccentricities, the system is chaotic and likely to experience dynamical interaction between the planets, implying that either the planets formed in situ or they were ejected from the system by an unseen third companion.
4. Conclusions
We report the detection of TYC 8998-760-1 c: a second, planetary-mass companion to the solar-type Sco-Cen member TYC 8998-760-1, making this the first directly imaged system around a star of approximately 1 M☉. From the astrometry of the object, we derived a projected physical separation of 320 au. SED analysis of broadband photometric data sampled from Y to L' band constrains an effective temperature of  K, a surface gravity
  dex, a planet radius of
  , a luminosity of
  , and a spectral type of L7.5. Evaluation of BT-Settl isochrones at the system age of 16.7 ± 1.4 Myr yielded a planet mass of 6 ± 1 MJup, which is consistent with a mass ratio of q = 0.57 ± 0.10% with regard to the primary. This is in very good agreement with the color–magnitude analysis of the system that ranks TYC 8998-760-1 c as an object that is close to the L/T transition, yet much redder than field objects of the same spectral type. Comparison to other well-characterized, substellar companions shows that TYC 8998-760-1 c is indeed the reddest among these objects. Using dynamical modeling of the system, we find that the system is stable on gigayear timescales only for near-circular orbits, with eccentric orbits becoming chaotic on timescales comparable to the system's lifetime.
TYC 8998-760-1 is a prime system to further study the dynamical and chemical properties of two coeval, gravitationally bound, gas giant planets. Continuous astrometric monitoring will constrain the orbital solutions for both companions and thus enable testing of potential formation scenarios. Due to the wide separations of both companions, contaminating flux from the primary is negligible, so spectral characterization at high resolution is easily accessible to determine rotational periods and molecular abundances in the planetary atmospheres (e.g., Snellen et al. 2014). Multiwavelength photometric variability monitoring with space-based observatories such as the Hubble space telescope and the James Webb Space Telescope (JWST; e.g., Zhou et al. 2016; Biller et al. 2018) will facilitate studies of the vertical cloud structures in these Jovian companions. Even mid-infrared spectroscopy with JWST/MIRI will be feasible to provide benchmark spectra for theoretical atmosphere models of young, substellar companions at wavelengths longer than 5 microns.
We thank the anonymous referee for valuable feedback that helped improve the quality of the manuscript. The research of A.J.B. and F.S. leading to these results has received funding from the European Research Council under ERC Starting Grant agreement 678194 (FALCONER). S.R. acknowledges funding from the STFC Consolidated Grant ST/R000395/1. Part of this research was carried out at the Jet Propulsion Laboratory, California Institute of Technology, under a contract with the National Aeronautics and Space Administration. M.R. acknowledges support from the Fonds Wetenschappelijk Onderzoek (FWO, Research Foundation Flanders) under project ID G0B3818N. This research has made use of the SIMBAD database, operated at CDS, Strasbourg, France (Wenger et al. 2000). This publication makes use of VOSA, developed under the Spanish Virtual Observatory project supported by the Spanish MINECO through grant AyA2017-84089. VOSA has been partially updated by using funding from the European Union's Horizon 2020 Research and Innovation Programme, under Grant Agreement No. 776403 (EXOPLANETS-A).
To achieve the scientific results presented in this article we made use of the Python programming language12 , especially the SciPy (Virtanen et al. 2020), NumPy (Oliphant 2006), Matplotlib (Hunter 2007), emcee (Foreman-Mackey et al. 2013), scikit-image (van der Walt et al. 2014), scikit-learn (Pedregosa et al. 2012), photutils (Bradley et al. 2016), and astropy (Astropy Collaboration et al. 2013, 2018) packages.
We performed simulations using Rebound (Rein & Liu 2012) and AMUSE (Pelupessy et al. 2013).
Facility: ESO/VLT/SPHERE ESO/VLT/NACO. -
Software: SciPy (Virtanen et al. 2020), NumPy (Oliphant 2006), Matplotlib (Hunter 2007), emcee (Foreman-Mackey et al. 2013), scikit-image (van der Walt et al. 2014), scikit-learn (Pedregosa et al. 2012), photutils (Bradley et al. 2016), astropy (Astropy Collaboration et al. 2013, 2018), Rebound (Rein & Liu 2012) and AMUSE (Pelupessy et al. 2013).
Appendix A: Observational Setup and Conditions
The setup that was used for each observation and the weather conditions during data collection are presented in Table A1.
Table A1. High-contrast Observations of TYC 8998-760-1
| Observation Date | Instrument | Mode | Filter | FWHM | NEXP × NDIT × DIT | Δπ |

|

|

|
|---|---|---|---|---|---|---|---|---|---|
| (mas) | (1 × 1 × s) | (°) | ('') | (ms) | |||||
| 2017 Jul 5 | SPHERE | CI | H | 52.3 | 4 × 1 × 32 | 0.50 | 1.22 | 1.52 | 2.90 |
| 2019 Mar 23 | SPHERE | DBI | Y23 | 37.2/37.9 | 4 × 3 × 64 | 3.84 | 0.41 | 1.38 | 9.30 |
| 2019 Mar 23 | SPHERE | DBI | J23 | 40.1/41.8 | 4 × 3 × 64 | 3.72 | 0.40 | 1.41 | 10.75 |
| 2019 Mar 23 | SPHERE | DBI | H23 | 47.5/49.5 | 4 × 3 × 64 | 3.60 | 0.43 | 1.44 | 10.83 |
| 2019 Mar 23 | SPHERE | DBI | K12 | 60.2/63.6 | 4 × 3 × 64 | 3.45 | 0.53 | 1.49 | 8.75 |
| 2019 May 18 | NACO | CI | L' | 125.0 | 30 × 600 × 0.2 | 22.99 | 0.88 | 1.32 | 2.32 |
| 2019 Jun 3 | NACO | CI | M' | 131.6 | 112 × 900 × 0.045 | 50.15 | 0.78 | 1.33 | 3.69 |
| 2020 Feb 16 | SPHERE | DPI | H | 50.5 | 16 × 4 × 32 | 13.05 | 0.67 | 1.32 | 9.15 |
Note. The applied mode is either classical imaging (CI) with a broadband filter, dual-band imaging (DBI) with two intermediate band filters simultaneously, or dual-polarization imaging (DPI). FWHM denotes the full width at half maximum that we measure from the average of the noncoronagraphic flux images that are collected for each filter. For NACO data these are equivalent to the science exposures of the star. NEXP describes the number of exposures, NDIT is the number of subintegrations per exposure and DIT is the detector integration time of an individual subintegration. Δπ denotes the amount of parallactic rotation during the observation and  ,
,  , and
, and  represent the average seeing, airmass, and coherence time, respectively.
Download table as: ASCIITypeset image
Appendix B: Data Reduction
B.1. SPHERE Data
As both companions are located outside the stellar PSF halo, we did not perform any advanced post-processing for the SPHERE data: all frames were centered and derotated accounting for the parallactic rotation of the field. We used the standard astrometric calibration for SPHERE/IRDIS with a true north offset of −175 ± 008 and plate scales varying from 12.250 ± 0.010 mas per pixel to 12.283 ± 0.010 mas per pixel for the applied filters as described in Maire et al. (2016).
B.2. NACO Data
As the NACO observations were optimized for the characterization of TYC 8998-760-1 b, we had to reject large fractions of the original data sets as described in Table A1, because TYC 8998-760-1 c was located outside the detector window for these frames. After additional frame selection to reject frames with bad AO correction, approximately 30% and 15% of the full data was remaining for L' and M' data, respectively. As the amount of parallactic rotation in the data was sufficient, we performed a PSF subtraction based on principal component analysis (PCA; Amara & Quanz 2012; Soummer et al. 2012). For both L' and M' data, we fitted and subtracted one principal component from the images. This was optimizing the signal-to-noise ratio of TYC 8998-760-1 c for the L' data and it provided the best upper limit for the M' data at the position of the companion.
Appendix C: Signal-to-noise Assessment
To assess the significance of the detection of TYC 8998-760-1 c for each individual epoch and filter, we measured the signal-to-noise ratio of the companion in the processed images. We evaluated the signal flux in a circular aperture placed at the previously determined position of the companion for the corresponding filter (see Section 3.1). For bandpasses in which the companion is not detected (i.e., Y2 band on the night of 2019 March 23 and M' band on the night of 2019 June 3), we used the astrometric position of the K1 data from 2019 March 23 instead. The aperture radius was chosen as the FWHM of the unsaturated flux PSF of the corresponding filter as reported in Table A1. To measure the noise, we distributed circular apertures of the same size radially around the star at the same radial separation as the companion. We calculated the integrated flux within each of the background apertures and subtracted the average of these measurements from the integrated signal flux in the science aperture. The noise was computed as the standard deviation of the integrated fluxes from the background apertures, following the description of Mawet et al. (2014). The resulting signal-to-noise ratios are presented in Figure C1. Besides nondetections in the Y2 and the M' data, we measure the flux of TYC 8998-760-1 c with a signal-to-noise ratio greater than 5.

Figure C1. Signal-to-noise ratio assessment of TYC 8998-760-1 c. We show a cutout of the final images for all filters and epochs. The signal-to-noise ratios of the companion were measured with aperture photometry and the resulting values are presented in the lower left of each panel. Each image is presented on an individual linear color scale that is normalized with respect to the maximum and minimum flux value within the image cutout.
Download figure:
Standard image High-resolution imageAppendix D: Posterior Distributions of SED Fit
We present the full parameter space of posterior samples from our SED fit of TYC 8998-760-1 c in Figure D1. Due to the linear interpolation of the model grid prior to the MCMC fitting routine, each parameter is sampled continuously within the predefined intervals. The upper three panels of the corner plot show the correlations between the three input parameters Teff,  , and R. Furthermore, we present the corresponding planet luminosities that are derived from these input parameters and the system distance in the bottom panel of the figure. The posterior distributions show two families of solutions with effective temperatures of approximately 1225 K and 1375 K and associated planet radii of 1.2 RJup and 0.8 RJup, respectively. Even though the latter family of solutions is slightly disfavored due to the corresponding planet radius of 0.8 RJup—which is smaller than theoretical predictions and empirical constraints for an object of this age and mass (e.g., Chabrier et al. 2009; Mordasini et al. 2012)—we report the 95% confidence intervals around the medians of the distributions as a conservative estimate of the planetary properties. This estimate can certainly be refined by future studies at higher spectral resolution.

Figure D1. Posterior distributions of the MCMC fitting procedure to the photometric SED of TYC 8998-760-1 c. The input parameters of the fit were effective temperature Teff, surface gravity  , and object radius R. We further show the resulting planet luminosities that can be derived from the three input parameters and the system distance. The dashed blue lines in the marginalized distributions present the 2.5%, 50%, and 97.5% quantiles and the title of the corresponding diagram indicates the 95% confidence interval around the median, derived from these quantities.
Download figure:
Standard image High-resolution imageAppendix E: Dynamical Modeling
In Figures E1 and E2, we show the MEGNO values for systems after simulating them for 17 Myr and 1 Gyr, respectively (see Section 3.3). A MEGNO value >2 indicates a chaotic system, for which we cannot accurately predict the orbits on these timescales.

Figure E1. MEGNO value for the system after 17 Myr, for different eccentricities of planets b and c. A value >2 indicates a chaotic system.
Download figure:
Standard image High-resolution image
Figure E2. As Figure E1, but on a 1 Gyr timescale. We have not plotted orbits with e > 0.15, as they are all chaotic on this timescale.
Download figure:
Standard image High-resolution image
Footnotes
- *
Based on observations collected at the European Organisation for Astronomical Research in the Southern Hemisphere under ESO programs 099.C-0698(A), 0101.C-0341(A), 2103.C-5012(B), and 0104.C-0265(A).
- 10
The uncertainties of these measurements are much larger than the usual astrometric precision of SPHERE. This is attributed to the nonoptimal AO performance caused by poor atmospheric conditions with an average seeing of 1
22 and a coherence time of 2.9 ms, resulting in a smeared PSF and limited astrometric accuracy (see Appendix C). - 11
The full posterior distributions of this analysis and the correlations between the fitted parameters are presented in Appendix D.
- 12
Python Software Foundation, https://www.python.org/.