


Abstract
Stellar occultations have been used to search for Kuiper Belt and Oort Cloud objects. We propose a search for interstellar objects based on the characteristic durations (∼0.1 s) of their stellar occultation signals and high inclination relative to the ecliptic plane. An all-sky monitoring program of all ∼7 × 10⁶ stars with R ≲ 12.5 using 1-m telescopes with 0.1 s cadences is predicted to discover ∼1 interstellar object per year.
1. Introduction
'Oumuamua was the first interstellar object (ISO) reported in the solar system (Meech et al. 2017; Micheli et al. 2018). Follow-up studies of 'Oumuamua were conducted to better understand its origin and composition (Bannister et al. 2017; Bolin et al. 2017; Gaidos et al. 2017; Jewitt et al. 2017; Mamajek 2017; Ye et al. 2017; Bialy & Loeb 2018; Fitzsimmons et al. 2018; Hoang et al. 2018; Trilling et al. 2018; Moro-Martin 2019; Sekanina 2019; Seligman et al. 2019; Siraj & Loeb 2019a, 2019b). 'Oumuamua's size was estimated to be ≲200 m, based on Spitzer Space Telescope constraints on its infrared emission given its expected surface temperature based on its orbit (Trilling et al. 2018).
In addition to 'Oumuamua, CNEOS 2014 January 8 (Siraj & Loeb 2019a) was tentatively the first interstellar meteor discovered that is larger than dust, and 2I/Borisov (Guzik et al. 2019) was the first confirmed interstellar comet.
Transient diffraction patterns caused by the occultation of a distant star due to an intervening small body have been proposed and used to search for Kuiper Belt objects (KBOs) and Oort Cloud objects (OCOs) in the solar system (Bailey 1976; Dyson 1992; Roques & Moncuquet 2000; Nihei et al. 2007; Schlichting 2009, 2012; Arimatsu 2019). Here, we propose an analagous search for ISOs, flagged by their unusual inclinations and unique kinematics leading a distribution of characteristic distribution of durations, the peak of which lies between that of KBOs and that of OCOs.
The data from such a search would calibrate population parameters for ISOs that are crucial for constraining formation theories of exoplanetary systems (Duncan et al. 1987; Charnoz & Morbidelli 2003; Veras et al. 2011, 2014; Pfalzner et al. 2015; Do et al. 2018; Raymond et al. 2018; Hands et al. 2019; Pfalzner & Bannister 2019; Siraj & Loeb 2019d). Below we derive the physical characteristics and rate of the expected ISO occultation events.
2. Theory
The measured intensity at wavelength λ from a diffraction pattern created by a spherical object of radius RL at a distance DL is

where ρ = (RL/F) is the radius of the object in units of the Fresnel scale , and tF is the Fresnel scale crossing time for the object (Roques et al. 1987; Nihei et al. 2007). For a transverse speed, v⊥, at a distance DL, the Fresnel time is tF = 0.12 s (DL/20 au)1/2 (v⊥/10 km s−1)−1 (λ/μm)1/2 and the Fresnel scale is F = 1.2 km (DL/20 au)1/2 (λ/μm)1/2. The Lommel functions are defined as


where Jn is a Bessel function of order n. With regard to the impact parameter b, we assume b = 0 for simplicity. Figure 1 shows lightcurves for different values of ρ, as well as lightcurves sampled as at a spatial resolution of F. While the calculated lightcurves represent monochromatic light, the finite filters used in practice slightly reduces the statistical power.

Figure 1. Occultation lightcurves for the values of ρmin (ratio of ISO radius to the Fresnel scale) in Table 1 (dotted green lines), and sampled lightcurves at temporal resolution, tF (solid red lines). For a transverse speed v⊥ at a distance DL, the time unit, tF = 0.1 s (DL/20 au)1/2 (v⊥/10 km s−1)−1.
Download figure:
Standard image High-resolution imageFor a solar-type star with an R magnitude of 12, the flux of R-band photons at Earth is ∼2.8 × 10⁵ m−2 s−1. For an intensity dip caused by an occultation event, a signal-to-noise ratio of ≳10 for a telescope with 1 m2 collecting area with a temporal resolution of tf would require the intensity dip to be ≳6%, corresponding to ρ ≳ 0.22. The appropriate values of ρmin as a function of magnitude are listed in Table 1.
Table 1. Background Photon Flux, Maximum Dip in Intensity, and Minimum Value of ρ for Occultation Events with Solar-type Background Stars, Assuming a 1 m2 Collecting Area and a Temporal Resolution of tf
| R Magnitude | R-band Photon Flux (m−2 s−1) | ΔImin (%) | ρmin |
|---|---|---|---|
| 12 | 2.8 × 10⁵ | 6 | 0.22 |
| 14 | 4.4 × 10⁴ | 15 | 0.32 |
| 16 | 6.9 × 10³ | 38 | 0.66 |
| 18 | 1.1 × 10³ | 95 | 3 |
Download table as: ASCIITypeset image
In addition to ρ ≥ ρmin for a strong signal, we also require the occulting object to subtend a larger angular size on the sky than the star to avoid dilution of the signal by the finite source size. We adopt the conservative condition RL ≤ 10 km for ISOs. Given a star of radius RS and distance DL, the three conditions for an ISO occultation event are expressed as follows:


Figure 2 illustrates a parameter space in which all three conditions are satisfied.

Figure 2. Parameter space in which conditions (3), (4), and (5), are satisfied for a R = 12 solar-type star. RS ∼ R⊙ and DS ∼ 300 pc for an R = 12 solar-type star.
Download figure:
Standard image High-resolution imageWe approximate the cumulative number density of ISOs as a power law with exponent −3.3, calibrated by the number density (nO ∼ 0.2 au−3) of 'Oumuamua size (RO ∼ 100 m) objects (Landgraf et al. 2000; Do et al. 2018; Siraj & Loeb 2019c).
We adopt the three-dimensional velocity dispersion of stars in the thin disk of the Milky Way as a proxy for the kinematics of ISOs, each corresponding to the standard deviation of a Gaussian distribution about the local standard of rest: σx = 35 km s−1, σy = 25 km s−1, σz = 25 km s−1 (Bland-Hawthorn & Gerhard 2016). The resulting distribution of observed transit speeds (once the motion of the Earth is subtracted) has a mean value of .


Figure 3. ISO occultation rate per star as a function of R magnitude for solar-type stars.
Download figure:
Standard image High-resolution imageThe rate of occultations per star is given by

where the limits of the integrals, L1 and L2, are defined as follows:


The resulting ISO occultation rate per star as a function of magnitude is shown in Figure 3, and corresponds to ∼0.1 Myr−1 at R = 12. For an R = 12 star, Figure 4 shows the ISO occultation rate as a function of stellar radius.

Figure 4. ISO occultation rate per star as a function of stellar radius, for a R = 12 star.
Download figure:
Standard image High-resolution imageTo determine how easily discernible ISO, KBO, and OCO occultation signatures are from each other, and to understand the distribution of timescales on which ISO occultations occur, we numerically simulated the distribution of expected Fresnel distance crossing times for each population, assuming a R = 12 solar-type star.
We draw distances from the distribution with bounds of 1 au to (RmaxDS/RS) for ISOs, bounds of 30–50 au for KBOs, and bounds of 2 × 10³ to 105 au for OCOs. We draw velocities from the aforementioned kinematics for ISOs; we compute the orbital speed corresponding the distance for KBOs and for OCOs. We do not consider gravitational focusing and acceleration by the Sun for ISOs, as these effects would only be significant at DL ≲ 1 au. We sample random points in the Earth's orbit to obtain the motion of the observer relative to the object. We draw sizes for each population from a power-law distribution with index ∼−3, with the appropriate bounds for each population. If conditions (4) and (5) are satisfied, we compute the Fresnel distance crossing time, tF = (F/v⊥). Otherwise, we re-draw distance and size. The resulting distributions of tF are shown in Figure 5. ISO occultation events have have an even distribution with distance between 1 and ∼103 au. We find that the timescales for ISO and OCO occultation events are distinct. The ISO timescale distribution peaks at tF = 0.1 s, and a survey can avoid KBOs by pointing away from the plane of the ecliptic.


Figure 5. Expected probability distribution of Fresnel crossing times during stellar occultations observed from Earth for ISOs (blue), KBOs (green), and OCOs (orange), for a R = 12 solar-type star.
Download figure:
Standard image High-resolution image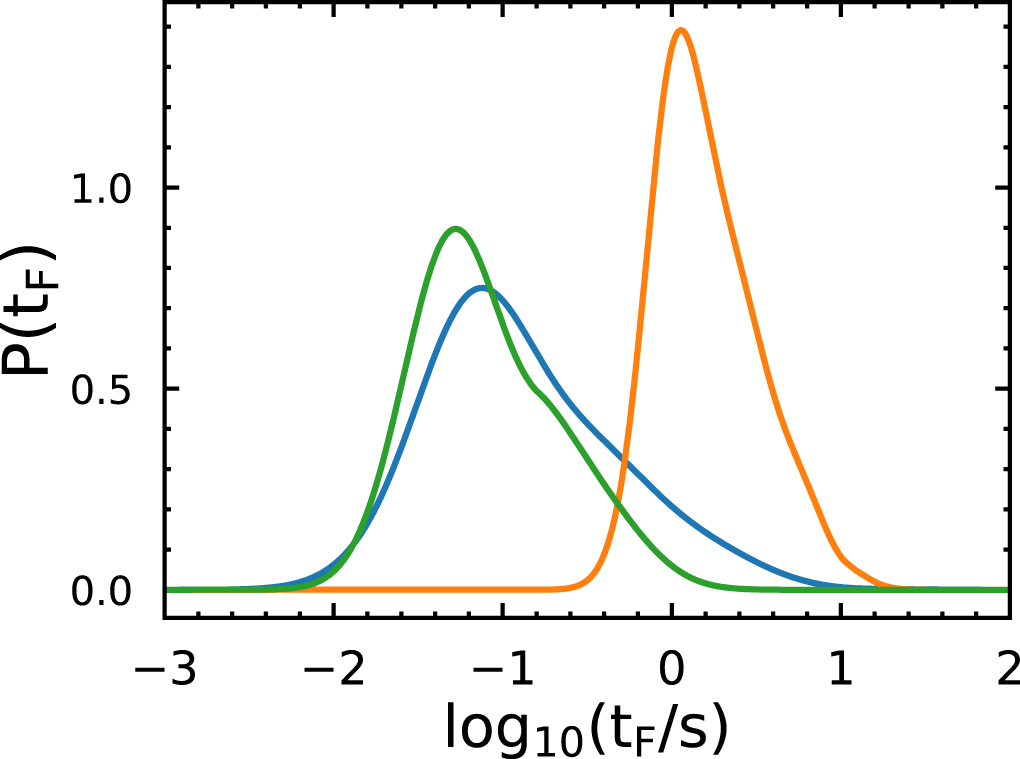
3. Conclusions
There are ∼7 × 10⁶ stars in a with magnitude R ≲ 12.5 (McMillan 2018). An all-sky network of 1 m telescopes continuously monitoring all R = 12 stars with a time resolutions of 0.1 s should yield a discovery rate of ∼1 ISO per year. This would be a significant improvement on the current discovery rate of an ISO every few years. Our method supplements direct detection through reflected sunlight but nearby events could benefit from both methods of detection. By measuring each occultation in two or three colors, the radius and distance of the occulting object can be constrained (Dyson 1992).
The data from such a survey would provide invaluable new information on the size distribution, composition, and possible origin of ISOs. Such information would be particularly valuable given the puzzle of the first two confirmed ISOs, 'Oumuamua and Borisov, having such different physical characteristics (Meech et al. 2017; Guzik et al. 2019), and given the high implied abundance of ISOs relative to previous predictions (Moro-Martin et al. 2009).
This work was supported in part by a grant from the Breakthrough Prize Foundation.