


Abstract
We present here the results of the first broadband simultaneous spectral and temporal studies of the newly detected black hole binary MAXI J1820+070 as seen by Soft X-ray Telescope and Large Area X-ray Proportional Counter (LAXPC) on board AstroSat. The observed combined spectra in the energy range 0.7–80 keV were well modeled using disk blackbody emission, thermal Comptonization, and a reflection component. The spectral analysis revealed that the source was in its hard spectral state (Γ = 1.61) with a cool disk (kTin = 0.22 keV). We report the energy dependent time-lag and root mean squared (rms) variability at different frequencies in the energy range 3–80 keV using LAXPC data. We also modeled the flux variability using a single-zone stochastic propagation model to quantify the observed energy dependence of time lag and fractional rms variability, and then compared the results with that of Cygnus X-1. Additionally, we confirm the detection of a quasi-periodic oscillation with the centroid frequency at 47.7 mHz.
Export citation and abstract BibTeX RIS
1. Introduction
Accreting black hole X-ray binaries (BHXBs) in outburst exhibit random short-term variability in their flux (van der Klis 1989), which may arise due to the perturbations occurring at different radii of the accretion disk propagating inward (Lyubarskii 1997). These perturbations cause variations to mass accretion rate at the inner regions of the accretion disk on different timescales (Spruit et al. 1987; Narayan & Yi 1994; Abramowicz et al. 1995; Chen 1995). The X-ray variability in BHXBs is well represented by their power density spectra (PDS), which exhibit systematic changes throughout the course of an outburst with remarkable similarities among themselves, thereby suggesting a common underlying physical phenomenon (Belloni 2010, and references therein). The PDS of most BHXBs are characterized by broadband-continuum-noise-−like features and sometimes narrow peak features called quasi-periodic oscillations (QPOs). The exact mechanism of the origin of QPOs is still an open question but the origin of broadband noise could be due to the inward propagation and coupling of perturbations occurring throughout the accretion disk, resulting in flux variations. This scenario best explains the observed linearity of the root mean square (rms)-flux relationship in galactic black holes (Gleissner et al. 2004) and other type of X-ray sources (Uttley & McHardy 2001; Gaskell 2004). Furthermore, Heil et al. (2012) showed that the rms-flux relationship of broadband noise is an universal feature of all accreting BHXBs, independent of their spectral state.
Over the past two decades, there have been several efforts to develop a unified propagation fluctuation model to explain and predict the energy and frequency dependent fractional rms and time-lag (Ingram & Done 2011, 2012; Ingram & van der Klis 2013; Rapisarda et al. 2016, 2017; Axelsson & Done 2018). The motivation for this is that such efforts could provide the necessary tools to probe the geometry of the system within this regime and possibly explain the exact mechanism of origin of QPOs (Böttcher & Liang 1999; Misra 2000; Kotov et al. 2001).
Maqbool et al. (2019) proposed and validated one such model by comparing its predictions with observed data of Cygnus X-1 from AstroSat. The model invokes a simple geometry of standard truncated disk with a hot inner region (Esin et al. 1997) and assumes that hard X-ray component originates from this hot inner region by a single temperature thermal Comptonization process. The model considers the variation of the temperature of the inner radius of the truncated disk and that of the hot inner flow with a frequency dependent time-lag between them. Data from Soft X-ray Telescope (SXT) and Large Area X-ray Proportional Counter (LAXPC) on board AstroSat play a crucial role for validating the model as it provides unprecedented spectro-timing information with broadband coverage (Misra et al. 2017). The model successfully explained the energy dependent rms and time lags in Cygnus X-1. Nonetheless, the results obtained are for a persistent BHXB in its hard state. It is unclear how the results would change for a transient BHXB in the same state, thereby making it necessary to test and validate the model on different types of X-ray binaries.
In view of this, we considered AstroSat's data of the newly discovered transient MAXI J1820+070 to validate the model proposed by Maqbool et al. (2019). MAXI J1820+070, a galactic black hole X-ray transient, is one among the brightest X-ray novae observed to date (Corral-Santana et al. 2016). The source was first discovered in the optical on 2018 March 6 by the All-Sky Automated Survey for Supernovae (ASSAS-SN) project (Tucker et al. 2018) and later in X-rays on 2018 March 11 by the Monitor of All-sky X-ray Image (MAXI; Kawamuro et al. 2018). Subsequent multi-wavelength observations revealed that MAXI J1820+070 is a BHXB system (Baglio et al. 2018; Uttley et al. 2018). The outburst cycle, which lasted for almost a year, showed rapid, frequent, alternating transitions between hard−soft spectral states (Russell et al. 2019). Shidatsu et al. (2019) analyzed the data from MAXI and SWIFT spanning the entire outburst and reported the similarities between two re-brightening events that occurred in 2018 March and June. Interestingly, these re-brightening events were peaked at comparable X-ray luminosity in 2–20 keV despite showing hard–soft spectral state transition only in one of them (2018 June).
Gandhi et al. (2019) reported the source distance to be  kpc using the second data release (DR2) data from Gaia. Uttley et al. (2018) found the Galactic extinction to be 1.5 × 1021 cm−2 by analyzing the soft X-ray data from Neutron star Interior Composition Explorer (NICER) during the rising phase of outburst. Kara et al. (2019) reported high-frequency reverberation time-lags (soft lags) between the energy bands 0.1–1 keV and 1–10 keV also using the NICER data, which was seen for the first time in a BHXB. Bharali et al. (2019) constrained the physical parameters of the black hole utilizing the data from NuSTAR and SWIFT/XRT. The combined spectral fit revealed the presence of weak disk blackbody emission and dominant thermal Comptonization, along with relativistic reflection fraction. Furthermore, they estimated the source inclination angle to be ∼30° and the inner disk radius to be ∼4.2 times the radius of the innermost stable circular orbit.
The proximity of the source, high flux rate of ∼10−8 erg cm−2 s−1, and low galactic extinction make MAXI J1820+070 an ideal candidate to test the stochastic propagation model proposed by Maqbool et al. (2019). In this study, we report the first simultaneous broadband spectro-timing results of MAXI J1820+070 using data from SXT and LAXPC on board AstroSat. We also report the results of the stochastic propagation model fit and their comparison with that of Cygnus X-1.
2. Data Reduction and Analysis
2.1. Data Reduction
We have analyzed ∼93 ks simultaneous data from SXT and LAXPC on board AstroSat spanning over a period of 2 days starting from 2018 March 30. Observed data consisted of 15 continuous segments corresponding to 15 individual orbits of the satellite. Level 1 photon counting mode data of SXT was processed through the official SXT pipeline AS1SXTLevel2-1.4b4 to produce Level 2 files.
The HEASoft version 6.24 tool XSELECT was used to extract spectra and lightcurves between the source regions of 4' (inner radius) and 16' (outer radius). These regions were chosen to account for pile-up effect in the charged coupled device (CCD) due to high flux rate (∼1 Crab) of the source in SXT energy range (0.3–8.0 keV). The response matrix file (RMF) "sxt_pc_mat_g0to12.rmf," standard background spectrum "SkyBkg_comb_EL3p5_Cl_Rd16p0_v01.pha" and an ancillary response file (ARF) appropriate for source location on the CCD created using SXT ARF generation tools5 were used for the analysis.
Each of the 15 images was visually examined to ensure that drift corrections of the satellite were applied and a single point source was seen. Following this, we used the SXT event merger tool (see footnote 5) to merge all 15 individual Level 2 files into one single merged event file. The merged file was later used for spectral analysis.
The official LAXPC software6 was used to process Level 1 event mode data to obtain Level 2 files. The sub-routines of LAXPC software (Antia et al. 2017) were used to generate a good time interval file, total spectrum, RMF, and background spectrum for proportional counters 10, 20, and 30, respectively. However, data from LAXPC10 and LAXPC30 were not used for this work as the POC team reported abnormal gain change in LAXPC10 on 2018 March 28 and LAXPC30 was not operational during this observation.
2.2. Spectral Analysis
We have performed a combined spectral fitting of SXT and LAXPC20 spectra using XSPEC 12.9.1p in the energy range 0.7–80 keV. Lower energies (<0.7 keV) were not considered due to the uncertainties in the effective area and response of the CCD. A 3% systematic error was incorporated during analysis to account for uncertainties in response calibration. Background uncertainty was taken to be 3%. Gain correction was applied to the SXT data using the XSPEC command gain fit with slope unity and the best-fit offset value was found to be 23 eV. Relative normalization was allowed to vary between SXT and LAXPC data.
The source spectrum was found to be dominated by thermal Comptonization component along with disk emission and reflection component (Figure 1, left panel). We used XSPEC models nthcomp (Życki et al. 1999), diskbb (Mitsuda et al. 1984; Makishima et al. 1986), and ireflect (Magdziarz & Zdziarski 1995) to fit the thermal Comptonization, disk emission, and reflection component, respectively. We also added model tbabs (Wilms et al. 2000) to account for interstellar absorption. Interstellar hydrogen column density (NH) was frozen at 0.15 × 1022 cm−2 (Uttley et al. 2018). Disk emission was considered to be input seed photons for Comptonization, and thus the parameters Tin and nthcomp temperature (kTbb) were tied together and treated as a single parameter during the fitting. For the reflection model, the abundance was fixed to solar values while the inclination was taken to be ∼30° (Bharali et al. 2019). The temperature of the reflector was tied to the inner disk temperature. The electron temperature of the Comptonizing cloud (kTe) was not constrained by the data and hence was fixed at a fiduciary value of 100 keV. The disk ionization parameter was frozen at 10 erg cm s−1. The best-fit spectral parameters are listed in Table 1. The spectral index (Γ = 1.61 ± 0.01) obtained indicated that the source was in a hard spectral state (Titarchuk & Shaposhnikov 2005). The disk temperature was found to be 0.22 ± 0.01 keV, suggesting a cool disk truncated at a large distance (∼526 km; Kubota et al. 1998). Spectra also showed the presence of a Compton hump around 30 keV, indicating disk reflection. Note that the parameters obtained here are an approximation due to the large systematic error (3%) considered while fitting SXT and LAXPC spectra, which did not allow for more precise spectral modeling. We also tried using a few other reflection models like reflionX to further constrain the reflection parameters. However, we did not find any significant improvement in the fit or obtain a better estimate of the parameters.
Table 1. Spectral and PDS Parameters
| Spectral Parameters | ||||||
|---|---|---|---|---|---|---|
| Model parameters | rel_refl | Γ | Ncomp | kTin | Ndisk | χ2/degree of freedom (dof) |
| (Description) | (Relativistic | (Asymptotic | (Normalization | (Temperature | (Normalization | |
| reflection) | power law) | factor) | at inner disk | factor) | ||
| radius) keV | ×105 | |||||
| Best-fit value | 0.17
|
1.61
|
3.42
|
0.22
|
2.4
|
696/578 |
| PDS parameters | ||||||
| Feature | QPO | Weak | Noise hump 1 | Noise hump 2 | Noise hump 3 |
 /dof /dof |
| oscillation | ||||||
| Centroid frequency (Hz) |
 × 10−3 × 10⁻³ |
 × 10−3 × 10⁻³ |
0a | 0a | 1.04
|
|
| Width (Hz) |
 ×10−3 ×10⁻³ |

|

|

|
1.6
|
123/114 |
| Norm ×10−3 |

|

|

|

|
2.1
|
|
Note.
aParameter frozen during fitting.Download table as: ASCIITypeset image
2.3. Temporal Analysis
A PDS was generated in the energy range 3–80 keV using LAXPC20 data by averaging segments of 282.64 s with 0.0045 s time resolution. It was then binned logarithmically in frequency to obtain the PDS shown in the right panel of Figure 1 in the frequency range 0.004–30 Hz. The spectrum shows a prominent QPO at 47.7 mHz and three broadened noise humps, which can be represented by Lorentzians. There is also a weak feature at 109.4 mHz, and modeling this component with a Lorentzian resulted in a decrease of χ2, i.e., Δχ2 = 12 for three additional degrees of freedom (dof). The final χ2/dof was found to be 123/114 after taking into account 2% systematic error. The best-fit parameters are listed in Table 1.
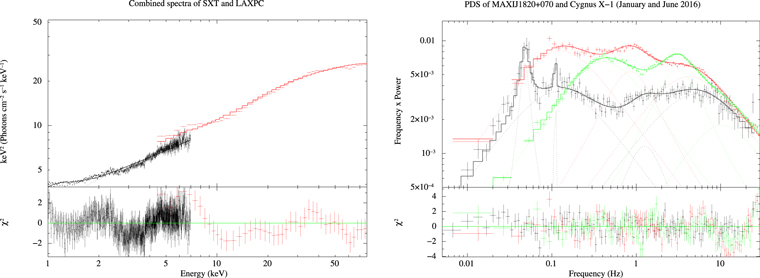
Figure 1. Fitted SXT and LAXPC spectra and residuals for all 15 orbits (left panel). Comparative PDS of MAXI J1820+070 (black) and Cygnus X-1 in 2016 January (green) and June (red) in the 3–80 keV energy band. The PDS of the source is fitted with five Lorentzian components of which the two narrow peaks represent a QPO at 47.7 mHz and a weak oscillation at 109.4 mHz, respectively. The PDS of Cygnus X-1 is fitted with two and three Lorentzian components for January and June, respectively (right panel).
Download figure:
Standard image High-resolution imageFollowing this, we studied energy dependent temporal behavior by adopting the methodology discussed in Maqbool et al. (2019). The complete event mode data available from LAXPC for the computation of fractional rms and time lag for a large number of finer energy bins integrated over a certain frequency range allows one to compare the results directly with models.
We studied energy-dependent fractional rms and time lag in the energy range 3–80 keV for a range of frequencies using the data from LAXPC20. Nowak et al. (1999) and Miyamoto et al. (1988) have shown that the energy dependence of the time lag is logarithmic in nature. Hence, following the procedure discussed in Maqbool et al. (2019) the observed time lag and fractional rms were fit empirically using Equations (1) and (2), respectively.

where E is the energy (keV), f is the frequency (Hz) under consideration, Eref = 4.76 keV is the reference energy, and Td(f) is a constant.

where A(f) and p(f) are constants. We have computed the time lag with respect to the reference energy band 4.15–5.37 keV for a wide range of frequencies. Figure 2 shows the energy-dependent time lag and fractional rms for three representative frequencies of 0.1, 1.0, and 10.0 Hz. The rms decreases with energy depending on the frequency whereas the time lag increases with energy, implying that they are hard lags where the hard energy photons lag the softer ones. Figure 3 (top panel) shows the variation of the best-fit parameters A(f), Td(f), and p(f) with frequency.
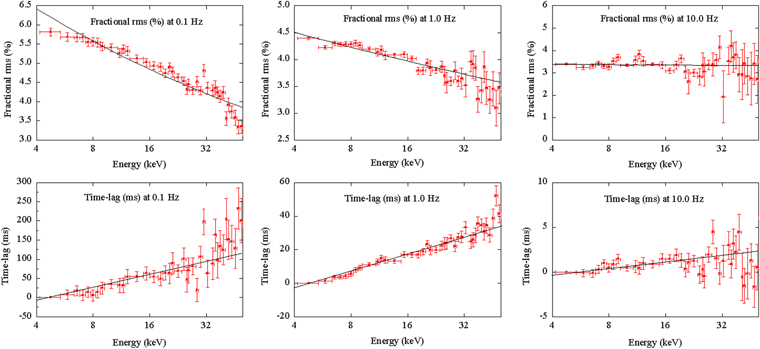
Figure 2. Empirical fit to the observed energy-dependent fractional rms variability (top panel) and time lag (bottom panel) at three fundamental frequencies 0.1, 1.0, and 10.0 Hz as a function of energy.
Download figure:
Standard image High-resolution image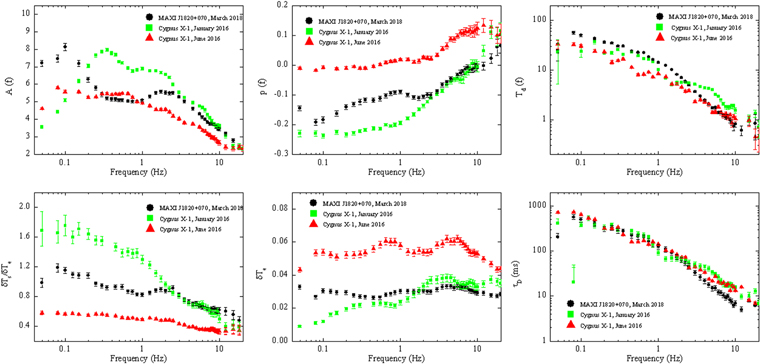
Figure 3. Comparison of the empirical fit parameters (top panel) and the model fit parameters (bottom panel) for MAXI J1820+070 and Cygnus X-1 (2016 January and June) as a function of frequency.
Download figure:
Standard image High-resolution imageAlthough Figure 3 (top panel) gives an idea about temporal behavior of the system in frequency and energy, they neither provide an interpretation of physical behavior of the system nor its association to the time-averaged PDS. Hence, to make such an association we modeled the observed fractional rms and time lag using the stochastic propagation model developed by Maqbool et al. (2019). We present this result along with a comparison of the results of Cygnus X-1 in the following sections.
2.4. Stochastic Propagation Model
The onset of this millennium has seen several ongoing efforts in the development of stochastic propagation models to explain energy-dependent continuum variability observed in most X-ray binaries. Most of these models are built upon the fundamental idea that the perturbations originate at the outer annuli of the disk and propagate toward the central object (Kotov et al. 2001; Ingram & Done 2011, 2012; Ingram & van der Klis 2013; Rapisarda et al. 2016, 2017; Axelsson & Done 2018; Mahmoud & Done 2018). Primarily, these models are aimed at making quantitative predictions of PDS, energy-dependent time lags, and rms variability. Time lags are associated with perturbation propagation time (of the order of viscous timescales), and the prognosis of such studies could provide insights about the geometry of the system in this scenario (Böttcher & Liang 1999; Misra 2000; Kotov et al. 2001).
Kotov et al. (2001) considered the radial profile of the emissivity index and explained the frequency dependency of the time lag. Rapisarda et al. (2017) and Axelsson & Done (2018) linked the production of hard X-rays to the existence of several different Comptonization regions and the origin of photons of various energies with different regions of the accretion disk. However, it is difficult to comprehend the existence of such multi-Comptonization regions, if high-energy photons are indeed produced in the corona having optical depth ∼1. Most importantly, this raises questions about the radial profile of emissivity index. On the other hand, Misra (2000) explained the frequency-dependent time lag by attributing the origin of hard X-ray photons to an optically thick disk with a rapidly varying temperature profile.
Recent work carried out by Cowperthwaite & Reynolds (2014), Hogg & Reynolds (2016), and Ahmad et al. (2018) have shown that for standard optically thick and geometrically thin disks the propagation timescales are frequency dependent and are different from the viscous ones. Maqbool et al. (2019) quantified this behavior for hot, optically thin, geometrically thick flows considering the propagation time from the transition region onward. They also considered the Comptonized spectrum as arising from a single Comptonizing zone as opposed to the multi-Comptonizing zones assumed in previous works. They showed that the observed frequency-dependent time lag between various energy bands may be due to an underlying time lag between seed photon fluctuations and subsequent variation of heating rate of the hot inner flow.
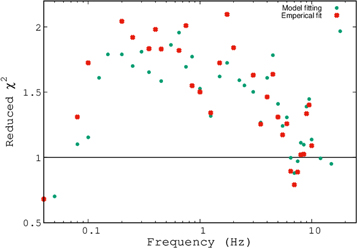
The primary goal here is to quantify fractional rms and time lag measured by LAXPC as described in Section 2.3 in terms of the model discussed in Maqbool et al. (2019). This model is characterized by three parameters: photon index (Γ), electron temperature (Te), and blackbody temperature (Tbb), which are obtained from the spectral fitting described in Section 2.2. Interestingly, this model uses the same number of parameters as in the empirical fitting described in Section 2.3. We were able to quantitatively explain the observed variability using only three parameters (the normalized amplitudes of temperature of the truncated disk (δTs), hot inner flow (δTe), and the time lag between them (τD)). The results of the model fitting are shown in Figure 3 (bottom panel), where δTe, τD and the ratio δTs/δTe are plotted against frequency. The variation of δTe shows three broadened humps, which reflect the features exhibited in the PDS described in Section 2.3. Time delay or time lag (τD) between the variation of disk temperature and that of the Comptonizing cloud is a function of frequency. At frequencies <2 Hz the lags are of the order of 100 ms, whereas at frequencies >2 Hz one sees a time delay of the order of 10 ms. The ratio δTs/δTe represents the attenuation of propagation from the disk to corona. This ratio is about 1.2 at lower frequencies (<0.2 Hz) and roughly flattens out until 2 Hz, just before dropping slightly at higher frequencies (>2 Hz). The results of the modeling showed good agreement with the empirical fit. The reduced χ2 in both cases (empirical and model fit) were around 2 and showed a similar trend (Figure 4), thereby making the empirical functions defined in Section 2.3 adequate.
Figure 4. Reduced χ2 values from the empirical and model fits plotted as a function of frequency.
Download figure:
Standard image High-resolution image
2.5. Comparison with Cygnus X-1
Most BHXBs in their hard state show similar spectro-timing characteristics (Uttley et al. 2014). Cygnus X-1, being the most studied X-ray source by generations of X-ray missions, spends most of its time in a hard state (Zhang et al. 1997). The spectro-timing features of Cygnus X-1 are relatively well known as compared to other BHXBs, thus making it suitable for comparative studies.
Maqbool et al. (2019) studied six AstroSat observations of Cygnus X-1 in its hard state, spread out between 2016 January and October. Spectral analysis of these observations revealed a cooler disk (∼0.46 keV) with large diskbb normalization (∼2400) for 2016 January as compared to the other months. Moreover, the PDS of January was found to have only two broadened noise humps, whereas the other months showed three humps (Figure 1, right panel). In this work, we have compared our temporal analysis results with 2016 January and June data of Cygnus X-1 (Figure 3).
The hard-state power spectra for Cygnus X-1 and MAXI J1820+070 show broadband noise features in the frequency range ∼5 mHz to ∼20 Hz, but their detailed spectral shapes are different (Figure 1, right panel). This is also reflected in the model fit parameters such as the variation of δTe as a function of frequency (Figure 3, bottom-middle panel). The detailed shapes of the variation is different for the two Cygnus X-1 observations and for MAXI J1820+070. However, one sees that the attenuation factor (δTs/δTe) for MAXI J1820+070 is remarkably similar to the January observation of Cygnus X-1 for frequencies greater than ∼2 Hz (Figure 3, bottom-left panel). The time delay (τD) between the variation of the soft inner disk temperature (δTs) and the inner region one (δTe) seems to have the same general frequency dependence for both the Cygnus X-1 observations and the MAXI source, although the time delay for the MAXI source is lower at high frequencies (Figure 3, bottom-right panel).
The temporal behavior of the system, especially at high frequencies, should depend on the geometry of the inner region, which in turn would be characterized by physical parameters such as the inner disk radius and accretion rate. The different temporal behaviors seen for different Cygnus X-1 observations may be related to changes in these parameters. Differences between MAXI J1820+070 and Cygnus X-1 could be additionally due to the systems having different black hole masses, the latter being a transient while Cygnus X-1 is a persistent source. Thus, it is interesting to note the qualitative similarity between the two sources, especially the frequency dependence of the time delay τD, which seems to be similar for both sources and for different Cygnus X-1 observations, although the lower values seen at high frequency for MAXI J1820+070 may imply a lower black hole mass than Cygnus X-1. The attenuation factor for the MAXI source is similar to the January observation at high frequencies, implying that perhaps they were having similar geometries, but one should keep in mind the differences in the low frequency behavior and the overall PDS.
3. Results and Discussion
We report the results of spectro-timing analysis of MAXI J1820+070 as observed by SXT and LAXPC on board AstroSat for the first time. We have analyzed ∼93 ks of observed data corresponding to 15 individual satellite orbits. The broadband spectrum observed by SXT and LAXPC in the energy range 0.7–80.0 keV was well represented by a dominant thermal Comptonization component, along with reflection and disk emission. The combined spectrum was modeled using a combination of tbabs, ireflect, nthcomp, and diskbb models. The PDS could be modeled with five Lorentzian components, a QPO with centroid frequency at 47.7 mHz, a weak oscillation at 109.4 mHz, and three broadened noise humps spread over 0.004–30 Hz. This is the first confirmed report of detection of a QPO at 47.7 mHz in MAXI J1820+070 (Homan et al. 2018; Mereminskiy et al. 2018) using AstroSat. For a range of frequencies, LAXPC provides an unprecedented view of the energy-dependent (3–80 keV) fractional rms and time lags. AstroSat's capability of measuring the broadband time-averaged spectrum and the energy-dependent temporal behavior of the system allows one to quantitatively fit both spectral and temporal data.
The stochastic propagation model (Maqbool et al. 2019) is able to quantitatively fit the energy-dependent temporal features. The fitting provides physical measurement of the time taken for a perturbation to travel from truncation radius to the inner regions of accretion disk. It also quantifies the normalized variation of temperatures due to inward propagation of perturbations. The results of modeling revealed that the perturbation time delay is of the order of 100 ms and is frequency dependent.
The authors would like to thank the anonymous reviewer for valued comments and suggestions that greatly improved this manuscript. This work began at IUCAA-APT Mini School on X-ray Astronomy Data Analysis held at Providence Women's College, Kozhikode. This work has used the data from the Soft X-ray Telescope (SXT) developed at TIFR, Mumbai, and the SXT POC at TIFR is thanked for verifying and releasing the data via the ISSDC data archive and providing the necessary software tools. The LAXPC POC team is thanked for their support and timely release of data. This work has made use of software provided by HEASARC. S.P.M. thanks CHRIST (Deemed to be University), Bengaluru, for the "Research Assistant" position through MRPDSC-1721. S.B.G. & B.S.G. acknowledge Centre for Research, CHRIST (Deemed to be University), Bengaluru, for the research funding (MRPDSC-1721). S.B.G. thanks the Inter-University Centre for Astronomy and Astrophysics (IUCAA), Pune, for Visiting Associateship.
Footnotes
- 4
- 5
- 6